Nepal Mannequins Market (2026-2032) Outlook | Growth, Share, Revenue, Analysis, Size, Forecast, Companies, Value, Trends & Industry
Market Forecast By Types (Male mannequins, Female mannequins, Child mannequins, Torso forms), By Application (Garment Industry, Jewelry industry, Cosmetics industry) And Competitive Landscape
| Product Code: ETC085135 | Publication Date: Jun 2021 | Updated Date: Jun 2026 | Product Type: Report | |
| Publisher: 6Wresearch | Author: Summon Dutta | No. of Pages: 70 | No. of Figures: 35 | No. of Tables: 5 |
Nepal Mannequins Market Size, Share & Growth Rate
The Nepal Mannequins Market was estimated at USD 490 Million in 2025 and is projected to reach USD 670 Million by 2032, growing at a CAGR of 4.6% from 2026 to 2032. This growth is largely fueled by an expanding retail sector, with clothing stores and fashion boutiques increasingly adopting advanced visual merchandising strategies. Additionally, the rise in disposable income and urbanization plays a significant role in shaping consumer purchasing behaviors, further driving demand for mannequins in Nepal.
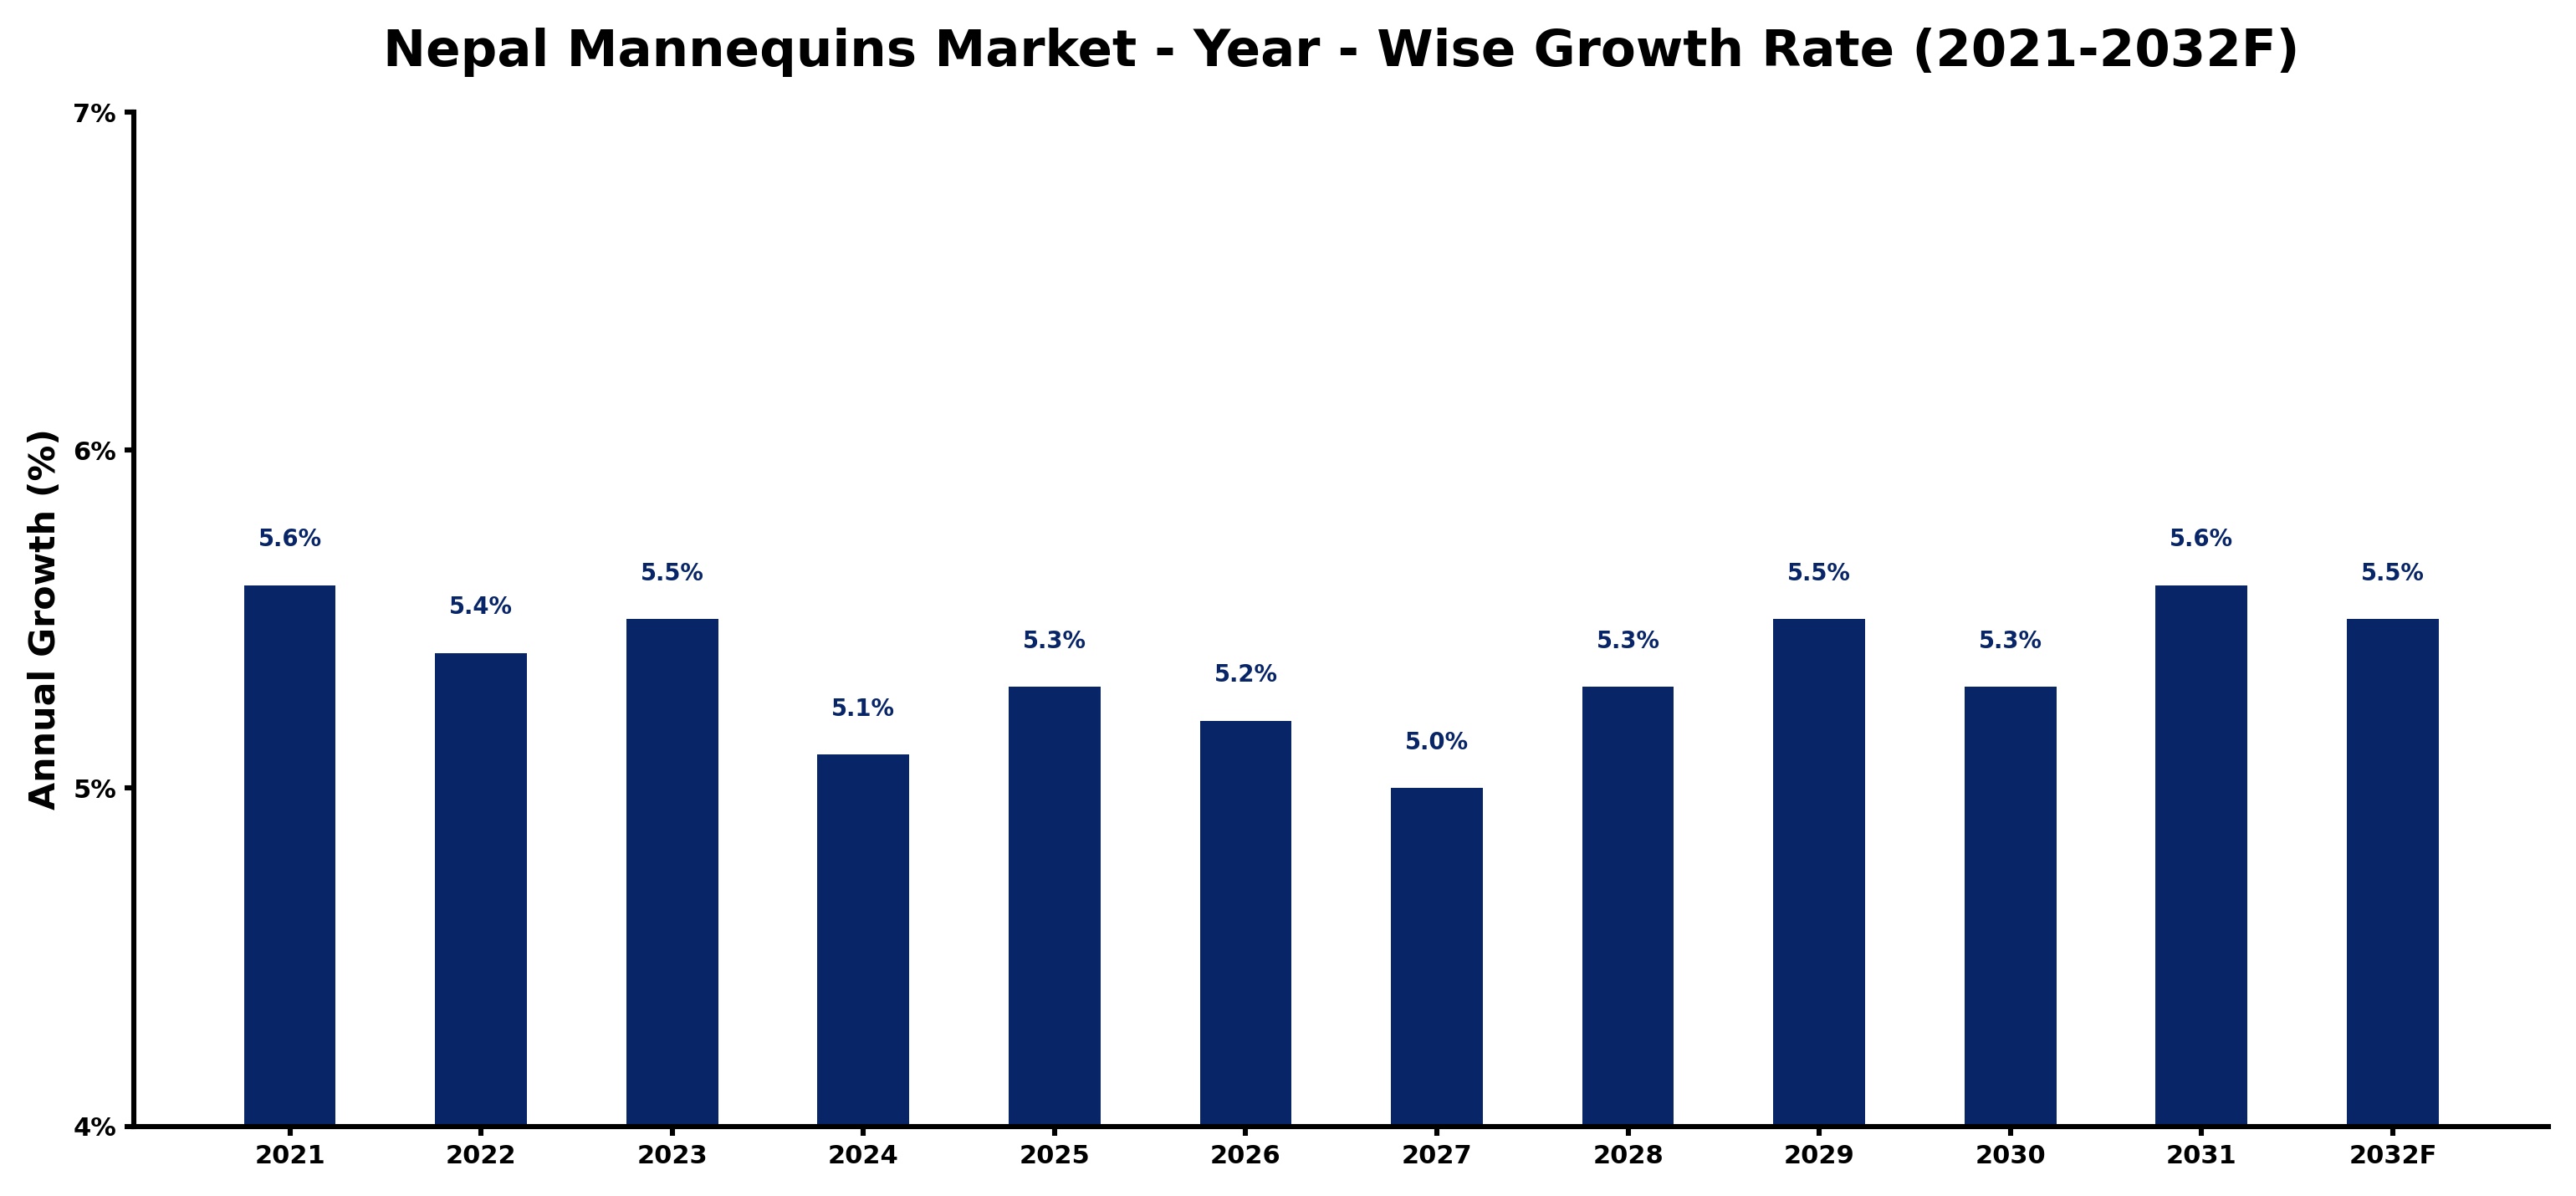
Nepal Mannequins Market Growth Rate Analysis (2021-2032)
The Nepal mannequins market has displayed a stable growth pattern over recent years, with yearly growth rates of 5.6% in 2021 and 5.4% in 2022, reflecting sustained consumer demand from the retail sector. Growth slightly dipped to 5.1% in 2024, influenced by supply chain disruptions, but rebounded to 5.3% in 2025 as local manufacturing improved. The trend continued with varied fluctuations, showcasing the market’s resilience: 5.5% in 2029 and 5.6% in 2031, driven by increased investments in retail infrastructure and digitalization efforts among businesses. These factors have collectively fostered a conducive environment for the market, reinforcing its stability and gradual expansion.
Nepal Mannequins Market Year-wise Growth Rate and Key Drivers
This graph highlights how the Nepal Mannequins Market has steadily grown over the past five years, supported by major growth factors.
The table below presents the year‑wise growth rates along with the key drivers influencing the market
| Year | Growth Rate | Major Drivers |
| 2021 | 5.6% | Increasing adoption of advanced technologies |
| 2022 | 5.4% | Growing renewable energy integration projects |
| 2023 | 5.5% | Increasing industrial infrastructure investments |
| 2024 | 5.1% | Expansion of manufacturing activities |
| 2025 | 5.3% | Growing urbanization and commercial development |
| 2026 | 5.2% | Rapid growth in telecom and data center sectors |
| 2027 | 5.0% | Rapid growth in telecom and data center sectors |
| 2028 | 5.3% | Rising electricity demand across industries |
| 2029 | 5.5% | Growing urbanization and commercial development |
| 2030 | 5.3% | Increasing smart city development projects |
| 2031 | 5.6% | Expansion of manufacturing activities |
| 2032 | 5.5% | Expansion of transportation and logistics networks |
Note - Market size estimations and growth projections presented in this report are based on 6Wresearch’s advanced forecasting approach, validated with industry datasets as of June 2026.
Nepal Mannequins Market Synopsis
The most influential factor shaping the Nepal Mannequins Market today is the rising demand for visual merchandising. Retailers are keen on enhancing the shopping experience, and mannequins serve as vital tools for showcasing merchandise effectively. As more shops focus on aesthetics, the variety of mannequins offered has also expanded, accommodating diverse consumer tastes.
Moreover, there is a burgeoning interest in sustainability, with eco-friendly mannequin options gaining popularity. This trend reflects a larger global movement towards environmental consciousness, compelling retailers to align their practices with consumer values that prioritize sustainability and inclusivity.
Nepal Mannequins Market Key Takeaways
- The market is projected to grow from USD 490 Million in 2025 to USD 670 Million by 2032, representing a CAGR of 4.6%.
- Demand is primarily driven by the retail sector, particularly clothing stores and fashion boutiques.
- There is a notable shift towards eco-friendly and sustainable mannequin options.
- Diversity in mannequin representation is increasingly important, reflecting body positivity and inclusivity.
- Challenges in supply chain and limited variety pose obstacles for retailers seeking diverse mannequin options.
Evaluation of Restraints in Nepal Mannequins Market
Despite the positive outlook, the Nepal Mannequins Market faces significant restraints. A key limitation is the restricted availability of high-quality mannequins, as the market's smaller size constrains the supply chain. This results in limited options for retailers seeking specific designs, sizes, or materials. Additionally, high import costs due to shipping and customs expenses exacerbate the situation, restricting the diversity retailers require to fully engage their consumer base. Addressing these issues is critical for unlocking the market's full potential.
Nepal Mannequins Market Trends
Several trends are currently influencing the Nepal Mannequins Market. One prominent trend is the growing demand for more diverse and inclusive mannequin designs, including varied body shapes, sizes, and skin tones. Retailers are increasingly acknowledging the importance of representation in their display strategies. Furthermore, the market is witnessing a rise in the customization of mannequins, allowing retailers to align products closely with their brand identity.
Another trend is the increasing emphasis on sustainability. Many retailers are prioritizing eco-friendly mannequins made from recyclable materials, reflecting broader industry trends towards environmentally conscious practices. This shift is indicative of a changing landscape where consumers are not just looking for products but are increasingly interested in the values and ethics behind the brands they support.
Nepal Mannequins Market Opportunities
The Nepal Mannequins Market presents lucrative investment opportunities for both local and international players. The expanding retail landscape offers a chance to manufacture and distribute a wider range of mannequins, particularly those that meet the evolving demands of realism and customization. Additionally, investing in sustainable manufacturing processes can attract businesses looking to enhance their environmental credentials. Collaborating with local retailers to develop tailored mannequin solutions can also prove beneficial in tapping into niche markets.
Government Initiatives in the Nepal Mannequins Market
Currently, the Nepalese government lacks specific regulations directly impacting the mannequins market. However, general business laws, including taxation and labor regulations, apply to companies operating within this sector. Compliance with import/export laws is crucial for businesses importing mannequins, as permits and customs procedures must be observed. As the market evolves, there is potential for future government initiatives to address industry-specific regulations, ensuring a fair and competitive marketplace.
Future Insights of the Nepal Mannequins Market
Looking ahead to 2026-2032, the Nepal Mannequins Market is set for sustained growth driven by a shift towards modern visual merchandising techniques. The continued rise of retail outlets in urban areas will boost the demand for mannequins, particularly in the fashion segment. As sustainability becomes increasingly paramount, advancements in manufacturing processes will likely yield more environmentally friendly options. The focus on enhancing customer experiences will further spur innovation in mannequin design, potentially leading to the development of smarter, interactive displays.
Nepal Mannequins Market Latest Developments (May 2025 - June 2026)
Recent developments in the Nepal Mannequins Market indicate a growing trend toward incorporating technology into mannequin design. Some retailers are exploring smart mannequins equipped with sensors to provide real-time feedback on customer interactions, enhancing the shopping experience. Additionally, collaborations between local manufacturers and international design firms are emerging, aiming to bring fresh, innovative styles to the market, reflecting both local culture and global trends.
Nepal Mannequins Market - Key Attractiveness of the Report
- 10 Years of Market Numbers
- Historical Data Starting from 2022 to 2025
- Base Year: 2025
- Forecast Data until 2032
- Key Performance Indicators Impacting the Market
- Major Upcoming Developments and Projects
Key Highlights of the Report:
- Nepal Mannequins Market Outlook
- Market Size of Nepal Mannequins Market, 2025
- Forecast of Nepal Mannequins Market, 2032
- Historical Data and Forecast of Nepal Mannequins Revenues & Volume for the Period 2022-2032F
- Nepal Mannequins Market Trend Evolution
- Nepal Mannequins Market Drivers and Challenges
- Nepal Mannequins Price Trends
- Nepal Mannequins Porter's Five Forces
- Nepal Mannequins Industry Life Cycle
- Historical Data and Forecast of Nepal Mannequins Market Revenues & Volume By Types for the Period 2022-2032F
- Historical Data and Forecast of Nepal Mannequins Market Revenues & Volume By Male mannequins for the Period 2022-2032F
- Historical Data and Forecast of Nepal Mannequins Market Revenues & Volume By Female mannequins for the Period 2022-2032F
- Historical Data and Forecast of Nepal Mannequins Market Revenues & Volume By Child mannequins for the Period 2022-2032F
- Historical Data and Forecast of Nepal Mannequins Market Revenues & Volume By Torso forms for the Period 2022-2032F
- Historical Data and Forecast of Nepal Mannequins Market Revenues & Volume By Application for the Period 2022-2032F
- Historical Data and Forecast of Nepal Mannequins Market Revenues & Volume By Garment Industry for the Period 2022-2032F
- Historical Data and Forecast of Nepal Mannequins Market Revenues & Volume By Jewelry industry for the Period 2022-2032F
- Historical Data and Forecast of Nepal Mannequins Market Revenues & Volume By Cosmetics industry for the Period 2022-2032F
- Nepal Mannequins Import Export Trade Statistics
- Market Opportunity Assessment By Types
- Market Opportunity Assessment By Application
- Nepal Mannequins Top Companies Market Share
- Nepal Mannequins Competitive Benchmarking By Technical and Operational Parameters
- Nepal Mannequins Company Profiles
- Nepal Mannequins Key Strategic Recommendations
Nepal Mannequins Market - Frequently Asked Questions
The Nepal Mannequins Market is expected to grow from USD 490 Million in 2025 to USD 670 Million by 2032, reflecting a CAGR of 4.6% during the period from 2026 to 2032.
Trends include a heightened emphasis on diversity and inclusivity in mannequin designs, alongside increasing demand for eco-friendly options as retailers align with sustainability goals.
Yes, retailers often encounter challenges such as limited availability of diverse mannequin options and high import costs, making it difficult to meet specific aesthetic requirements.
Both traditional fiberglass mannequins and eco-friendly models made from recyclable materials are gaining traction, with an increasing focus on customization to meet individual retailer needs.
Visual merchandising is critically important as it directly influences customer engagement and purchase decisions. Retailers are increasingly investing in mannequins to enhance their displays and create immersive shopping experiences.
6Wresearch actively monitors the Nepal Mannequins Market and publishes its comprehensive annual report, highlighting emerging trends, growth drivers, revenue analysis, and forecast outlook. Our insights help businesses to make data-backed strategic decisions with ongoing market dynamics. Our analysts track relevent industries related to the Nepal Mannequins Market, allowing our clients with actionable intelligence and reliable forecasts tailored to emerging regional needs.
Yes, we provide customisation as per your requirements. To learn more, feel free to contact us on sales@6wresearch.com
1 Executive Summary |
2 Introduction |
2.1 Key Highlights of the Report |
2.2 Report Description |
2.3 Market Scope & Segmentation |
2.4 Research Methodology |
2.5 Assumptions |
3 Nepal Mannequins Market Overview |
3.1 Nepal Country Macro Economic Indicators |
3.2 Nepal Mannequins Market Revenues & Volume, 2022 & 2032F |
3.3 Nepal Mannequins Market - Industry Life Cycle |
3.4 Nepal Mannequins Market - Porter's Five Forces |
3.5 Nepal Mannequins Market Revenues & Volume Share, By Types, 2022 & 2032F |
3.6 Nepal Mannequins Market Revenues & Volume Share, By Form, 2022 & 2032F |
4 Nepal Mannequins Market Dynamics |
4.1 Impact Analysis |
4.2 Market Drivers |
4.3 Market Restraints |
5 Nepal Mannequins Market Trends |
6 Nepal Mannequins Market, By Types |
6.1 Nepal Mannequins Market, By Types |
6.1.1 Overview and Analysis |
6.1.2 Nepal Mannequins Market Revenues & Volume, By Types, 2022-2032F |
6.1.3 Nepal Mannequins Market Revenues & Volume, By Male mannequins, 2022-2032F |
6.1.4 Nepal Mannequins Market Revenues & Volume, By Female mannequins, 2022-2032F |
6.1.5 Nepal Mannequins Market Revenues & Volume, By Child mannequins, 2022-2032F |
6.1.6 Nepal Mannequins Market Revenues & Volume, By Torso forms, 2022-2032F |
6.2 Nepal Mannequins Market, By Application |
6.2.1 Overview and Analysis |
6.2.2 Nepal Mannequins Market Revenues & Volume, By Garment Industry, 2022-2032F |
6.2.3 Nepal Mannequins Market Revenues & Volume, By Jewelry industry, 2022-2032F |
6.2.4 Nepal Mannequins Market Revenues & Volume, By Cosmetics industry, 2022-2032F |
7 Nepal Mannequins Market Import-Export Trade Statistics |
7.1 Nepal Mannequins Market Export to Major Countries |
7.2 Nepal Mannequins Market Imports from Major Countries |
8 Nepal Mannequins Market Key Performance Indicators |
9 Nepal Mannequins Market - Opportunity Assessment |
9.1 Nepal Mannequins Market Opportunity Assessment, By Types, 2022 & 2032F |
9.2 Nepal Mannequins Market Opportunity Assessment, By Application, 2022 & 2032F |
10 Nepal Mannequins Market - Competitive Landscape |
10.1 Nepal Mannequins Market Revenue Share, By Companies, 2025 |
10.2 Nepal Mannequins Market Competitive Benchmarking, By Operating and Technical Parameters |
11 Company Profiles |
12 Recommendations |
13 Disclaimer |
Global Go To Market Strategy - 2030
Export potential enables firms to identify high-growth global markets with greater confidence by combining advanced trade intelligence with a structured quantitative methodology. The framework analyzes emerging demand trends and country-level import patterns while integrating macroeconomic and trade datasets such as GDP and population forecasts, bilateral import–export flows, tariff structures, elasticity differentials between developed and developing economies, geographic distance, and import demand projections. Using weighted trade values from 2020–2024 as the base period to project country-to-country export potential for 2030, these inputs are operationalized through calculated drivers such as gravity model parameters, tariff impact factors, and projected GDP per-capita growth. Through an analysis of hidden potentials, demand hotspots, and market conditions that are most favorable to success, this method enables firms to focus on target countries, maximize returns, and global expansion with data, backed by accuracy.
By factoring in the projected importer demand gap that is currently unmet and could be potential opportunity, it identifies the potential for the Exporter (Country) among 190 countries, against the general trade analysis, which identifies the biggest importer or exporter.
To discover high-growth global markets and optimize your business strategy:
Click Here
Pricing
- Single User License$ 1,995
- Department License$ 2,400
- Site License$ 3,120
- Global License$ 3,795

Leadership Perspectives from Industry Events
Search
Thought Leadership and Analyst Meet


Our Clients
6WResearch In News
- India Air Conditioner Market Set for Strong Rebound in 2026 After Weather-Led Correction and GST-Driven Recovery: 6Wresearch
- ADAS in India: How Automatic Emergency Braking, Blind Spot Detection & Driver Monitoring are Transforming Road Safety
- Doha a strategic location for EV manufacturing hub: IPA Qatar
- Demand for luxury TVs surging in the GCC, says Samsung
- Empowering Growth: The Thriving Journey of Bangladesh’s Cable Industry
- Demand for luxury TVs surging in the GCC, says Samsung
Latest Reports
- Nicaragua RPG Gaming Market (2026-2032)
- New Zealand RPG Gaming Market (2026-2032)
- Netherlands RPG Gaming Market (2026-2032)
- Nauru RPG Gaming Market (2026-2032)
- Namibia RPG Gaming Market (2026-2032)
- Mozambique RPG Gaming Market (2026-2032)
- Montenegro RPG Gaming Market (2026-2032)
- Mongolia RPG Gaming Market (2026-2032)
- Monaco RPG Gaming Market (2026-2032)
- Micronesia RPG Gaming Market (2026-2032)
Industry Events and Analyst Meet

HIMTEX 2026

India Refining Summit 2026

India EV Show 2026

EV tech India Expo 2026

Auto Tech Asia 2026
Whitepaper
- Middle East & Africa Commercial Security Market Click here to view more.
- Middle East & Africa Fire Safety Systems & Equipment Market Click here to view more.
- GCC Drone Market Click here to view more.
- Middle East Lighting Fixture Market Click here to view more.
- GCC Physical & Perimeter Security Market Click here to view more.