Nepal Physical Security Market Size & Growth Rate (2026-2032)
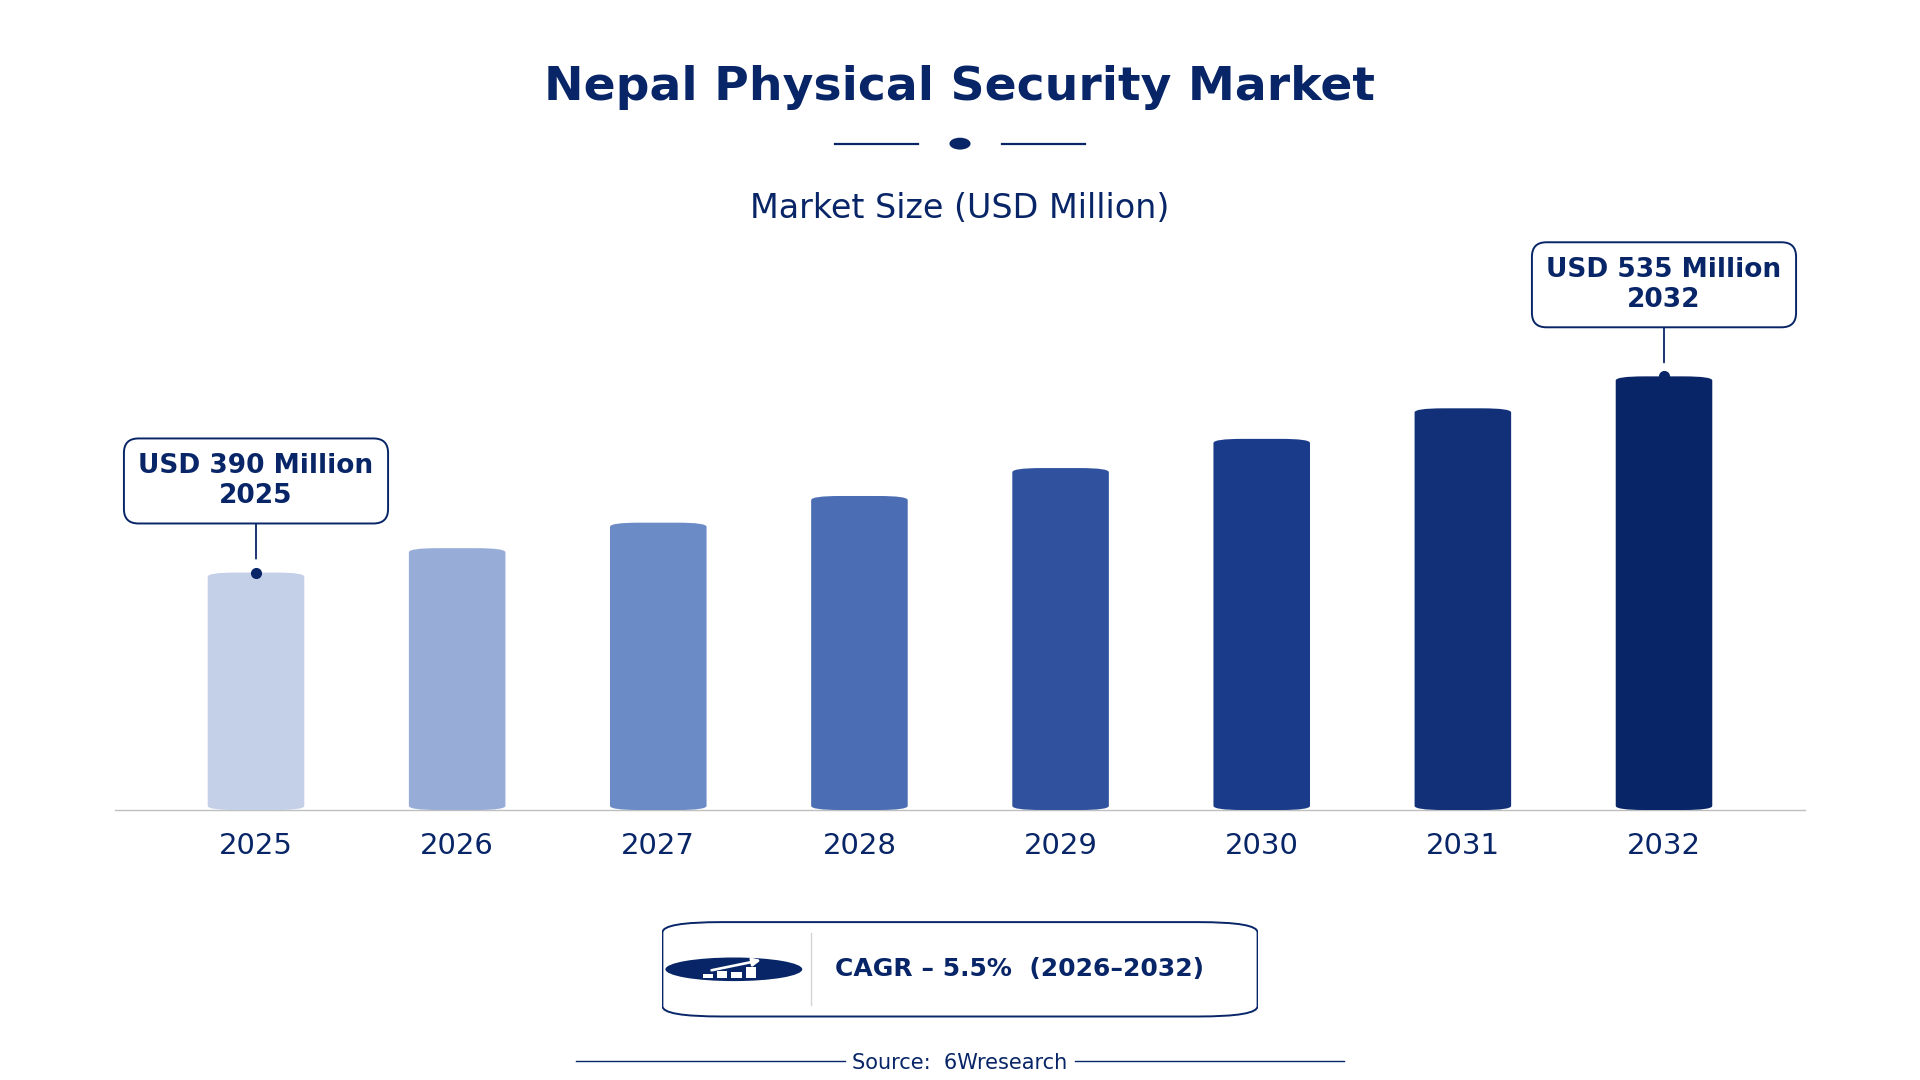
The Nepal Physical Security Market was estimated at USD 390 Million in 2025 and is projected to reach USD 535 Million by 2032, growing at a CAGR of 5.5% from 2026 to 2032.
Nepal Physical Security Market Synopsis
A marked increase in crime rates and public safety concerns is driving the demand for physical security solutions in Nepal. Organizations, ranging from government institutions to private enterprises, are investing heavily in systems such as access control and video surveillance to safeguard their assets and personnel.
The market is characterized by a mix of local companies and international suppliers offering diverse product lines. Recent technological advancements, especially in AI and cloud-based solutions, are rapidly transforming how security services are delivered in this region, allowing for more sophisticated and integrated systems.
Nepal Physical Security Market Year-wise Growth Rate and Key Drivers
This graph illustrates the annual growth rates of the Nepal Physical Security Market from 2021 to 2032, highlighting a steady upward trajectory and projected expansion over the forecast period.
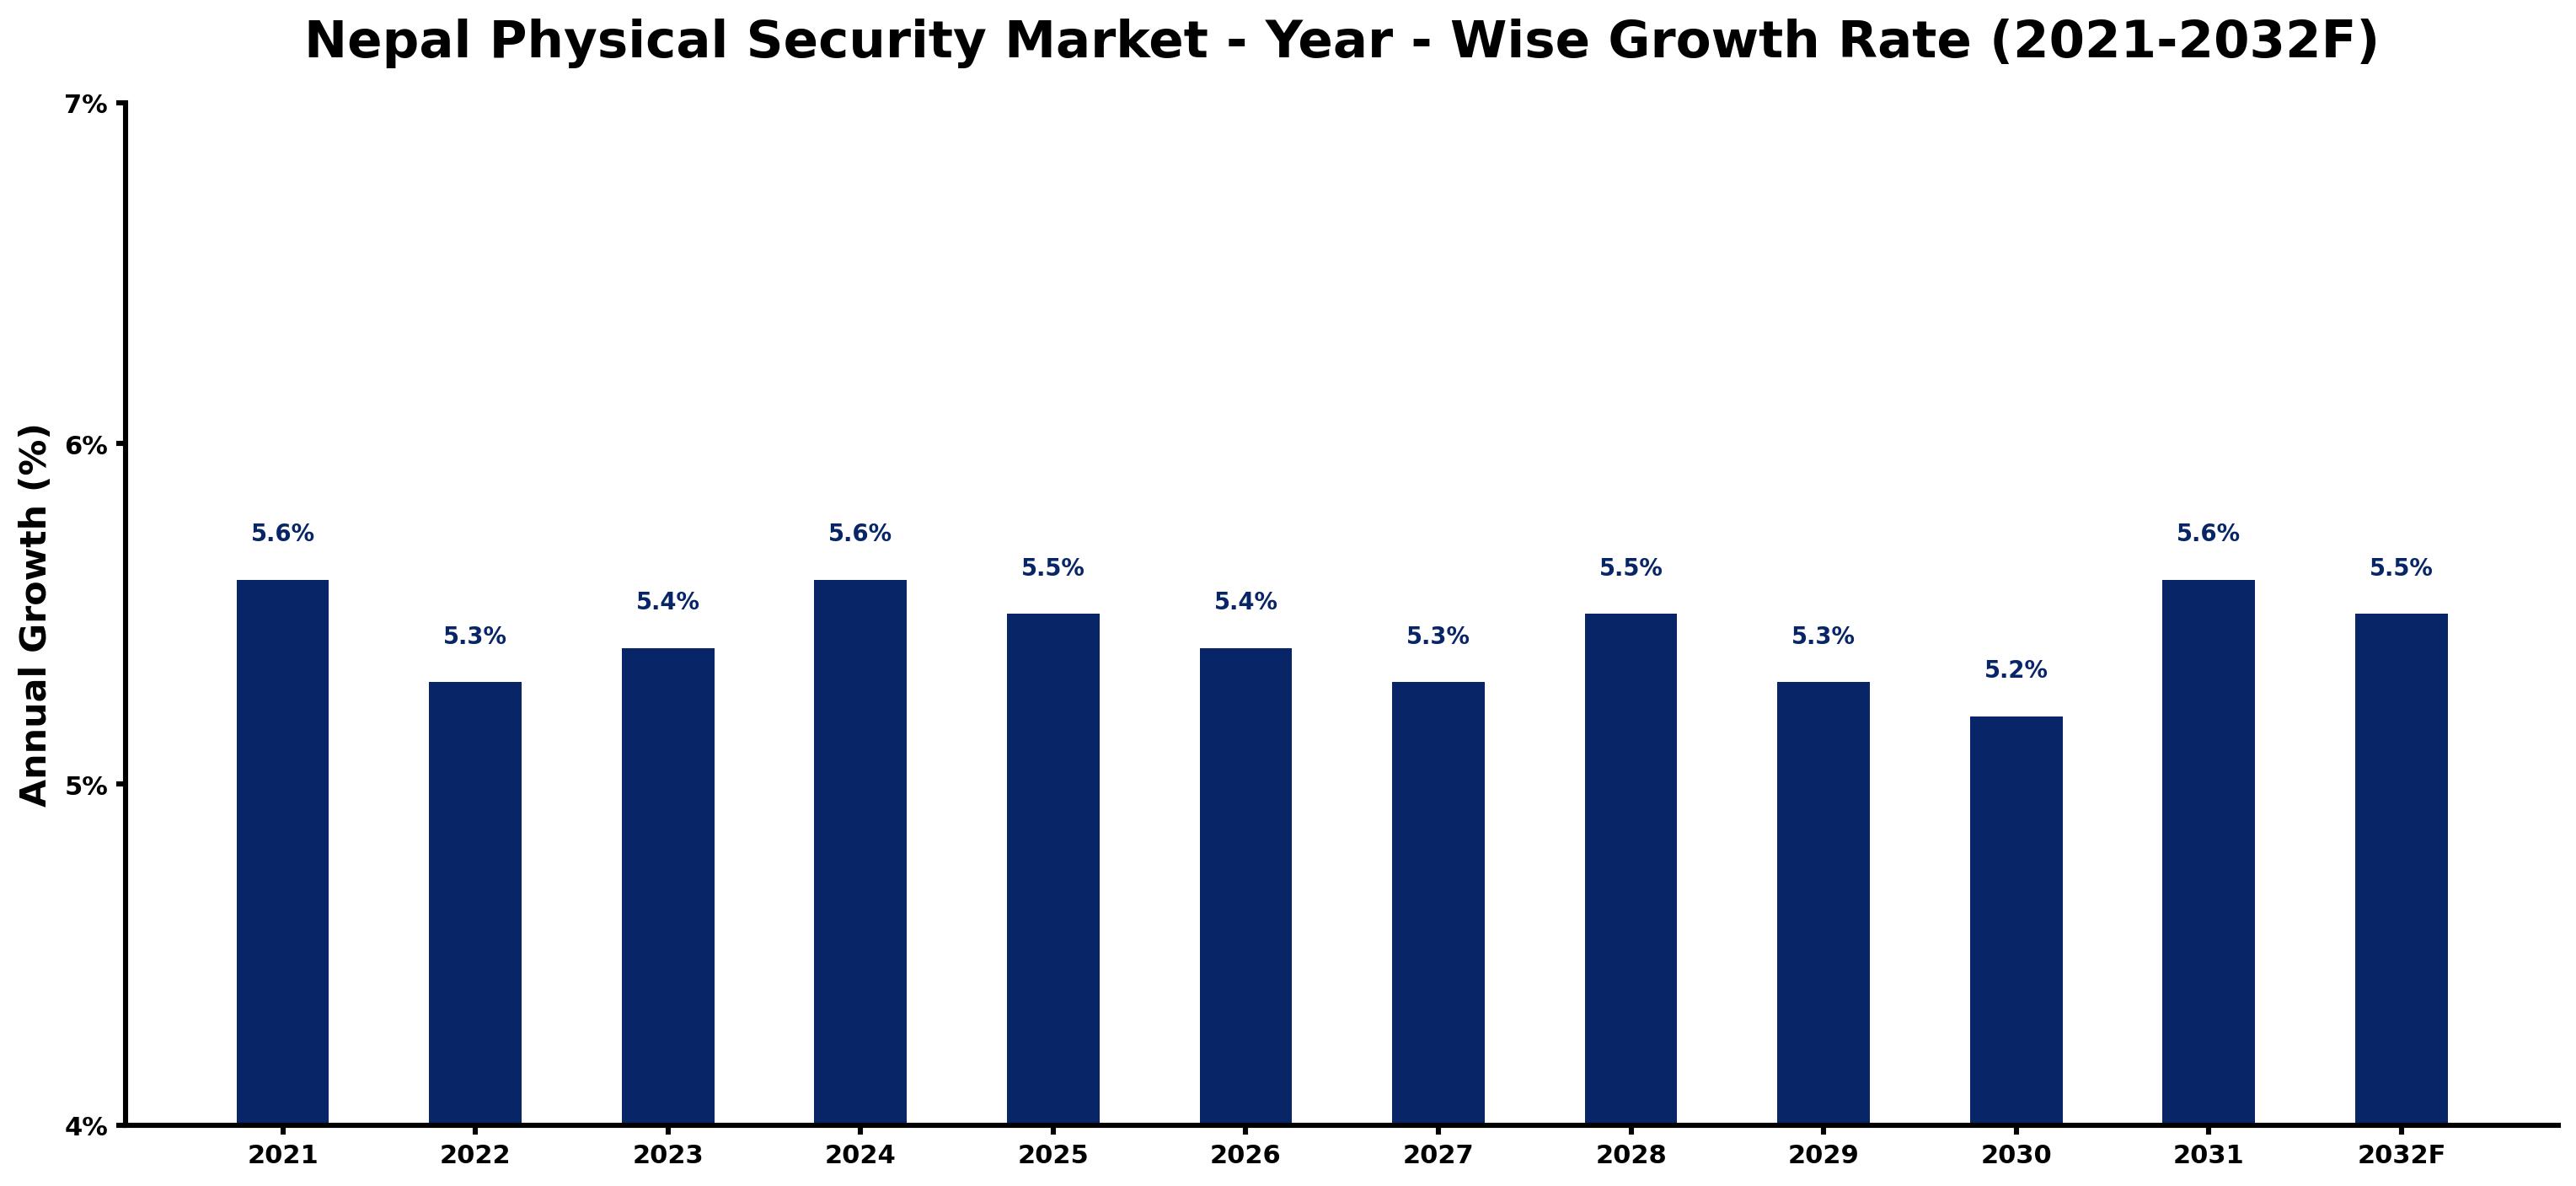
The table below presents the year‑wise growth rates along with the key drivers influencing the market
| Year | Growth Rate | Major Drivers |
| 2021 | 5.6% | Government initiatives enhancing public safety infrastructure investments. |
| 2022 | 5.3% | Rising tourism in Nepal increasing security service demand. |
| 2023 | 5.4% | Increased wealth levels driving home security system installations. |
| 2024 | 5.6% | Growing urbanization leading to higher residential security needs. |
| 2025 | 5.5% | Regulatory body mandates for improved safety in businesses. |
| 2026 | 5.4% | Community awareness programs boosting local security technology adoption. |
| 2027 | 5.3% | Local events increasing temporary security staffing requirements. |
| 2028 | 5.5% | Increased insurance requirements driving demand for physical security. |
| 2029 | 5.3% | Growth in expatriate community enhancing personal security investments. |
| 2030 | 5.2% | Heightened concerns over civil unrest prompting security upgrades. |
| 2031 | 5.6% | Smart home trends encouraging integration of security systems. |
| 2032 | 5.5% | Increased focus on corporate governance leading to security audits. |
Note: Market size estimations and growth projections presented in this report are based on 6Wresearch's proprietary forecasting methodology, utilizing the latest available industry data, government publications, and primary research inputs.
Nepal Physical Security Market Key Takeaways
Below are some of the specific key takeaways from the market, including:
- Growing public and private sector investments in advanced security technologies.
- Rise in the adoption of integrated security solutions combining multiple systems.
- Increased emphasis on cybersecurity within physical security frameworks.
- Heightened awareness of personal and asset protection driving market demand.
- Government initiatives promoting the use of technological security measures.
Evaluation of Restraints in Nepal Physical Security Market
The Nepal Physical Security Market faces notable restraints that can hinder its growth trajectory. Chief among them is the country’s inadequate infrastructure, which complicates the deployment of sophisticated security solutions. Limited budgets across both private enterprises and government institutions further restrict investment capabilities in state-of-the-art security technologies.
Additionally, the challenge of political instability adds an unpredictable layer, making long-term planning difficult for businesses. A shortage of skilled professionals to implement and maintain advanced security systems also poses a significant barrier. Collectively, these factors can create vulnerabilities within the market.
Nepal Physical Security Market Trends
Recent trends reveal a strong pivot towards cutting-edge technologies such as biometric authentication and AI-integrated surveillance systems. Organizations are now seeking integrated solutions that provide a comprehensive approach to security, enhancing both efficiency and effectiveness.
The shift toward cloud-based security solutions is notable, offering flexibility and scalability to businesses. There is also a burgeoning focus on cybersecurity measures, as the lines between physical security and cyber threats continue to blur, making it imperative for security systems to safeguard against digital risks as well.
Nepal Physical Security Market Opportunities
Investment opportunities abound in the Nepal Physical Security Market, especially in the government sector, which is focused on upgrading security infrastructure. Technologies such as video surveillance and intrusion detection systems are in high demand as public safety initiatives are prioritized.
Private enterprises are also ramping up their security measures, presenting a ripe market for innovative solutions. Companies with cutting-edge technologies that cater to the unique challenges of Nepal's rugged landscape stand to gain significantly. The upcoming smart city projects will further amplify demand for sophisticated physical security measures.
Government Initiatives in the Nepal Physical Security Market
Government policy is increasingly shaping the Nepal Physical Security Market, focusing on ensuring safety through regulatory frameworks and standards. Initiatives aimed at enhancing public security infrastructure are underway, reflecting the authorities’ commitment to countering rising crime rates and maintaining stability.
- A national surveillance enhancement program launched in early 2025, aimed at deploying advanced CCTV systems across urban areas.
- Ongoing initiatives to establish training programs for security personnel, ensuring compliance with new industry standards and best practices.
- Current pilot projects integrating AI technologies into existing security systems to improve response times and incident management.
- Plans for a comprehensive regulatory framework expected to be introduced in 2026, addressing security personnel licensing and technology integration.
- An upcoming public-private partnership aimed at upgrading critical infrastructure, with a focus on securing public spaces by 2028.
Future Insights of the Nepal Physical Security Market
Looking ahead to 2026-2032, the Nepal Physical Security Market is set to expand significantly. The convergence of technological advancements with rising safety concerns will likely drive demand for sophisticated security solutions.
With urbanization and smart city initiatives on the rise, there will be a pronounced focus on integrated security solutions that address complex challenges. Expect to see a heightened adoption of IoT devices and AI-powered analytics in physical security systems, reflecting a growing recognition of the need for multifaceted protection strategies.
Nepal Physical Security Market Latest Developments
Over the last 12-14 months, the Nepal Physical Security Market has seen notable developments reflecting increasing investment and technological innovation. The government’s push for enhanced security has galvanized both public and private sectors into action, leading to new projects and partnerships.
- A major technology vendor has launched a new biometric access control system in early 2025, focusing on high-security zones.
- Currently underway is an initiative to integrate cloud-based solutions within government facilities, anticipated to streamline operations and improve response capabilities.
- An ongoing partnership between security firms to develop comprehensive training programs for new technologies, ensuring personnel are adequately prepared.
- Planned upgrades to urban public security systems scheduled for mid-2026, expected to incorporate advanced surveillance technology.
- A rollout of a national cybersecurity framework that complements physical security measures is expected to begin in Q3 2025.
Nepal Physical Security Market - Key Attractiveness of the Report
- 10 Years of Market Numbers
- Historical Data Starting from 2022 to 2025
- Base Year: 2025
- Forecast Data until 2032
- Key Performance Indicators Impacting the Market
- Major Upcoming Developments and Projects
Key Highlights of the Report:
- Nepal Physical Security Market Outlook
- Market Size of Nepal Physical Security Market, 2025
- Forecast of Nepal Physical Security Market, 2032
- Historical Data and Forecast of Nepal Physical Security Revenues & Volume for the Period 2022-2032F
- Nepal Physical Security Market Trend Evolution
- Nepal Physical Security Market Drivers and Challenges
- Nepal Physical Security Price Trends
- Nepal Physical Security Porter's Five Forces
- Nepal Physical Security Industry Life Cycle
- Historical Data and Forecast of Nepal Physical Security Market Revenues & Volume By Component for the Period 2022-2032F
- Historical Data and Forecast of Nepal Physical Security Market Revenues & Volume By Systems (PACS, PSIM, PIAM, Video Surveillance, Fire and Life Safety) for the Period 2022-2032F
- Historical Data and Forecast of Nepal Physical Security Market Revenues & Volume By Services for the Period 2022-2032F
- Historical Data and Forecast of Nepal Physical Security Market Revenues & Volume By Vertical for the Period 2022-2032F
- Historical Data and Forecast of Nepal Physical Security Market Revenues & Volume By BFSI for the Period 2022-2032F
- Historical Data and Forecast of Nepal Physical Security Market Revenues & Volume By Government for the Period 2022-2032F
- Historical Data and Forecast of Nepal Physical Security Market Revenues & Volume By Retail for the Period 2022-2032F
- Historical Data and Forecast of Nepal Physical Security Market Revenues & Volume By Transportation for the Period 2022-2032F
- Historical Data and Forecast of Nepal Physical Security Market Revenues & Volume By Residential for the Period 2022-2032F
- Historical Data and Forecast of Nepal Physical Security Market Revenues & Volume By Telecom and IT for the Period 2022-2032F
- Historical Data and Forecast of Nepal Physical Security Market Revenues & Volume By Other Verticals (Healthcare, Manufacturing, Energy and Utilities, and Education). for the Period 2022-2032F
- Historical Data and Forecast of Nepal Physical Security Market Revenues & Volume By Organization Size for the Period 2022-2032F
- Historical Data and Forecast of Nepal Physical Security Market Revenues & Volume By SMEs for the Period 2022-2032F
- Historical Data and Forecast of Nepal Physical Security Market Revenues & Volume By Large Enterprises for the Period 2022-2032F
- Nepal Physical Security Import Export Trade Statistics
- Market Opportunity Assessment By Component
- Market Opportunity Assessment By Vertical
- Market Opportunity Assessment By Organization Size
- Nepal Physical Security Top Companies Market Share
- Nepal Physical Security Competitive Benchmarking By Technical and Operational Parameters
- Nepal Physical Security Company Profiles
- Nepal Physical Security Key Strategic Recommendations






































