Nepal Smart TV Market (2020-2026) | Trends, Industry, Outlook, Growth, COVID-19 IMPACT, Companies, Share, Forecast, Revenue, Size, Analysis & Value
Market Forecast By Screen Type (28 to 40 inch, 41 to 59 inch, 60 inch & above), By Pannel Type (LED, OLED, QLED, Others), By Resolution Type (HD TV, Full HD TV, 4K UHD TV, 8K TV), By Distribution Channel (Direct, Indirect), By End Use (Commercial, Residential, Others) And Competitive Landscape
| Product Code: ETC012236 | Publication Date: Oct 2020 | Updated Date: Apr 2025 | Product Type: Report | |
| Publisher: 6Wresearch | Author: Ravi Bhandari | No. of Pages: 70 | No. of Figures: 35 | No. of Tables: 5 |
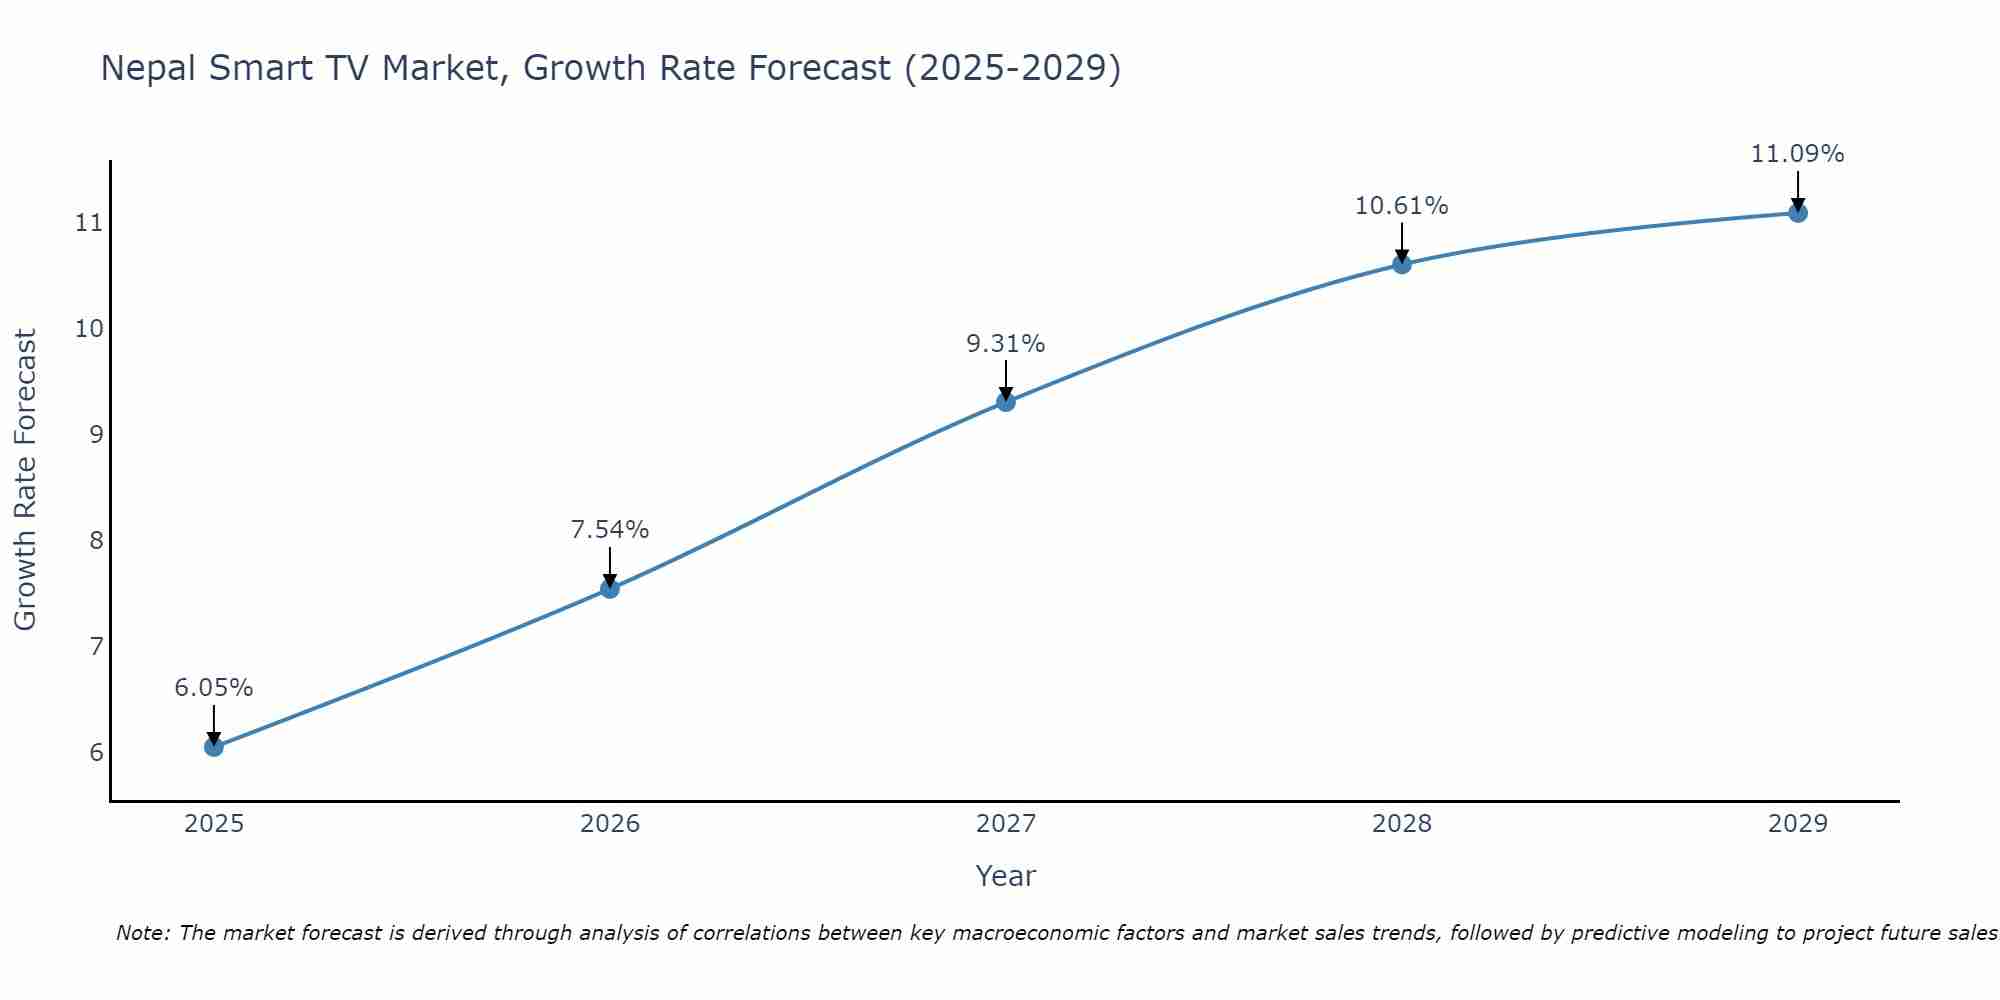
Nepal Smart TV Market Size Growth Rate
The Nepal Smart TV Market is likely to experience consistent growth rate gains over the period 2025 to 2029. The growth rate starts at 6.05% in 2025 and reaches 11.09% by 2029.
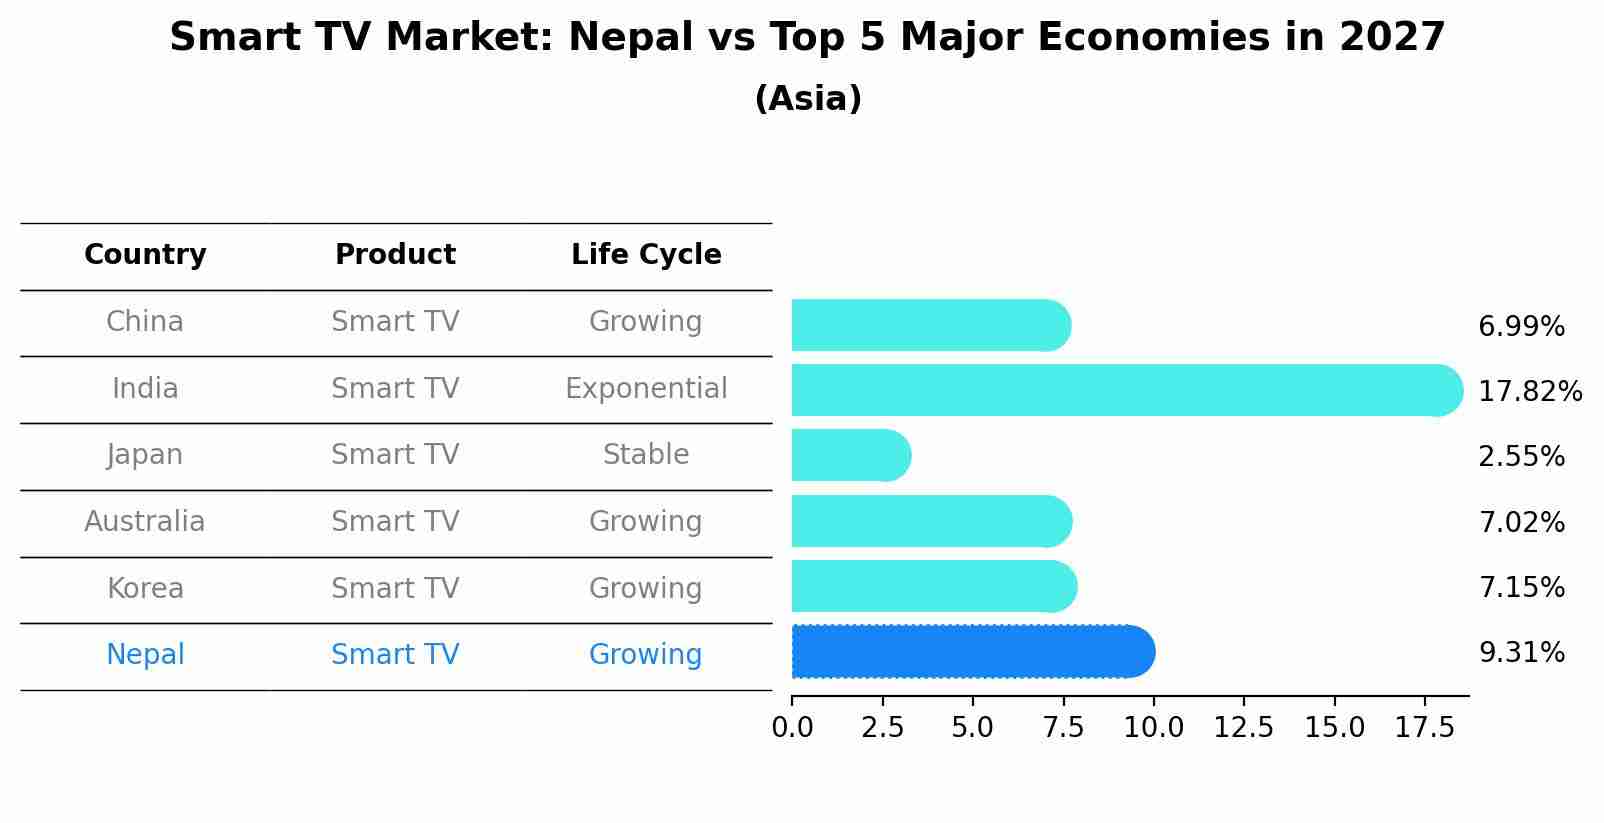
Smart TV Market: Nepal vs Top 5 Major Economies in 2027 (Asia)
In the Asia region, the Smart TV market in Nepal is projected to expand at a growing growth rate of 9.31% by 2027. The largest economy is China, followed by India, Japan, Australia and South Korea.
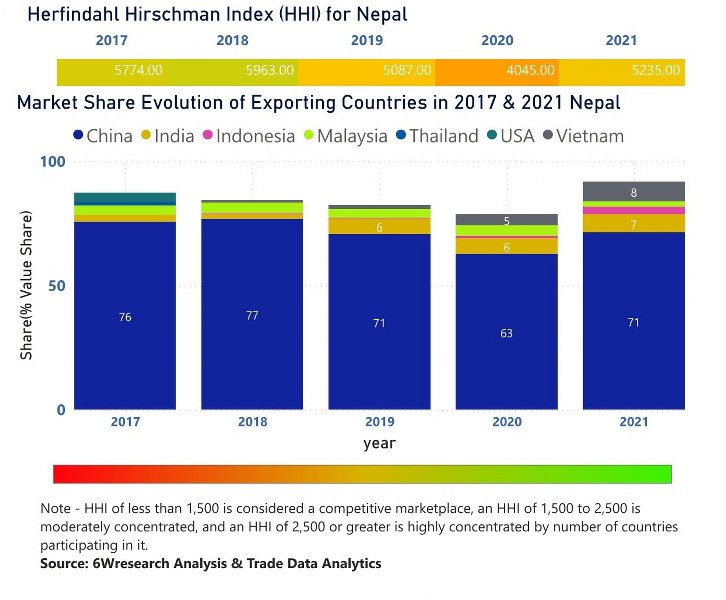
Nepal Smart TV Market | Country-Wise Share and Competition Analysis
In the year 2021, China was the largest exporter in terms of value, followed by Viet Nam. It has registered a growth of 104.21% over the previous year. While Viet Nam registered a growth of 207.02% as compare to the previous year. In the year 2017 China was the largest exporter followed by Malaysia. In term of Herfindahl Index, which measures the competitiveness of countries exporting, Nepal has the Herfindahl index of 5774 in 2017 which signifies high concentration also in 2021 it registered a Herfindahl index of 5235 which signifies high concentration in the market.
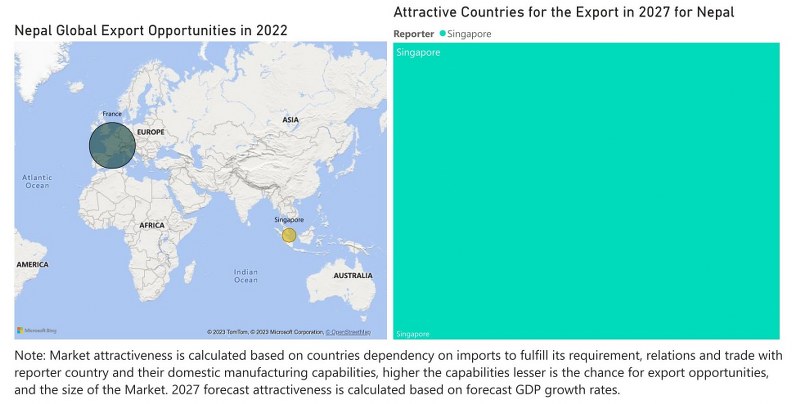
Nepal Smart TV Market - Export Market Opportunities
Key Highlights of the Report:
- Nepal Smart TV Market Outlook
- Market Size of Nepal Smart TV Market, 2019
- Forecast of Nepal Smart TV Market, 2026
- Historical Data and Forecast of Nepal Smart TV Revenues & Volume for the Period 2016 - 2026
- Nepal Smart TV Market Trend Evolution
- Nepal Smart TV Market Drivers and Challenges
- Nepal Smart TV Price Trends
- Nepal Smart TV Porter's Five Forces
- Nepal Smart TV Industry Life Cycle
- Historical Data and Forecast of Nepal Smart TV Market Revenues & Volume By Screen Type for the Period 2016 - 2026
- Historical Data and Forecast of Nepal Smart TV Market Revenues & Volume By 28 to 40 inch for the Period 2016 - 2026
- Historical Data and Forecast of Nepal Smart TV Market Revenues & Volume By 41 to 59 inch for the Period 2016 - 2026
- Historical Data and Forecast of Nepal Smart TV Market Revenues & Volume By 60 inch & above for the Period 2016 - 2026
- Historical Data and Forecast of Nepal Smart TV Market Revenues & Volume By Pannel Type for the Period 2016 - 2026
- Historical Data and Forecast of Nepal Smart TV Market Revenues & Volume By LED for the Period 2016 - 2026
- Historical Data and Forecast of Nepal Smart TV Market Revenues & Volume By OLED for the Period 2016 - 2026
- Historical Data and Forecast of Nepal Smart TV Market Revenues & Volume By QLED for the Period 2016 - 2026
- Historical Data and Forecast of Nepal Smart TV Market Revenues & Volume By Others for the Period 2016 - 2026
- Historical Data and Forecast of Nepal Smart TV Market Revenues & Volume By Resolution Type for the Period 2016 - 2026
- Historical Data and Forecast of Nepal Smart TV Market Revenues & Volume By HD TV for the Period 2016 - 2026
- Historical Data and Forecast of Nepal Smart TV Market Revenues & Volume By Full HD TV for the Period 2016 - 2026
- Historical Data and Forecast of Nepal Smart TV Market Revenues & Volume By 4K UHD TV for the Period 2016 - 2026
- Historical Data and Forecast of Nepal Smart TV Market Revenues & Volume By 8K TV for the Period 2016 - 2026
- Historical Data and Forecast of Nepal Smart TV Market Revenues & Volume By Distribution Channel for the Period 2016 - 2026
- Historical Data and Forecast of Nepal Smart TV Market Revenues & Volume By Direct for the Period 2016 - 2026
- Historical Data and Forecast of Nepal Smart TV Market Revenues & Volume By Indirect for the Period 2016 - 2026
- Historical Data and Forecast of Nepal Smart TV Market Revenues & Volume By End Use for the Period 2016 - 2026
- Historical Data and Forecast of Nepal Smart TV Market Revenues & Volume By Commercial for the Period 2016 - 2026
- Historical Data and Forecast of Nepal Smart TV Market Revenues & Volume By Residential for the Period 2016 - 2026
- Historical Data and Forecast of Nepal Smart TV Market Revenues & Volume By Others for the Period 2016 - 2026
- Nepal Smart TV Import Export Trade Statistics
- Market Opportunity Assessment By Screen Type
- Market Opportunity Assessment By Pannel Type
- Market Opportunity Assessment By Resolution Type
- Market Opportunity Assessment By Distribution Channel
- Market Opportunity Assessment By End Use
- Nepal Smart TV Top Companies Market Share
- Nepal Smart TV Competitive Benchmarking By Technical and Operational Parameters
- Nepal Smart TV Company Profiles
- Nepal Smart TV Key Strategic Recommendations
Frequently Asked Questions About the Market Study (FAQs):
6Wresearch actively monitors the Nepal Smart TV Market and publishes its comprehensive annual report, highlighting emerging trends, growth drivers, revenue analysis, and forecast outlook. Our insights help businesses to make data-backed strategic decisions with ongoing market dynamics. Our analysts track relevent industries related to the Nepal Smart TV Market, allowing our clients with actionable intelligence and reliable forecasts tailored to emerging regional needs.
Yes, we provide customisation as per your requirements. To learn more, feel free to contact us on sales@6wresearch.com
| 1 Executive Summary |
| 2 Introduction |
| 2.1 Key Highlights of the Report |
| 2.2 Report Description |
| 2.3 Market Scope & Segmentation |
| 2.4 Research Methodology |
| 2.5 Assumptions |
| 3 Nepal Smart TV Market Overview |
| 3.1 Nepal Country Macro Economic Indicators |
| 3.2 Nepal Smart TV Market Revenues & Volume, 2019 & 2026F |
| 3.3 Nepal Smart TV Market - Industry Life Cycle |
| 3.4 Nepal Smart TV Market - Porter's Five Forces |
| 3.5 Nepal Smart TV Market Revenues & Volume Share, By Screen Type, 2019 & 2026F |
| 3.6 Nepal Smart TV Market Revenues & Volume Share, By Pannel Type, 2019 & 2026F |
| 3.7 Nepal Smart TV Market Revenues & Volume Share, By Resolution Type, 2019 & 2026F |
| 3.8 Nepal Smart TV Market Revenues & Volume Share, By Distribution Channel, 2019 & 2026F |
| 3.9 Nepal Smart TV Market Revenues & Volume Share, By End Use, 2019 & 2026F |
| 4 Nepal Smart TV Market Dynamics |
| 4.1 Impact Analysis |
| 4.2 Market Drivers |
| 4.3 Market Restraints |
| 5 Nepal Smart TV Market Trends |
| 6 Nepal Smart TV Market, By Types |
| 6.1 Nepal Smart TV Market, By Screen Type |
| 6.1.1 Overview and Analysis |
| 6.1.2 Nepal Smart TV Market Revenues & Volume, By Screen Type, 2016 - 2026F |
| 6.1.3 Nepal Smart TV Market Revenues & Volume, By 28 to 40 inch, 2016 - 2026F |
| 6.1.4 Nepal Smart TV Market Revenues & Volume, By 41 to 59 inch, 2016 - 2026F |
| 6.1.5 Nepal Smart TV Market Revenues & Volume, By 60 inch & above, 2016 - 2026F |
| 6.2 Nepal Smart TV Market, By Pannel Type |
| 6.2.1 Overview and Analysis |
| 6.2.2 Nepal Smart TV Market Revenues & Volume, By LED, 2016 - 2026F |
| 6.2.3 Nepal Smart TV Market Revenues & Volume, By OLED, 2016 - 2026F |
| 6.2.4 Nepal Smart TV Market Revenues & Volume, By QLED, 2016 - 2026F |
| 6.2.5 Nepal Smart TV Market Revenues & Volume, By Others, 2016 - 2026F |
| 6.3 Nepal Smart TV Market, By Resolution Type |
| 6.3.1 Overview and Analysis |
| 6.3.2 Nepal Smart TV Market Revenues & Volume, By HD TV, 2016 - 2026F |
| 6.3.3 Nepal Smart TV Market Revenues & Volume, By Full HD TV, 2016 - 2026F |
| 6.3.4 Nepal Smart TV Market Revenues & Volume, By 4K UHD TV, 2016 - 2026F |
| 6.3.5 Nepal Smart TV Market Revenues & Volume, By 8K TV, 2016 - 2026F |
| 6.4 Nepal Smart TV Market, By Distribution Channel |
| 6.4.1 Overview and Analysis |
| 6.4.2 Nepal Smart TV Market Revenues & Volume, By Direct, 2016 - 2026F |
| 6.4.3 Nepal Smart TV Market Revenues & Volume, By Indirect, 2016 - 2026F |
| 6.5 Nepal Smart TV Market, By End Use |
| 6.5.1 Overview and Analysis |
| 6.5.2 Nepal Smart TV Market Revenues & Volume, By Commercial, 2016 - 2026F |
| 6.5.3 Nepal Smart TV Market Revenues & Volume, By Residential, 2016 - 2026F |
| 6.5.4 Nepal Smart TV Market Revenues & Volume, By Others, 2016 - 2026F |
| 7 Nepal Smart TV Market Import-Export Trade Statistics |
| 7.1 Nepal Smart TV Market Export to Major Countries |
| 7.2 Nepal Smart TV Market Imports from Major Countries |
| 8 Nepal Smart TV Market Key Performance Indicators |
| 9 Nepal Smart TV Market - Opportunity Assessment |
| 9.1 Nepal Smart TV Market Opportunity Assessment, By Screen Type, 2019 & 2026F |
| 9.2 Nepal Smart TV Market Opportunity Assessment, By Pannel Type, 2019 & 2026F |
| 9.3 Nepal Smart TV Market Opportunity Assessment, By Resolution Type, 2019 & 2026F |
| 9.4 Nepal Smart TV Market Opportunity Assessment, By Distribution Channel, 2019 & 2026F |
| 9.5 Nepal Smart TV Market Opportunity Assessment, By End Use, 2019 & 2026F |
| 10 Nepal Smart TV Market - Competitive Landscape |
| 10.1 Nepal Smart TV Market Revenue Share, By Companies, 2019 |
| 10.2 Nepal Smart TV Market Competitive Benchmarking, By Operating and Technical Parameters |
| 11 Company Profiles |
| 12 Recommendations |
| 13 Disclaimer |
Global Go To Market Strategy - 2030
Export potential enables firms to identify high-growth global markets with greater confidence by combining advanced trade intelligence with a structured quantitative methodology. The framework analyzes emerging demand trends and country-level import patterns while integrating macroeconomic and trade datasets such as GDP and population forecasts, bilateral import–export flows, tariff structures, elasticity differentials between developed and developing economies, geographic distance, and import demand projections. Using weighted trade values from 2020–2024 as the base period to project country-to-country export potential for 2030, these inputs are operationalized through calculated drivers such as gravity model parameters, tariff impact factors, and projected GDP per-capita growth. Through an analysis of hidden potentials, demand hotspots, and market conditions that are most favorable to success, this method enables firms to focus on target countries, maximize returns, and global expansion with data, backed by accuracy.
By factoring in the projected importer demand gap that is currently unmet and could be potential opportunity, it identifies the potential for the Exporter (Country) among 190 countries, against the general trade analysis, which identifies the biggest importer or exporter.
To discover high-growth global markets and optimize your business strategy:
Click Here
Pricing
- Single User License$ 1,995
- Department License$ 2,400
- Site License$ 3,120
- Global License$ 3,795

Leadership Perspectives from Industry Events
Search
Thought Leadership and Analyst Meet


Our Clients
6WResearch In News
- India Air Conditioner Market Set for Strong Rebound in 2026 After Weather-Led Correction and GST-Driven Recovery: 6Wresearch
- ADAS in India: How Automatic Emergency Braking, Blind Spot Detection & Driver Monitoring are Transforming Road Safety
- Doha a strategic location for EV manufacturing hub: IPA Qatar
- Demand for luxury TVs surging in the GCC, says Samsung
- Empowering Growth: The Thriving Journey of Bangladesh’s Cable Industry
- Demand for luxury TVs surging in the GCC, says Samsung
Latest Reports
- Poland Fire Protection Systems Market (2026-2032)
- Cape Verde Portable Hand-Thrown Extinguisher Market (2026-2032)
- Canada Portable Hand-Thrown Extinguisher Market (2026-2032)
- Cameroon Portable Hand-Thrown Extinguisher Market (2026-2032)
- Burundi Portable Hand-Thrown Extinguisher Market (2026-2032)
- Burkina Faso Portable Hand-Thrown Extinguisher Market (2026-2032)
- Bulgaria Portable Hand-Thrown Extinguisher Market (2026-2032)
- Brunei Portable Hand-Thrown Extinguisher Market (2026-2032)
- Botswana Portable Hand-Thrown Extinguisher Market (2026-2032)
- Bosnia and Herzegovina Portable Hand-Thrown Extinguisher Market (2026-2032)
Industry Events and Analyst Meet

HIMTEX 2026

India Refining Summit 2026

India EV Show 2026

EV tech India Expo 2026

Auto Tech Asia 2026
Whitepaper
- Middle East & Africa Commercial Security Market Click here to view more.
- Middle East & Africa Fire Safety Systems & Equipment Market Click here to view more.
- GCC Drone Market Click here to view more.
- Middle East Lighting Fixture Market Click here to view more.
- GCC Physical & Perimeter Security Market Click here to view more.