Netherlands Activated Bleaching Earth Market (2026-2032) | Share, Forecast, Size & Revenue, Companies, Industry, Growth, Segmentation, Trends, Value, Outlook, Competitive Landscape, Analysis
Market Forecast By Application (Edible Oil & Fats, Mineral Oil & Lubricants) And Competitive Landscape
| Product Code: ETC8530934 | Publication Date: Sep 2024 | Updated Date: Apr 2026 | Product Type: Market Research Report | |
| Publisher: 6Wresearch | Author: Sumit Sagar | No. of Pages: 75 | No. of Figures: 35 | No. of Tables: 20 |
Netherlands Activated Bleaching Earth Market Size (2020-2030)
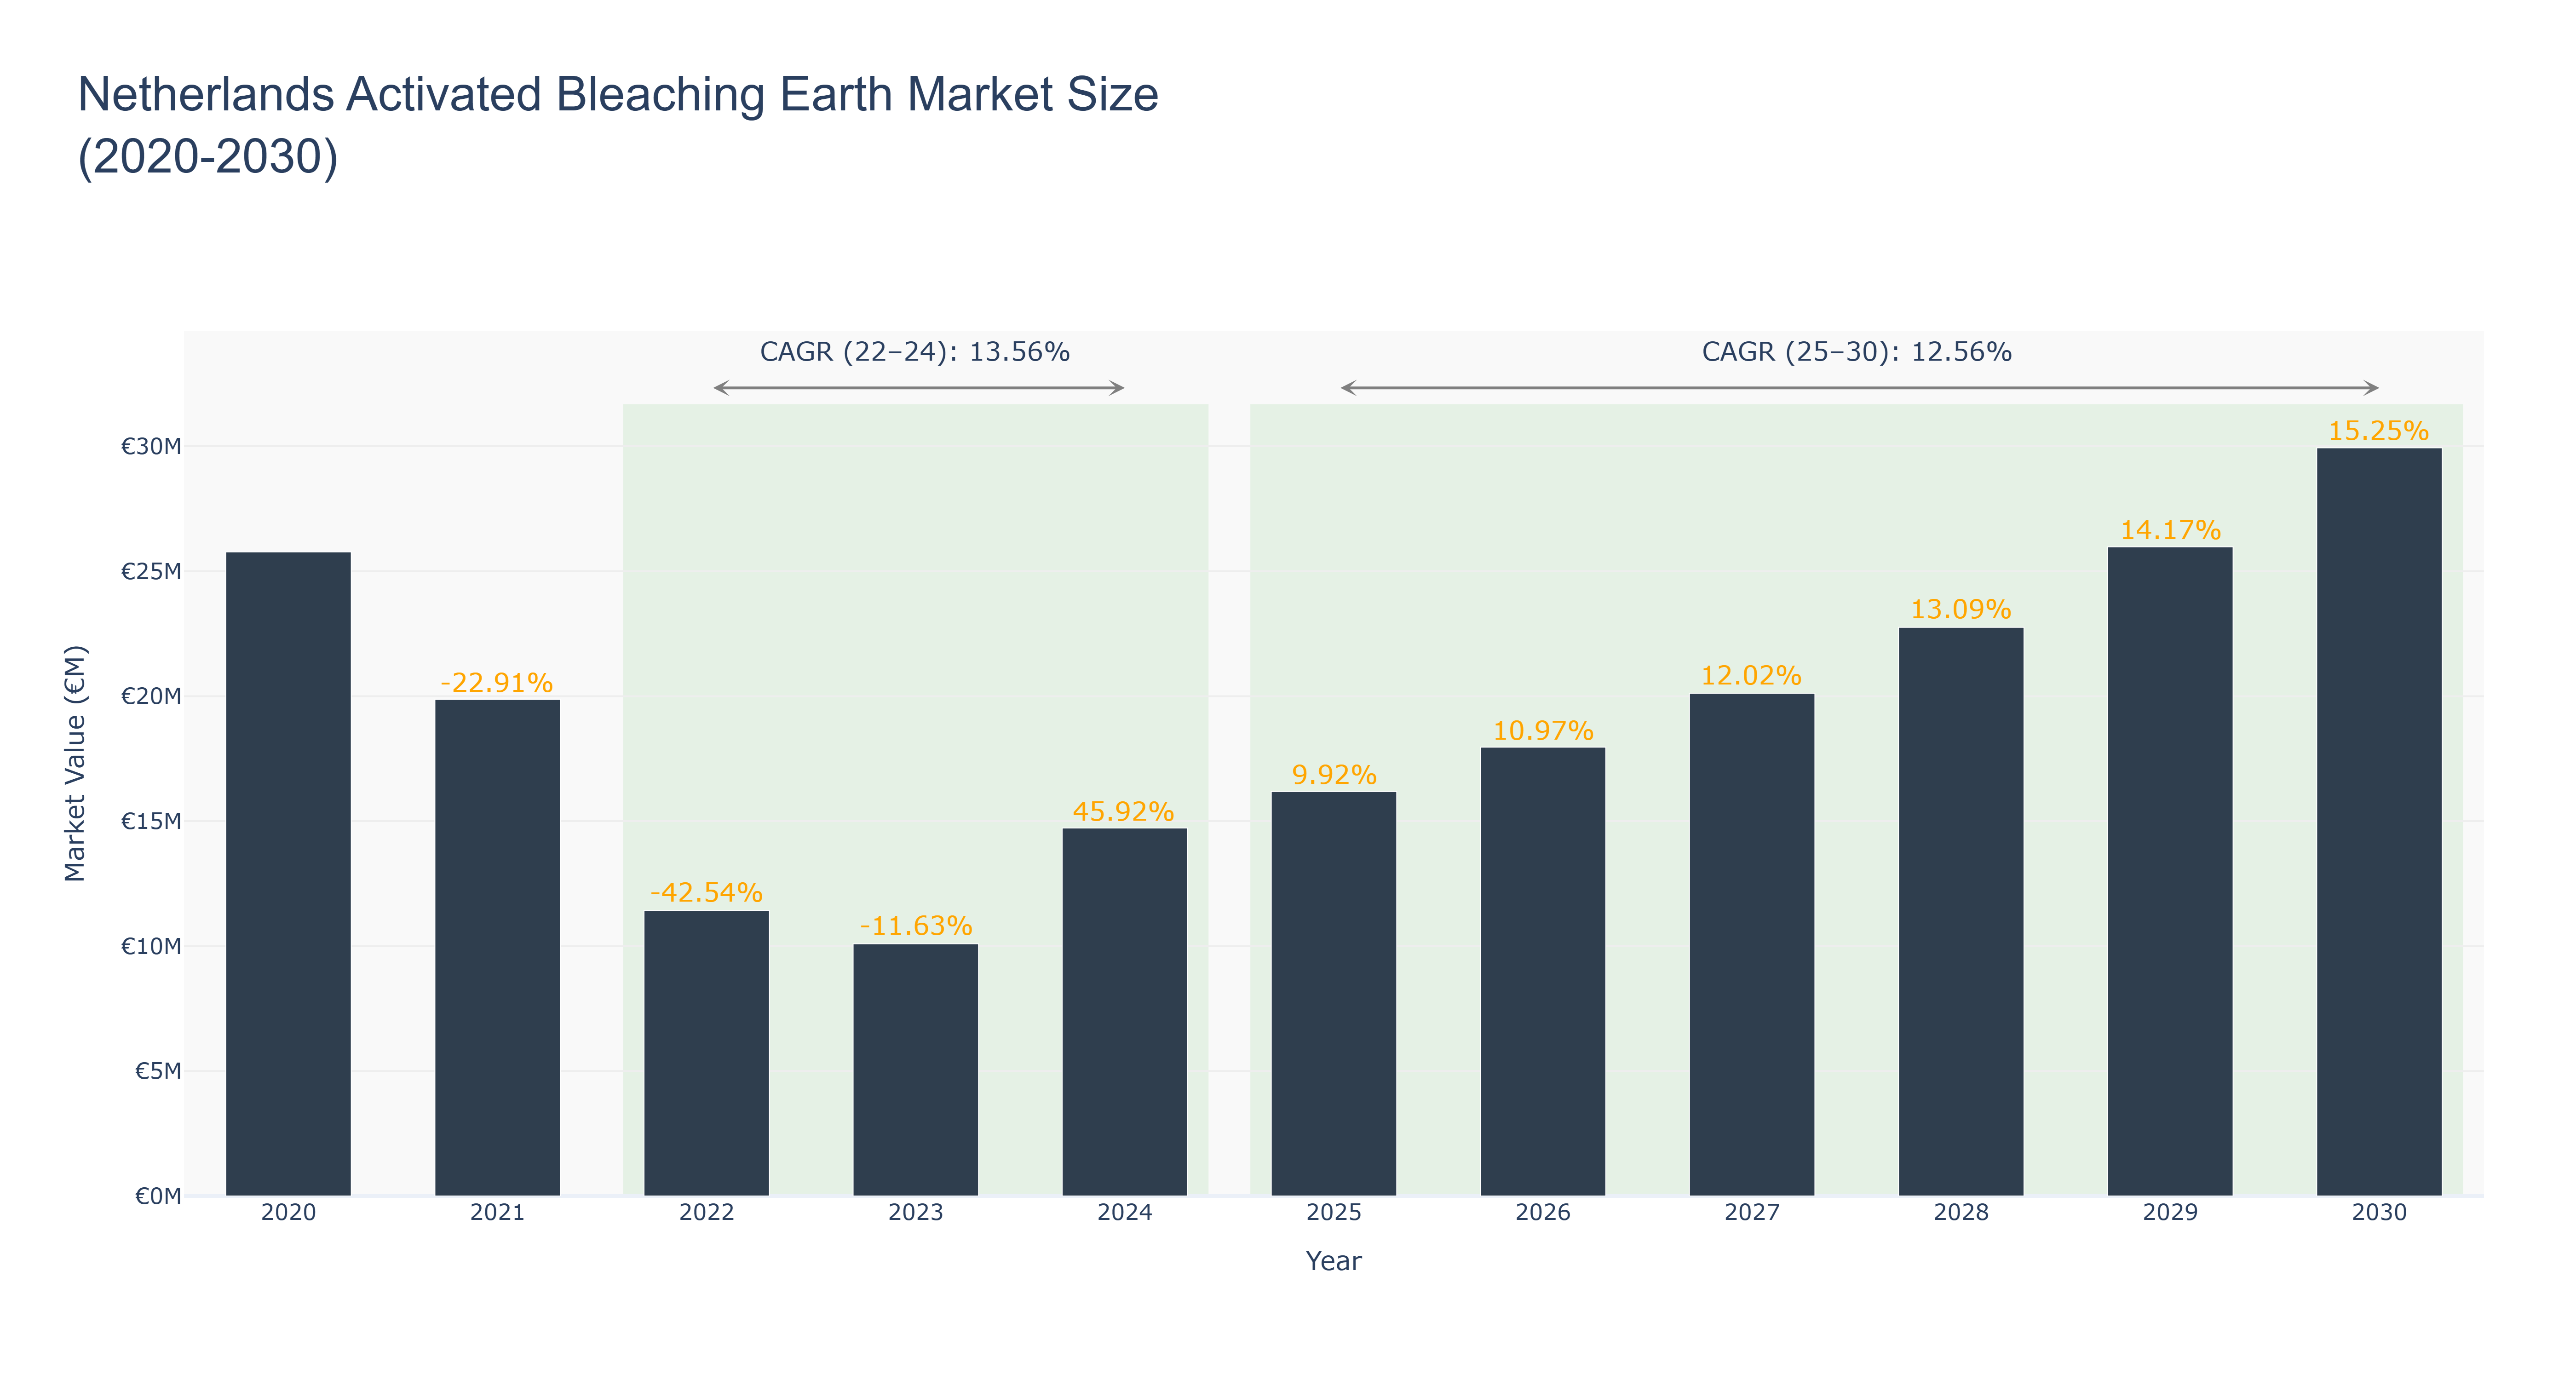
Netherlands Activated Bleaching Earth Market has experienced a fluctuating trend in recent years. The peak market size of €29.94 million is projected for 2030, showcasing a steady growth trajectory. Notably, the market size declined from €25.77 million in 2020 to €10.09 million in 2023, attributed to a significant decrease in demand. However, a remarkable recovery was observed from 2024 onwards, with a notable 45.92% growth that year. The consistent positive growth rates from 2025 to 2030, with a CAGR of 12.56%, indicate a promising outlook for the market. Industry drivers such as increasing industrial applications and technological advancements are fueling this growth. Looking ahead, upcoming projects in sustainable production processes and expanding product portfolios are set to drive further market expansion in the Netherlands.
Netherlands Activated Bleaching Earth Market: Production & Trade Performance (2019-2025)
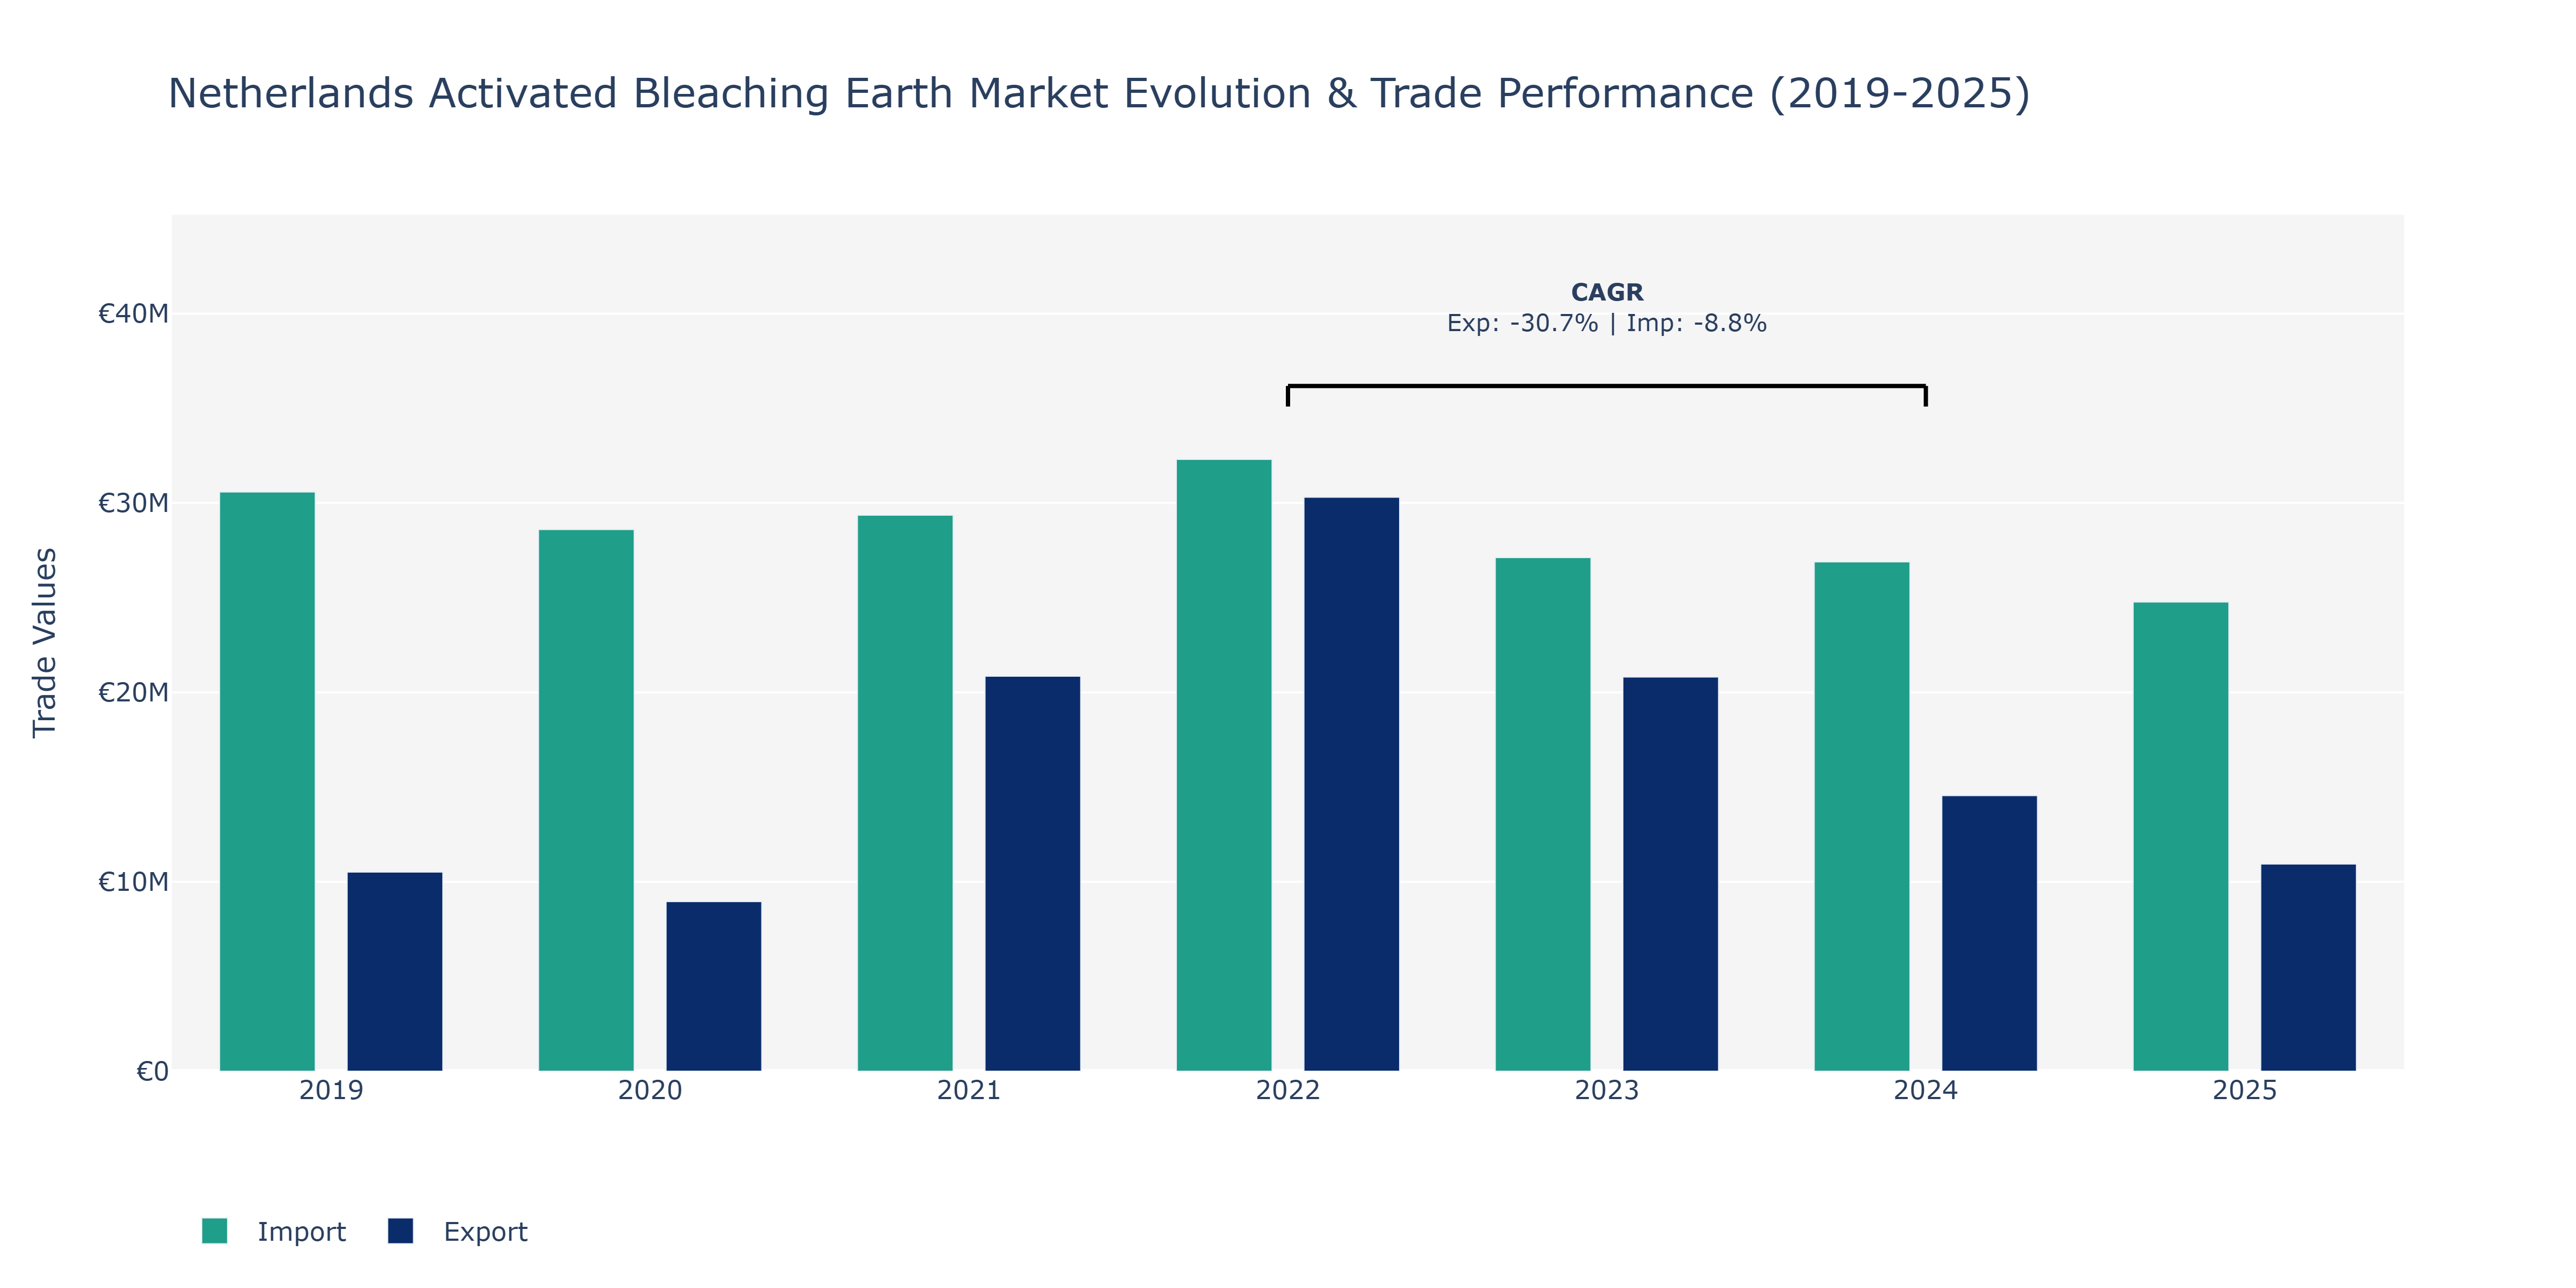
The Netherlands Activated Bleaching Earth Market exhibited fluctuating trends in both Exports and Imports during the analyzed period. In 2019, Imports surpassed Exports significantly, with Imports standing at €30.58 million and Exports at €10.51 million. However, by 2020, both Exports and Imports experienced a decline, with Exports decreasing to €8.96 million and Imports to €28.6 million. The year 2021 saw a notable increase in Exports to €20.85 million, while Imports remained relatively stable at €29.36 million, indicating a potential shift in market demand or supply chain dynamics. In 2022, Exports surged to €30.31 million, surpassing the 2019 levels, while Imports also increased to €32.3 million, possibly driven by evolving global trade patterns or product innovation. Subsequently, both Exports and Imports experienced a decline in 2023 and 2024, potentially influenced by macroeconomic factors or shifts in consumer preferences. The year 2025 witnessed a further decrease in both Exports and Imports, reflecting ongoing market adjustments or regulatory changes impacting trade flows in the activated bleaching earth sector. These fluctuations underscore the market's sensitivity to external factors, such as raw material prices, environmental regulations, and international trade dynamics, shaping the Netherlands' position in the global activated bleaching earth market.
Key Highlights of the Report:
- Netherlands Activated Bleaching Earth Market Outlook
- Market Size of Netherlands Activated Bleaching Earth Market, 2025
- Forecast of Netherlands Activated Bleaching Earth Market, 2032
- Historical Data and Forecast of Netherlands Activated Bleaching Earth Revenues & Volume for the Period 2022 - 2032
- Netherlands Activated Bleaching Earth Market Trend Evolution
- Netherlands Activated Bleaching Earth Market Drivers and Challenges
- Netherlands Activated Bleaching Earth Price Trends
- Netherlands Activated Bleaching Earth Porter's Five Forces
- Netherlands Activated Bleaching Earth Industry Life Cycle
- Historical Data and Forecast of Netherlands Activated Bleaching Earth Market Revenues & Volume By Application for the Period 2022 - 2032
- Historical Data and Forecast of Netherlands Activated Bleaching Earth Market Revenues & Volume By Edible Oil & Fats for the Period 2022 - 2032
- Historical Data and Forecast of Netherlands Activated Bleaching Earth Market Revenues & Volume By Mineral Oil & Lubricants for the Period 2022 - 2032
- Netherlands Activated Bleaching Earth Import Export Trade Statistics
- Market Opportunity Assessment By Application
- Netherlands Activated Bleaching Earth Top Companies Market Share
- Netherlands Activated Bleaching Earth Competitive Benchmarking By Technical and Operational Parameters
- Netherlands Activated Bleaching Earth Company Profiles
- Netherlands Activated Bleaching Earth Key Strategic Recommendations
Frequently Asked Questions About the Market Study (FAQs):
6Wresearch actively monitors the Netherlands Activated Bleaching Earth Market and publishes its comprehensive annual report, highlighting emerging trends, growth drivers, revenue analysis, and forecast outlook. Our insights help businesses to make data-backed strategic decisions with ongoing market dynamics. Our analysts track relevent industries related to the Netherlands Activated Bleaching Earth Market, allowing our clients with actionable intelligence and reliable forecasts tailored to emerging regional needs.
Yes, we provide customisation as per your requirements. To learn more, feel free to contact us on sales@6wresearch.com
1 Executive Summary |
2 Introduction |
2.1 Key Highlights of the Report |
2.2 Report Description |
2.3 Market Scope & Segmentation |
2.4 Research Methodology |
2.5 Assumptions |
3 Netherlands Activated Bleaching Earth Market Overview |
3.1 Netherlands Country Macro Economic Indicators |
3.2 Netherlands Activated Bleaching Earth Market Revenues & Volume, 2022 & 2032F |
3.3 Netherlands Activated Bleaching Earth Market - Industry Life Cycle |
3.4 Netherlands Activated Bleaching Earth Market - Porter's Five Forces |
3.5 Netherlands Activated Bleaching Earth Market Revenues & Volume Share, By Application, 2022 & 2032F |
4 Netherlands Activated Bleaching Earth Market Dynamics |
4.1 Impact Analysis |
4.2 Market Drivers |
4.2.1 Growing demand for activated bleaching earth in the Netherlands due to its use in various industries such as edible oil processing, cosmetics, and pharmaceuticals. |
4.2.2 Increasing focus on sustainable and eco-friendly products, leading to the adoption of activated bleaching earth as a natural bleaching agent. |
4.2.3 Technological advancements in the production process of activated bleaching earth, resulting in improved quality and efficiency. |
4.3 Market Restraints |
4.3.1 Fluctuating prices of raw materials used in the production of activated bleaching earth, impacting the overall cost and profitability. |
4.3.2 Stringent regulations and environmental concerns regarding the disposal of spent bleaching earth, leading to additional compliance costs and challenges in waste management. |
5 Netherlands Activated Bleaching Earth Market Trends |
6 Netherlands Activated Bleaching Earth Market, By Types |
6.1 Netherlands Activated Bleaching Earth Market, By Application |
6.1.1 Overview and Analysis |
6.1.2 Netherlands Activated Bleaching Earth Market Revenues & Volume, By Application, 2022 - 2032F |
6.1.3 Netherlands Activated Bleaching Earth Market Revenues & Volume, By Edible Oil & Fats, 2022 - 2032F |
6.1.4 Netherlands Activated Bleaching Earth Market Revenues & Volume, By Mineral Oil & Lubricants, 2022 - 2032F |
7 Netherlands Activated Bleaching Earth Market Import-Export Trade Statistics |
7.1 Netherlands Activated Bleaching Earth Market Export to Major Countries |
7.2 Netherlands Activated Bleaching Earth Market Imports from Major Countries |
8 Netherlands Activated Bleaching Earth Market Key Performance Indicators |
8.1 Energy efficiency of the manufacturing process, indicating the sustainability and cost-effectiveness of production. |
8.2 Quality control measures implemented during the production of activated bleaching earth, ensuring consistency and effectiveness of the product. |
8.3 Market penetration rate of activated bleaching earth in key industries, reflecting the acceptance and demand for the product. |
8.4 Innovation rate in product development and application of activated bleaching earth, showcasing the market's evolution and potential for growth. |
9 Netherlands Activated Bleaching Earth Market - Opportunity Assessment |
9.1 Netherlands Activated Bleaching Earth Market Opportunity Assessment, By Application, 2022 & 2032F |
10 Netherlands Activated Bleaching Earth Market - Competitive Landscape |
10.1 Netherlands Activated Bleaching Earth Market Revenue Share, By Companies, 2025 |
10.2 Netherlands Activated Bleaching Earth Market Competitive Benchmarking, By Operating and Technical Parameters |
11 Company Profiles |
12 Recommendations |
13 Disclaimer |
Global Go To Market Strategy - 2030
Export potential enables firms to identify high-growth global markets with greater confidence by combining advanced trade intelligence with a structured quantitative methodology. The framework analyzes emerging demand trends and country-level import patterns while integrating macroeconomic and trade datasets such as GDP and population forecasts, bilateral import–export flows, tariff structures, elasticity differentials between developed and developing economies, geographic distance, and import demand projections. Using weighted trade values from 2020–2024 as the base period to project country-to-country export potential for 2030, these inputs are operationalized through calculated drivers such as gravity model parameters, tariff impact factors, and projected GDP per-capita growth. Through an analysis of hidden potentials, demand hotspots, and market conditions that are most favorable to success, this method enables firms to focus on target countries, maximize returns, and global expansion with data, backed by accuracy.
By factoring in the projected importer demand gap that is currently unmet and could be potential opportunity, it identifies the potential for the Exporter (Country) among 190 countries, against the general trade analysis, which identifies the biggest importer or exporter.
To discover high-growth global markets and optimize your business strategy:
Click Here
Pricing
- Single User License$ 1,995
- Department License$ 2,400
- Site License$ 3,120
- Global License$ 3,795

Leadership Perspectives from Industry Events
Search
Thought Leadership and Analyst Meet


Our Clients
6WResearch In News
- Doha a strategic location for EV manufacturing hub: IPA Qatar
- Demand for luxury TVs surging in the GCC, says Samsung
- Empowering Growth: The Thriving Journey of Bangladesh’s Cable Industry
- Demand for luxury TVs surging in the GCC, says Samsung
- Video call with a traditional healer? Once unthinkable, it’s now common in South Africa
- Intelligent Buildings To Smooth GCC’s Path To Net Zero
Latest Reports
- Taiwan Airport Wireless Infrastructure Market (2026-2032)
- Vietnam Airport Wireless Infrastructure Market (2026-2032)
- Thailand Airport Wireless Infrastructure Market (2026-2032)
- South Korea Airport Wireless Infrastructure Market (2026-2032)
- Romania Airport Wireless Infrastructure Market (2026-2032)
- Qatar Airport Wireless Infrastructure Market (2026-2032)
- Philippines Airport Wireless Infrastructure Market (2026-2032)
- Japan Airport Wireless Infrastructure Market (2026-2032)
- Taiwan Airport Winter Services Market (2026-2032)
- Vietnam Airport Winter Services Market (2026-2032)
Industry Events and Analyst Meet

HIMTEX 2026

India Refining Summit 2026

India EV Show 2026

EV tech India Expo 2026

Auto Tech Asia 2026
Whitepaper
- Middle East & Africa Commercial Security Market Click here to view more.
- Middle East & Africa Fire Safety Systems & Equipment Market Click here to view more.
- GCC Drone Market Click here to view more.
- Middle East Lighting Fixture Market Click here to view more.
- GCC Physical & Perimeter Security Market Click here to view more.