Netherlands Automotive Nameplates Market (2026-2032) | Forecast, Revenue, Value, Trends, Industry, Segmentation, Outlook, Analysis, Growth, Size, Companies & Share
Market Forecast By Product Type (ABS Automotive Nameplates, Carbon Fiber Automotive Nameplates, Chrome Automotive Nameplates, Other), By Application (Passenger Car, Commercial Vehicle) And Competitive Landscape
| Product Code: ETC4660264 | Publication Date: Nov 2023 | Updated Date: Apr 2026 | Product Type: Market Research Report | |
| Publisher: 6Wresearch | Author: Shubham Padhi | No. of Pages: 60 | No. of Figures: 30 | No. of Tables: 5 |
Netherlands Automotive Nameplates Market Size (2020-2030)
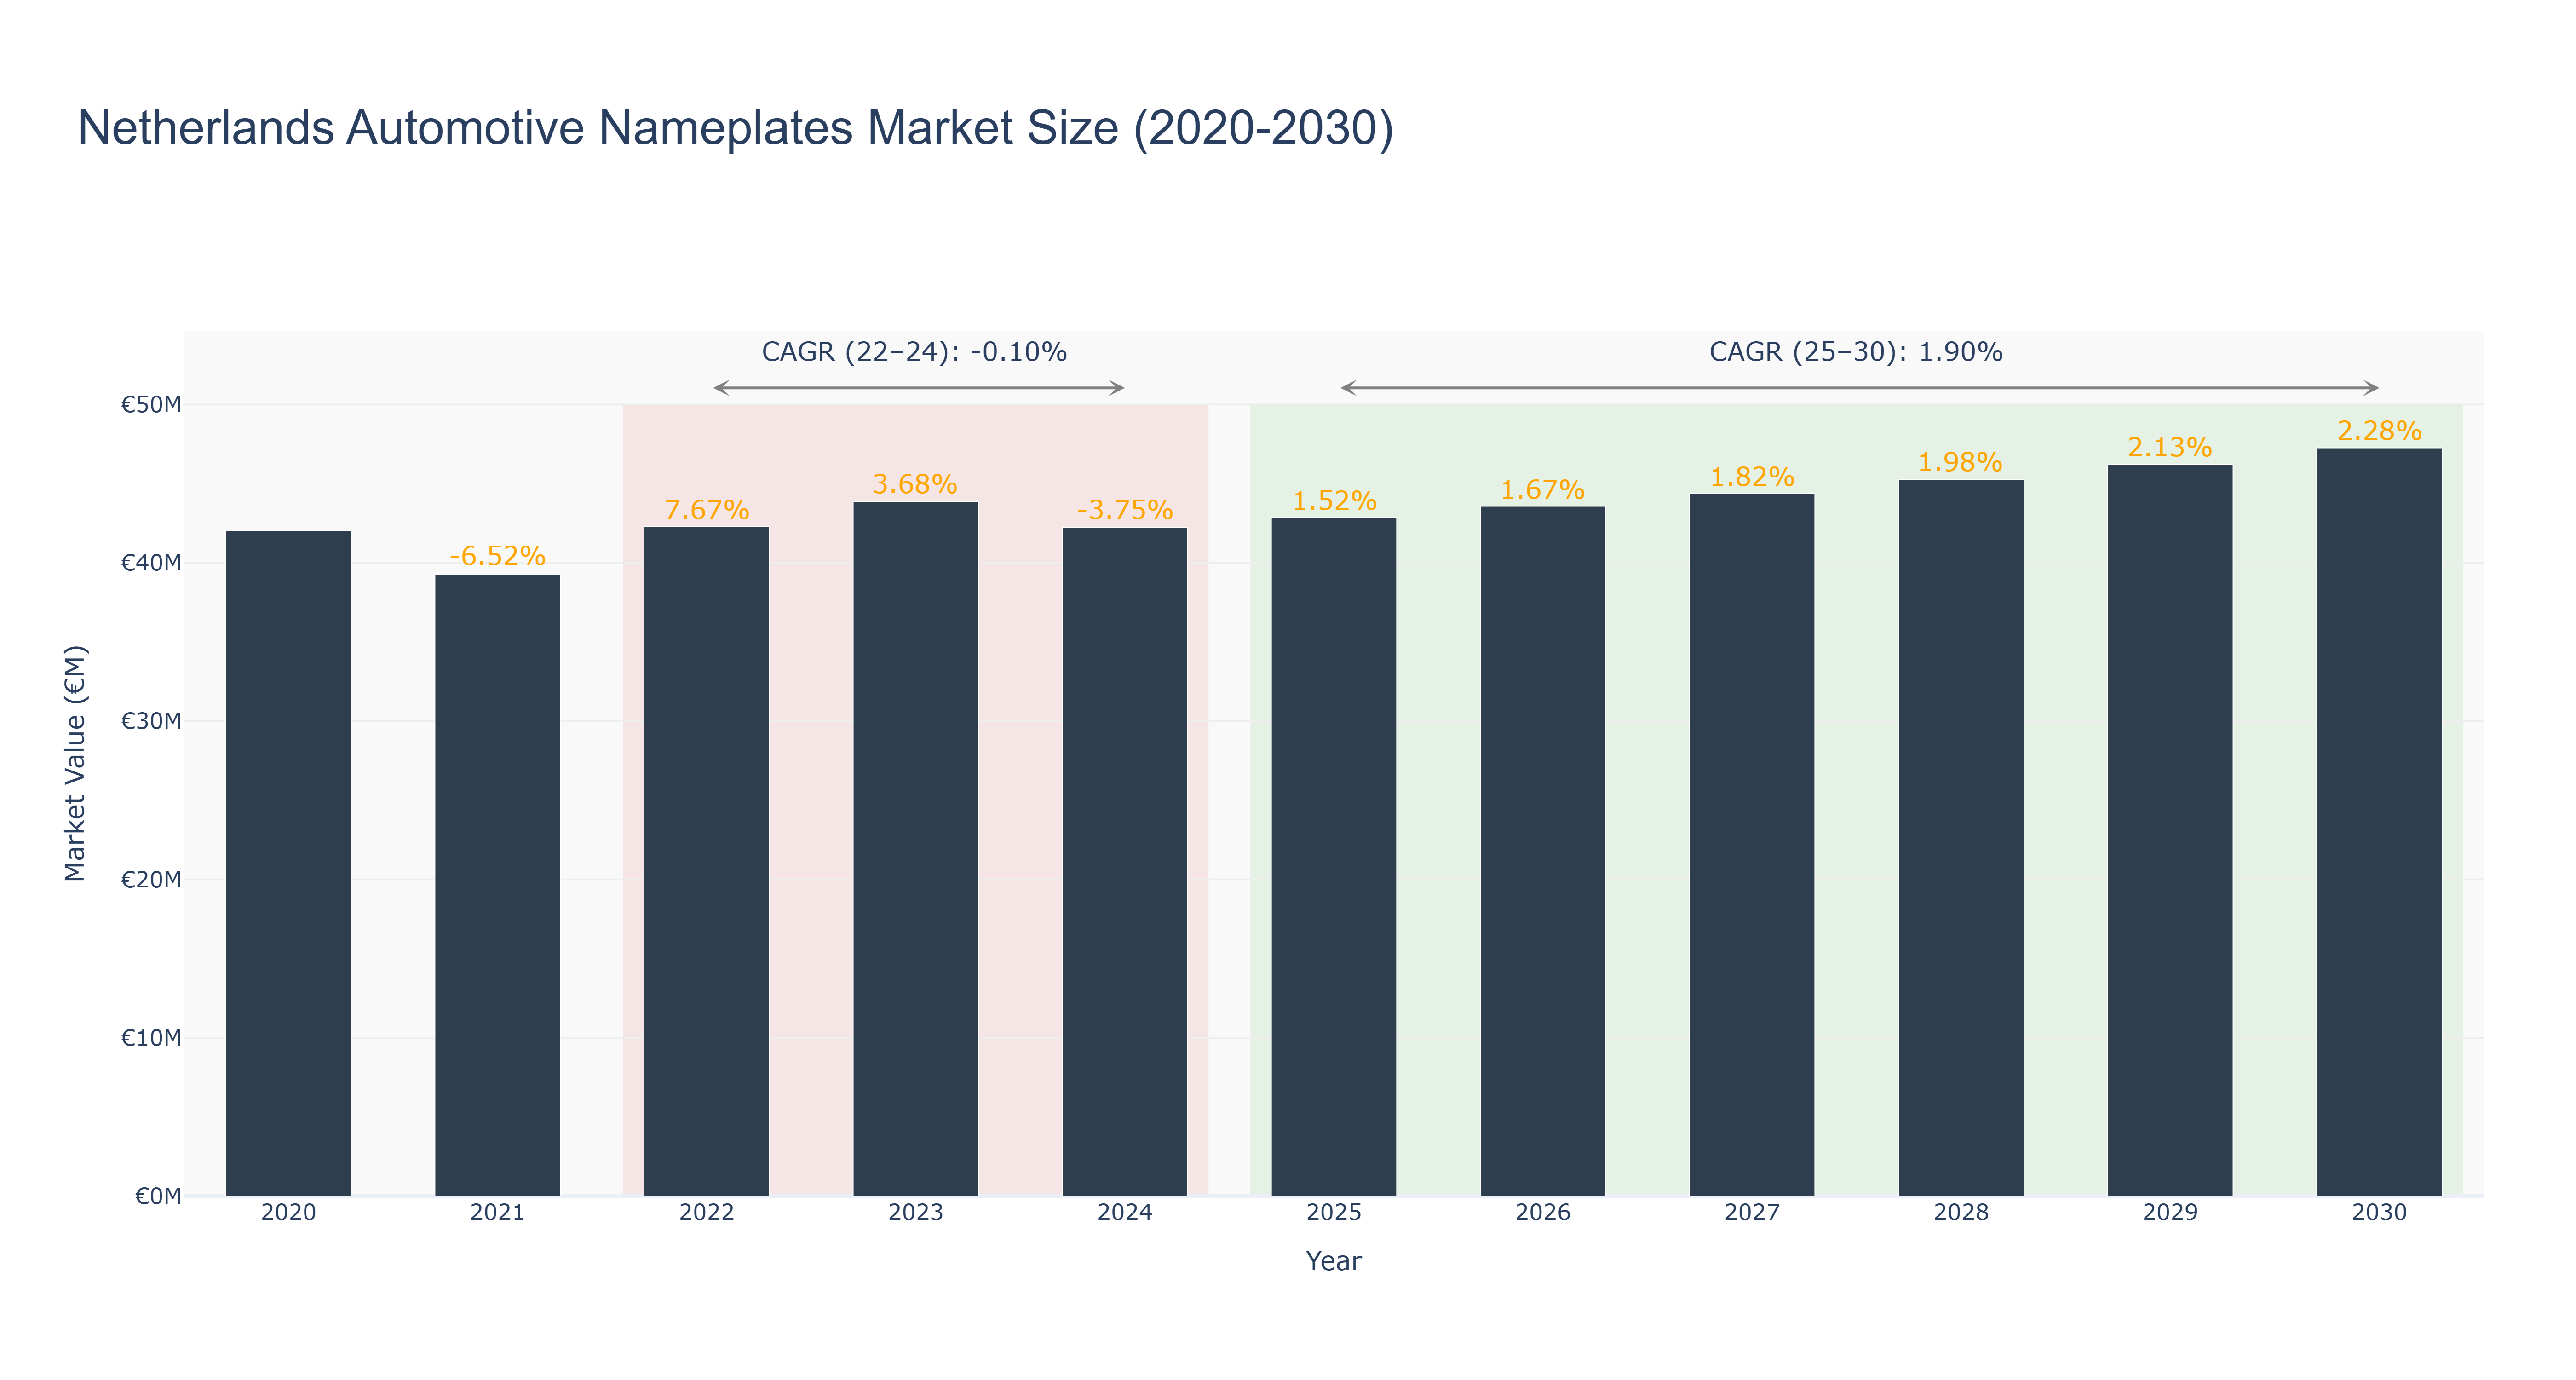
Netherlands Automotive Nameplates Market witnessed a peak market size of €47.27 million in 2030, showing consistent growth over the years. The actual market size decreased from €42.03 million in 2020 to €42.22 million in 2024, experiencing a slight dip. However, the market rebounded with a forecasted size of €47.27 million in 2030, showcasing a promising CAGR of 1.89875372% from 2025 to 2030. The CAGR from 2022 to 2024 was -0.10124628%, reflecting a temporary decline. Industry drivers such as technological advancements in automotive manufacturing and increasing demand for customized nameplates have contributed to this market's growth. Looking ahead, upcoming collaborations between Dutch automotive companies and sustainable energy providers are set to drive further expansion in the Netherlands Automotive Nameplates Market.
Netherlands Automotive Nameplates Market: Production & Trade Performance (2019-2025)
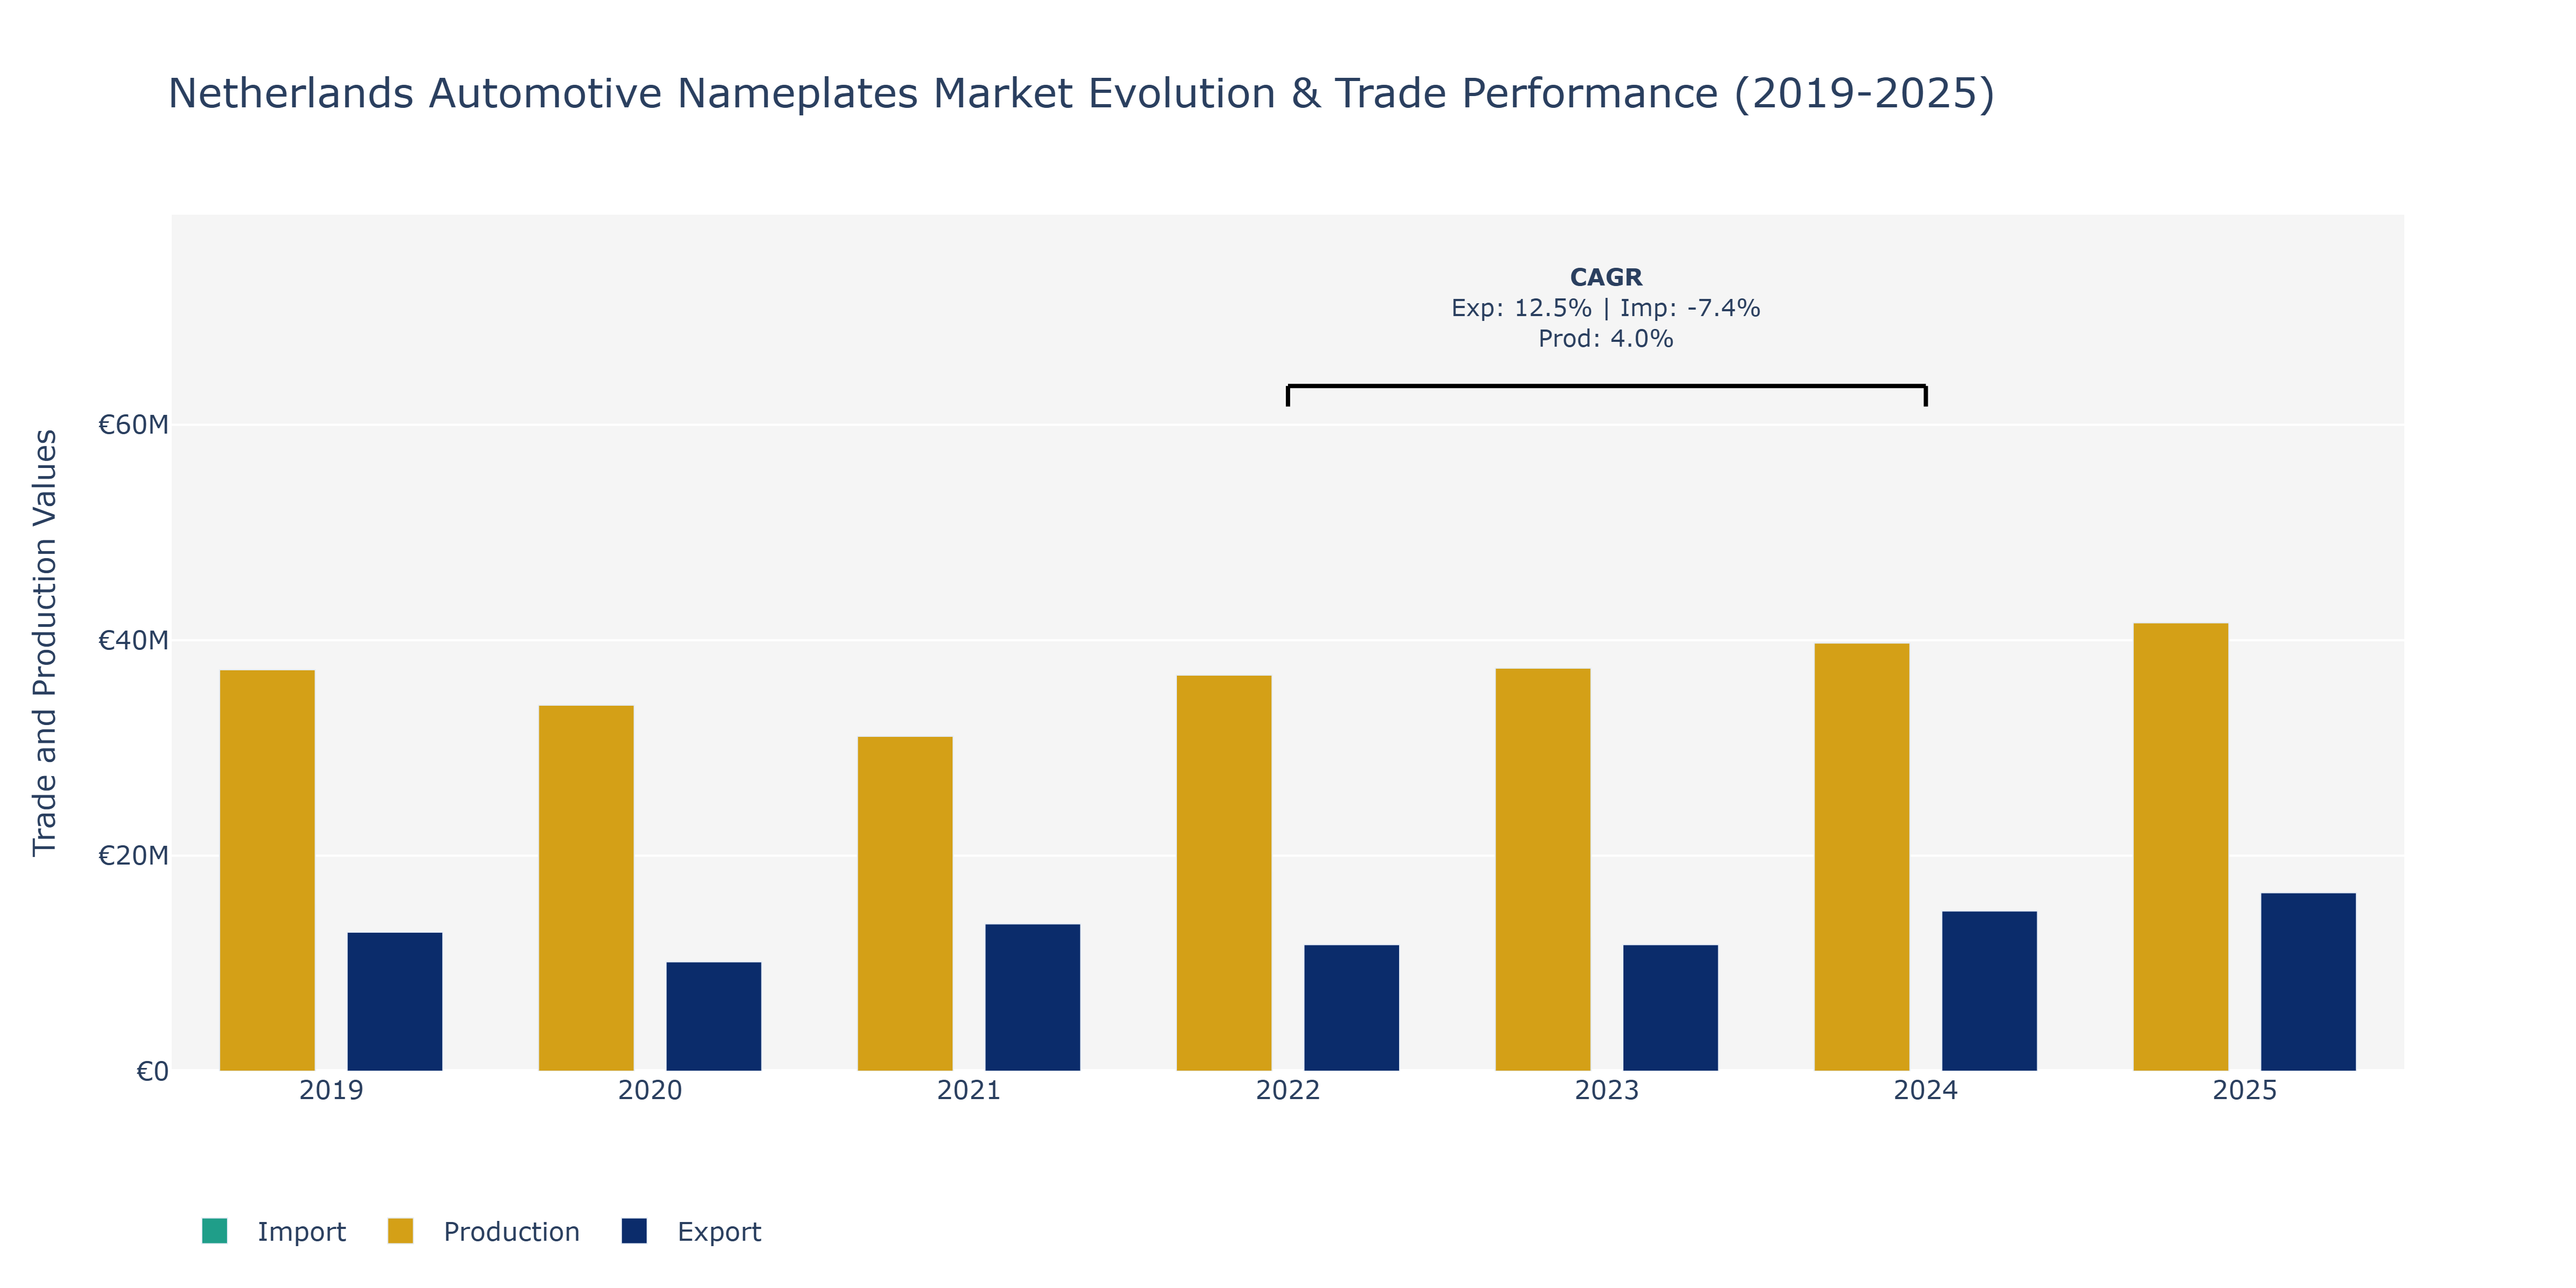
In the Netherlands Automotive Nameplates Market, exports experienced fluctuations over the years, with a peak in 2025 reaching approximately €16.56 million. This growth can be attributed to the increasing demand for Dutch automotive products in international markets, possibly due to the country's reputation for high-quality manufacturing. Imports, on the other hand, showed a decline from 2019 to 2023 before a slight recovery in 2024, possibly indicating shifts in global trade dynamics or changes in domestic consumption patterns. Production levels remained relatively stable, with a minor increase from 2019 to 2025, suggesting consistent manufacturing output in the automotive nameplates sector. The industry's ability to maintain production levels amidst varying export and import trends could be linked to strategic investments in technology and processes to enhance efficiency and quality, as indicated by the positive production CAGR from 2022 to 2024.
Key Highlights of the Report:
- Netherlands Automotive Nameplates Market Outlook
- Market Size of Netherlands Automotive Nameplates Market, 2025
- Forecast of Netherlands Automotive Nameplates Market, 2032
- Historical Data and Forecast of Netherlands Automotive Nameplates Revenues & Volume for the Period 2022 - 2032F
- Netherlands Automotive Nameplates Market Trend Evolution
- Netherlands Automotive Nameplates Market Drivers and Challenges
- Netherlands Automotive Nameplates Price Trends
- Netherlands Automotive Nameplates Porter`s Five Forces
- Netherlands Automotive Nameplates Industry Life Cycle
- Historical Data and Forecast of Netherlands Automotive Nameplates Market Revenues & Volume By Product Type for the Period 2022 - 2032F
- Historical Data and Forecast of Netherlands Automotive Nameplates Market Revenues & Volume By ABS Automotive Nameplates for the Period 2022 - 2032F
- Historical Data and Forecast of Netherlands Automotive Nameplates Market Revenues & Volume By Carbon Fiber Automotive Nameplates for the Period 2022 - 2032F
- Historical Data and Forecast of Netherlands Automotive Nameplates Market Revenues & Volume By Chrome Automotive Nameplates for the Period 2022 - 2032F
- Historical Data and Forecast of Netherlands Automotive Nameplates Market Revenues & Volume By Other for the Period 2022 - 2032F
- Historical Data and Forecast of Netherlands Automotive Nameplates Market Revenues & Volume By Application for the Period 2022 - 2032F
- Historical Data and Forecast of Netherlands Automotive Nameplates Market Revenues & Volume By Passenger Car for the Period 2022 - 2032F
- Historical Data and Forecast of Netherlands Automotive Nameplates Market Revenues & Volume By Commercial Vehicle for the Period 2022 - 2032F
- Netherlands Automotive Nameplates Import Export Trade Statistics
- Market Opportunity Assessment By Product Type
- Market Opportunity Assessment By Application
- Netherlands Automotive Nameplates Top Companies Market Share
- Netherlands Automotive Nameplates Competitive Benchmarking By Technical and Operational Parameters
- Netherlands Automotive Nameplates Company Profiles
- Netherlands Automotive Nameplates Key Strategic Recommendations
Frequently Asked Questions About the Market Study (FAQs):
6Wresearch actively monitors the Netherlands Automotive Nameplates Market and publishes its comprehensive annual report, highlighting emerging trends, growth drivers, revenue analysis, and forecast outlook. Our insights help businesses to make data-backed strategic decisions with ongoing market dynamics. Our analysts track relevent industries related to the Netherlands Automotive Nameplates Market, allowing our clients with actionable intelligence and reliable forecasts tailored to emerging regional needs.
Yes, we provide customisation as per your requirements. To learn more, feel free to contact us on sales@6wresearch.com
1 Executive Summary |
2 Introduction |
2.1 Key Highlights of the Report |
2.2 Report Description |
2.3 Market Scope & Segmentation |
2.4 Research Methodology |
2.5 Assumptions |
3 Netherlands Automotive Nameplates Market Overview |
3.1 Netherlands Country Macro Economic Indicators |
3.2 Netherlands Automotive Nameplates Market Revenues & Volume, 2022 & 2032F |
3.3 Netherlands Automotive Nameplates Market - Industry Life Cycle |
3.4 Netherlands Automotive Nameplates Market - Porter's Five Forces |
3.5 Netherlands Automotive Nameplates Market Revenues & Volume Share, By Product Type, 2022 & 2032F |
3.6 Netherlands Automotive Nameplates Market Revenues & Volume Share, By Application, 2022 & 2032F |
4 Netherlands Automotive Nameplates Market Dynamics |
4.1 Impact Analysis |
4.2 Market Drivers |
4.2.1 Technological advancements in automotive manufacturing processes |
4.2.2 Increasing demand for lightweight and fuel-efficient vehicles |
4.2.3 Growing focus on electric and hybrid vehicles in the Netherlands |
4.3 Market Restraints |
4.3.1 High initial investment costs for setting up manufacturing facilities |
4.3.2 Stringent government regulations regarding emissions and safety standards in the automotive industry |
5 Netherlands Automotive Nameplates Market Trends |
6 Netherlands Automotive Nameplates Market Segmentations |
6.1 Netherlands Automotive Nameplates Market, By Product Type |
6.1.1 Overview and Analysis |
6.1.2 Netherlands Automotive Nameplates Market Revenues & Volume, By ABS Automotive Nameplates, 2022 - 2032F |
6.1.3 Netherlands Automotive Nameplates Market Revenues & Volume, By Carbon Fiber Automotive Nameplates, 2022 - 2032F |
6.1.4 Netherlands Automotive Nameplates Market Revenues & Volume, By Chrome Automotive Nameplates, 2022 - 2032F |
6.1.5 Netherlands Automotive Nameplates Market Revenues & Volume, By Other, 2022 - 2032F |
6.2 Netherlands Automotive Nameplates Market, By Application |
6.2.1 Overview and Analysis |
6.2.2 Netherlands Automotive Nameplates Market Revenues & Volume, By Passenger Car, 2022 - 2032F |
6.2.3 Netherlands Automotive Nameplates Market Revenues & Volume, By Commercial Vehicle, 2022 - 2032F |
7 Netherlands Automotive Nameplates Market Import-Export Trade Statistics |
7.1 Netherlands Automotive Nameplates Market Export to Major Countries |
7.2 Netherlands Automotive Nameplates Market Imports from Major Countries |
8 Netherlands Automotive Nameplates Market Key Performance Indicators |
8.1 Average vehicle weight reduction percentage year-over-year |
8.2 Percentage of electric and hybrid vehicles in total vehicle registrations in the Netherlands |
8.3 Adoption rate of new manufacturing technologies in automotive nameplate production |
9 Netherlands Automotive Nameplates Market - Opportunity Assessment |
9.1 Netherlands Automotive Nameplates Market Opportunity Assessment, By Product Type, 2022 & 2032F |
9.2 Netherlands Automotive Nameplates Market Opportunity Assessment, By Application, 2022 & 2032F |
10 Netherlands Automotive Nameplates Market - Competitive Landscape |
10.1 Netherlands Automotive Nameplates Market Revenue Share, By Companies, 2025 |
10.2 Netherlands Automotive Nameplates Market Competitive Benchmarking, By Operating and Technical Parameters |
11 Company Profiles |
12 Recommendations | 13 Disclaimer |
Global Go To Market Strategy - 2030
Export potential enables firms to identify high-growth global markets with greater confidence by combining advanced trade intelligence with a structured quantitative methodology. The framework analyzes emerging demand trends and country-level import patterns while integrating macroeconomic and trade datasets such as GDP and population forecasts, bilateral import–export flows, tariff structures, elasticity differentials between developed and developing economies, geographic distance, and import demand projections. Using weighted trade values from 2020–2024 as the base period to project country-to-country export potential for 2030, these inputs are operationalized through calculated drivers such as gravity model parameters, tariff impact factors, and projected GDP per-capita growth. Through an analysis of hidden potentials, demand hotspots, and market conditions that are most favorable to success, this method enables firms to focus on target countries, maximize returns, and global expansion with data, backed by accuracy.
By factoring in the projected importer demand gap that is currently unmet and could be potential opportunity, it identifies the potential for the Exporter (Country) among 190 countries, against the general trade analysis, which identifies the biggest importer or exporter.
To discover high-growth global markets and optimize your business strategy:
Click Here
Pricing
- Single User License$ 1,995
- Department License$ 2,400
- Site License$ 3,120
- Global License$ 3,795

Leadership Perspectives from Industry Events
Search
Thought Leadership and Analyst Meet


Our Clients
6WResearch In News
- India Export Attractiveness Tracker 2026
- India Air Conditioner Market Set for Strong Rebound in 2026 After Weather-Led Correction and GST-Driven Recovery: 6Wresearch
- ADAS in India: How Automatic Emergency Braking, Blind Spot Detection & Driver Monitoring are Transforming Road Safety
- Doha a strategic location for EV manufacturing hub: IPA Qatar
- Demand for luxury TVs surging in the GCC, says Samsung
- Empowering Growth: The Thriving Journey of Bangladesh’s Cable Industry
Latest Reports
- Nicaragua RPG Gaming Market (2026-2032)
- New Zealand RPG Gaming Market (2026-2032)
- Netherlands RPG Gaming Market (2026-2032)
- Nauru RPG Gaming Market (2026-2032)
- Namibia RPG Gaming Market (2026-2032)
- Mozambique RPG Gaming Market (2026-2032)
- Montenegro RPG Gaming Market (2026-2032)
- Mongolia RPG Gaming Market (2026-2032)
- Monaco RPG Gaming Market (2026-2032)
- Micronesia RPG Gaming Market (2026-2032)
Industry Events and Analyst Meet

EV India Expo 2026

HIMTEX 2026

India Refining Summit 2026

India EV Show 2026

EV tech India Expo 2026
Whitepaper
- Middle East & Africa Commercial Security Market Click here to view more.
- Middle East & Africa Fire Safety Systems & Equipment Market Click here to view more.
- GCC Drone Market Click here to view more.
- Middle East Lighting Fixture Market Click here to view more.
- GCC Physical & Perimeter Security Market Click here to view more.