Netherlands Bakery Fat Market (2026-2032) | Competitive Landscape, Industry, Companies, Outlook, Forecast, Size & Revenue, Segmentation, Trends, Analysis, Share, Value, Growth
Market Forecast By Type (Shortening, Margarine, Bakery Oils, Others), By End-use (Industrial, Residential), By Distribution Channel (B2B, B2C, Online Retailing) And Competitive Landscape
| Product Code: ETC8533035 | Publication Date: Sep 2024 | Updated Date: Apr 2026 | Product Type: Market Research Report | |
| Publisher: 6Wresearch | Author: Vasudha | No. of Pages: 75 | No. of Figures: 35 | No. of Tables: 20 |
Netherlands Bakery Fat Market Size (2020-2030)
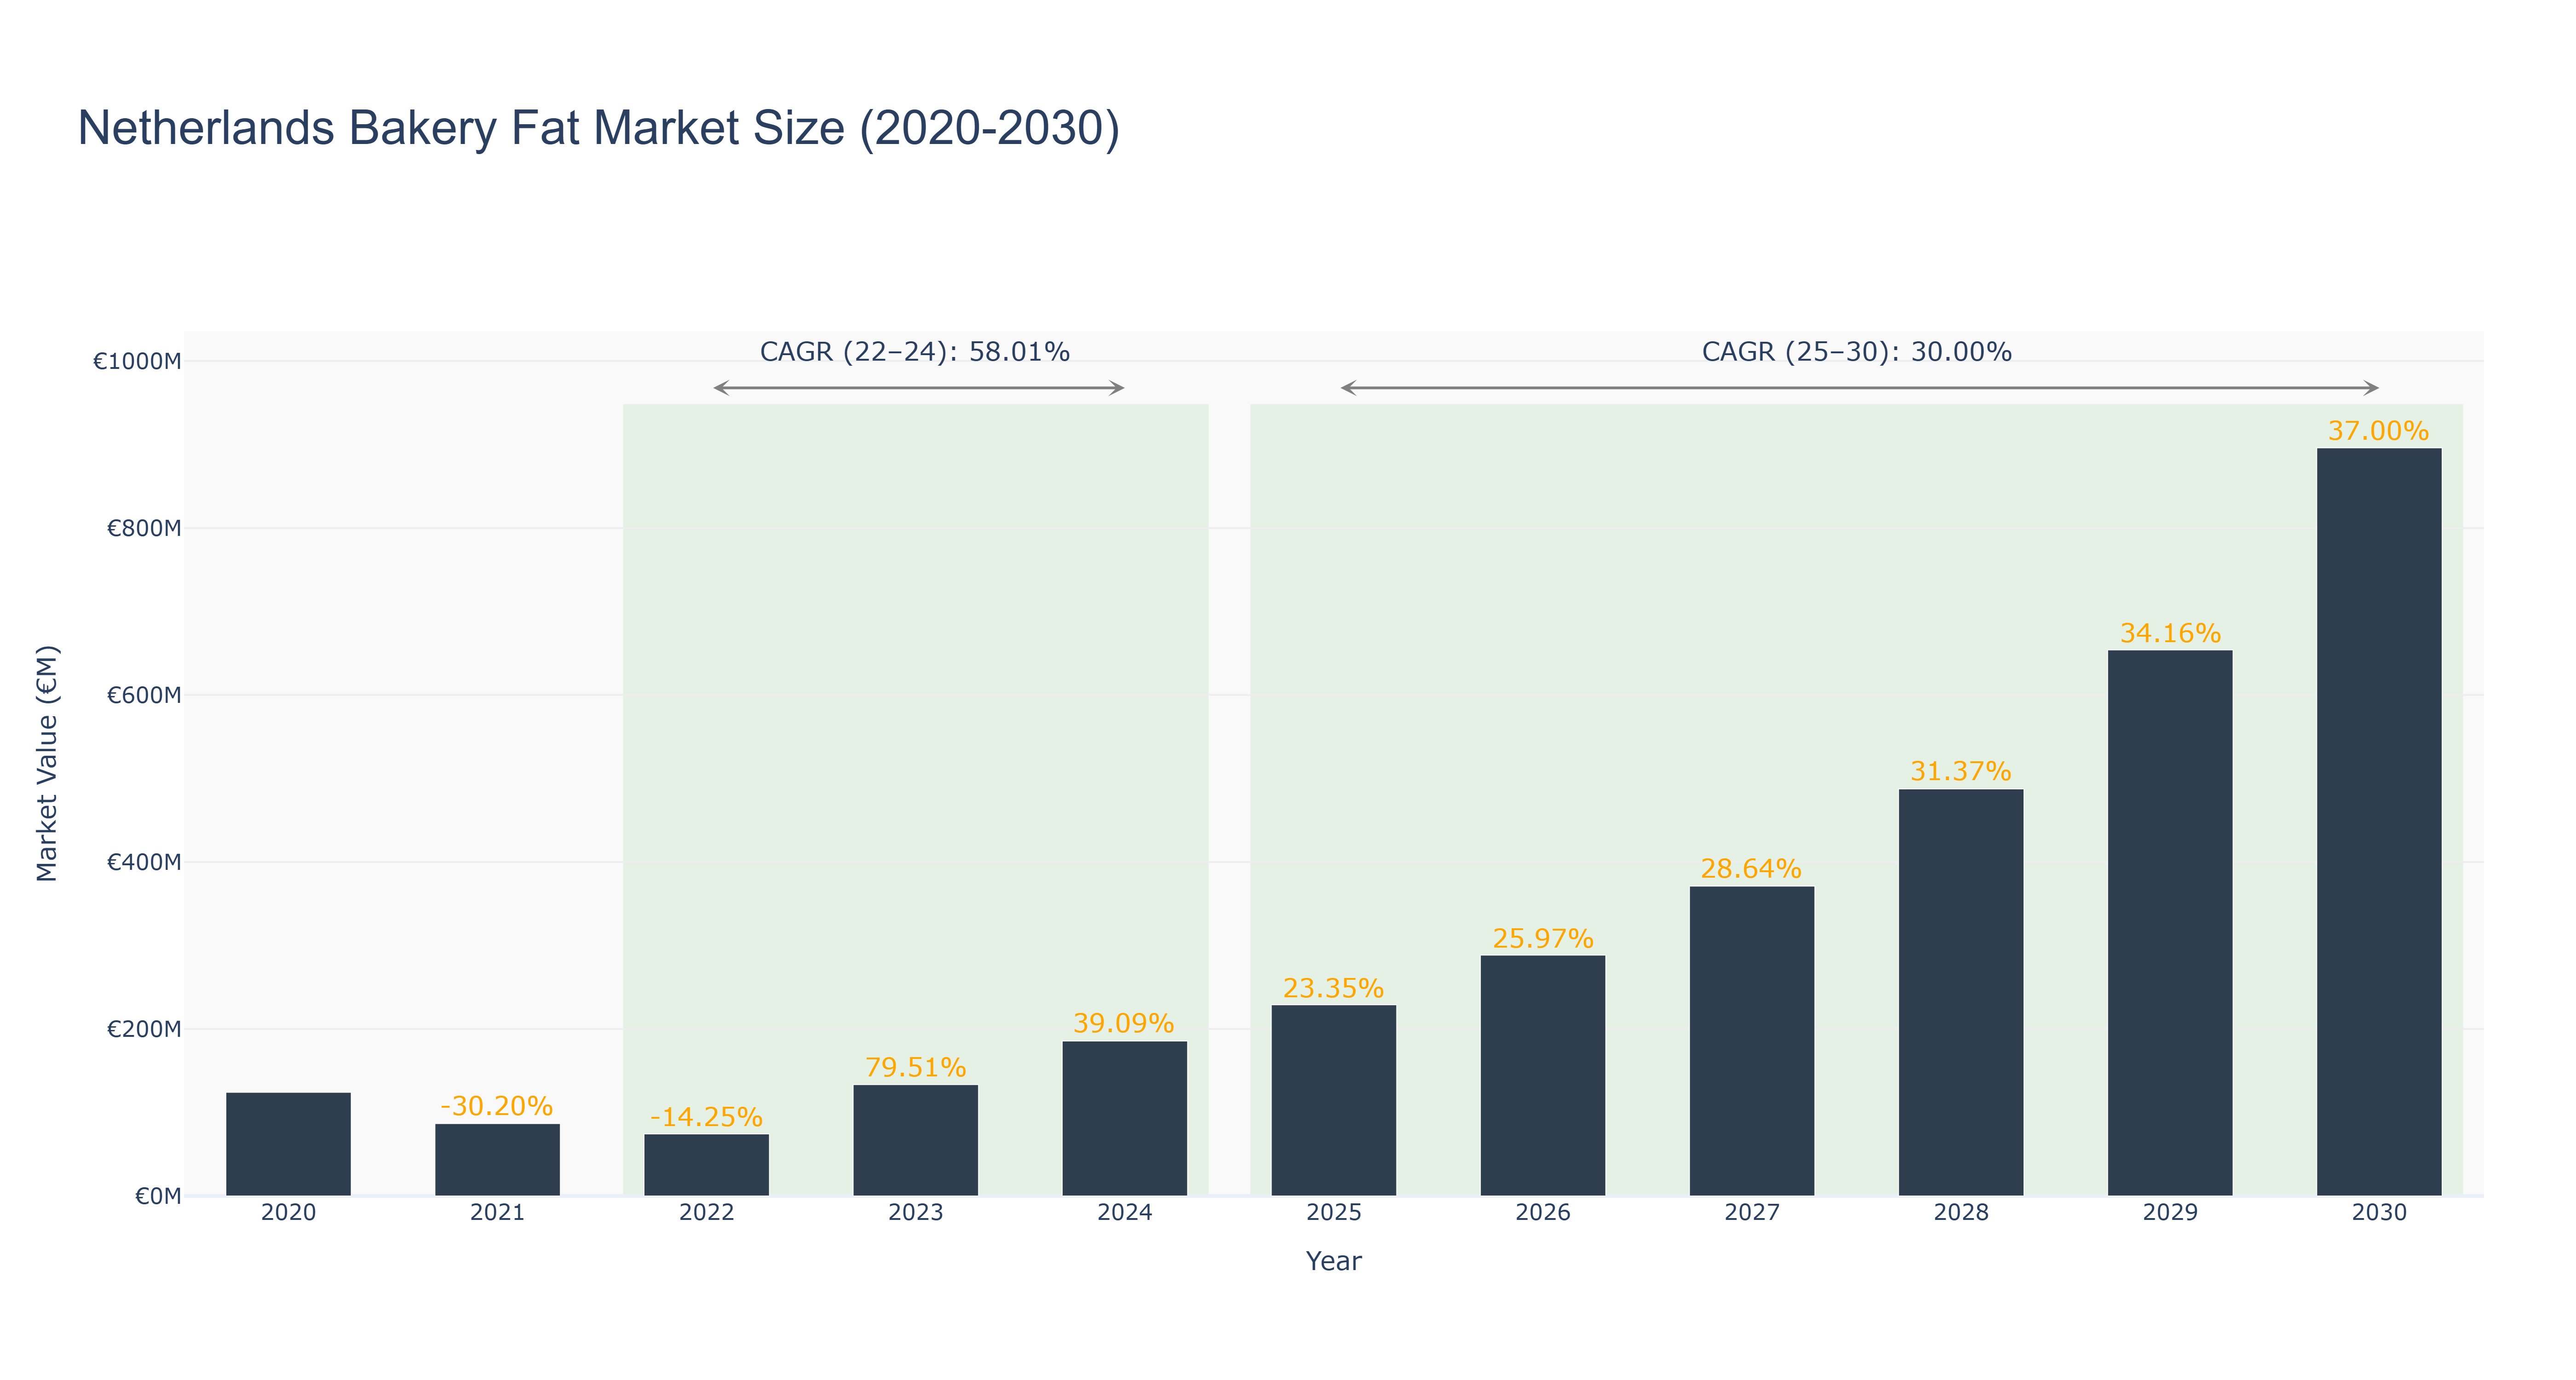
Netherlands Bakery Fat Market has shown a fluctuating trend in recent years. The market peaked in 2030 at €896.03 million, with a notable growth rate of 37.00%. From 2020 to 2024, the market size decreased from €124.22 million to €185.64 million due to economic uncertainties and changing consumer preferences. However, a significant recovery was witnessed from 2025 to 2030, with the market size forecasted to reach €896.03 million, showcasing a CAGR of 30.0%. The industry drivers behind this growth include increasing demand for healthy bakery products and technological advancements in fat production processes. Looking ahead, the Netherlands Bakery Fat Market is expected to witness further growth driven by investments in sustainable production practices and innovative product offerings tailored to health-conscious consumers.
Netherlands Bakery Fat Market: Production & Trade Performance (2019-2025)
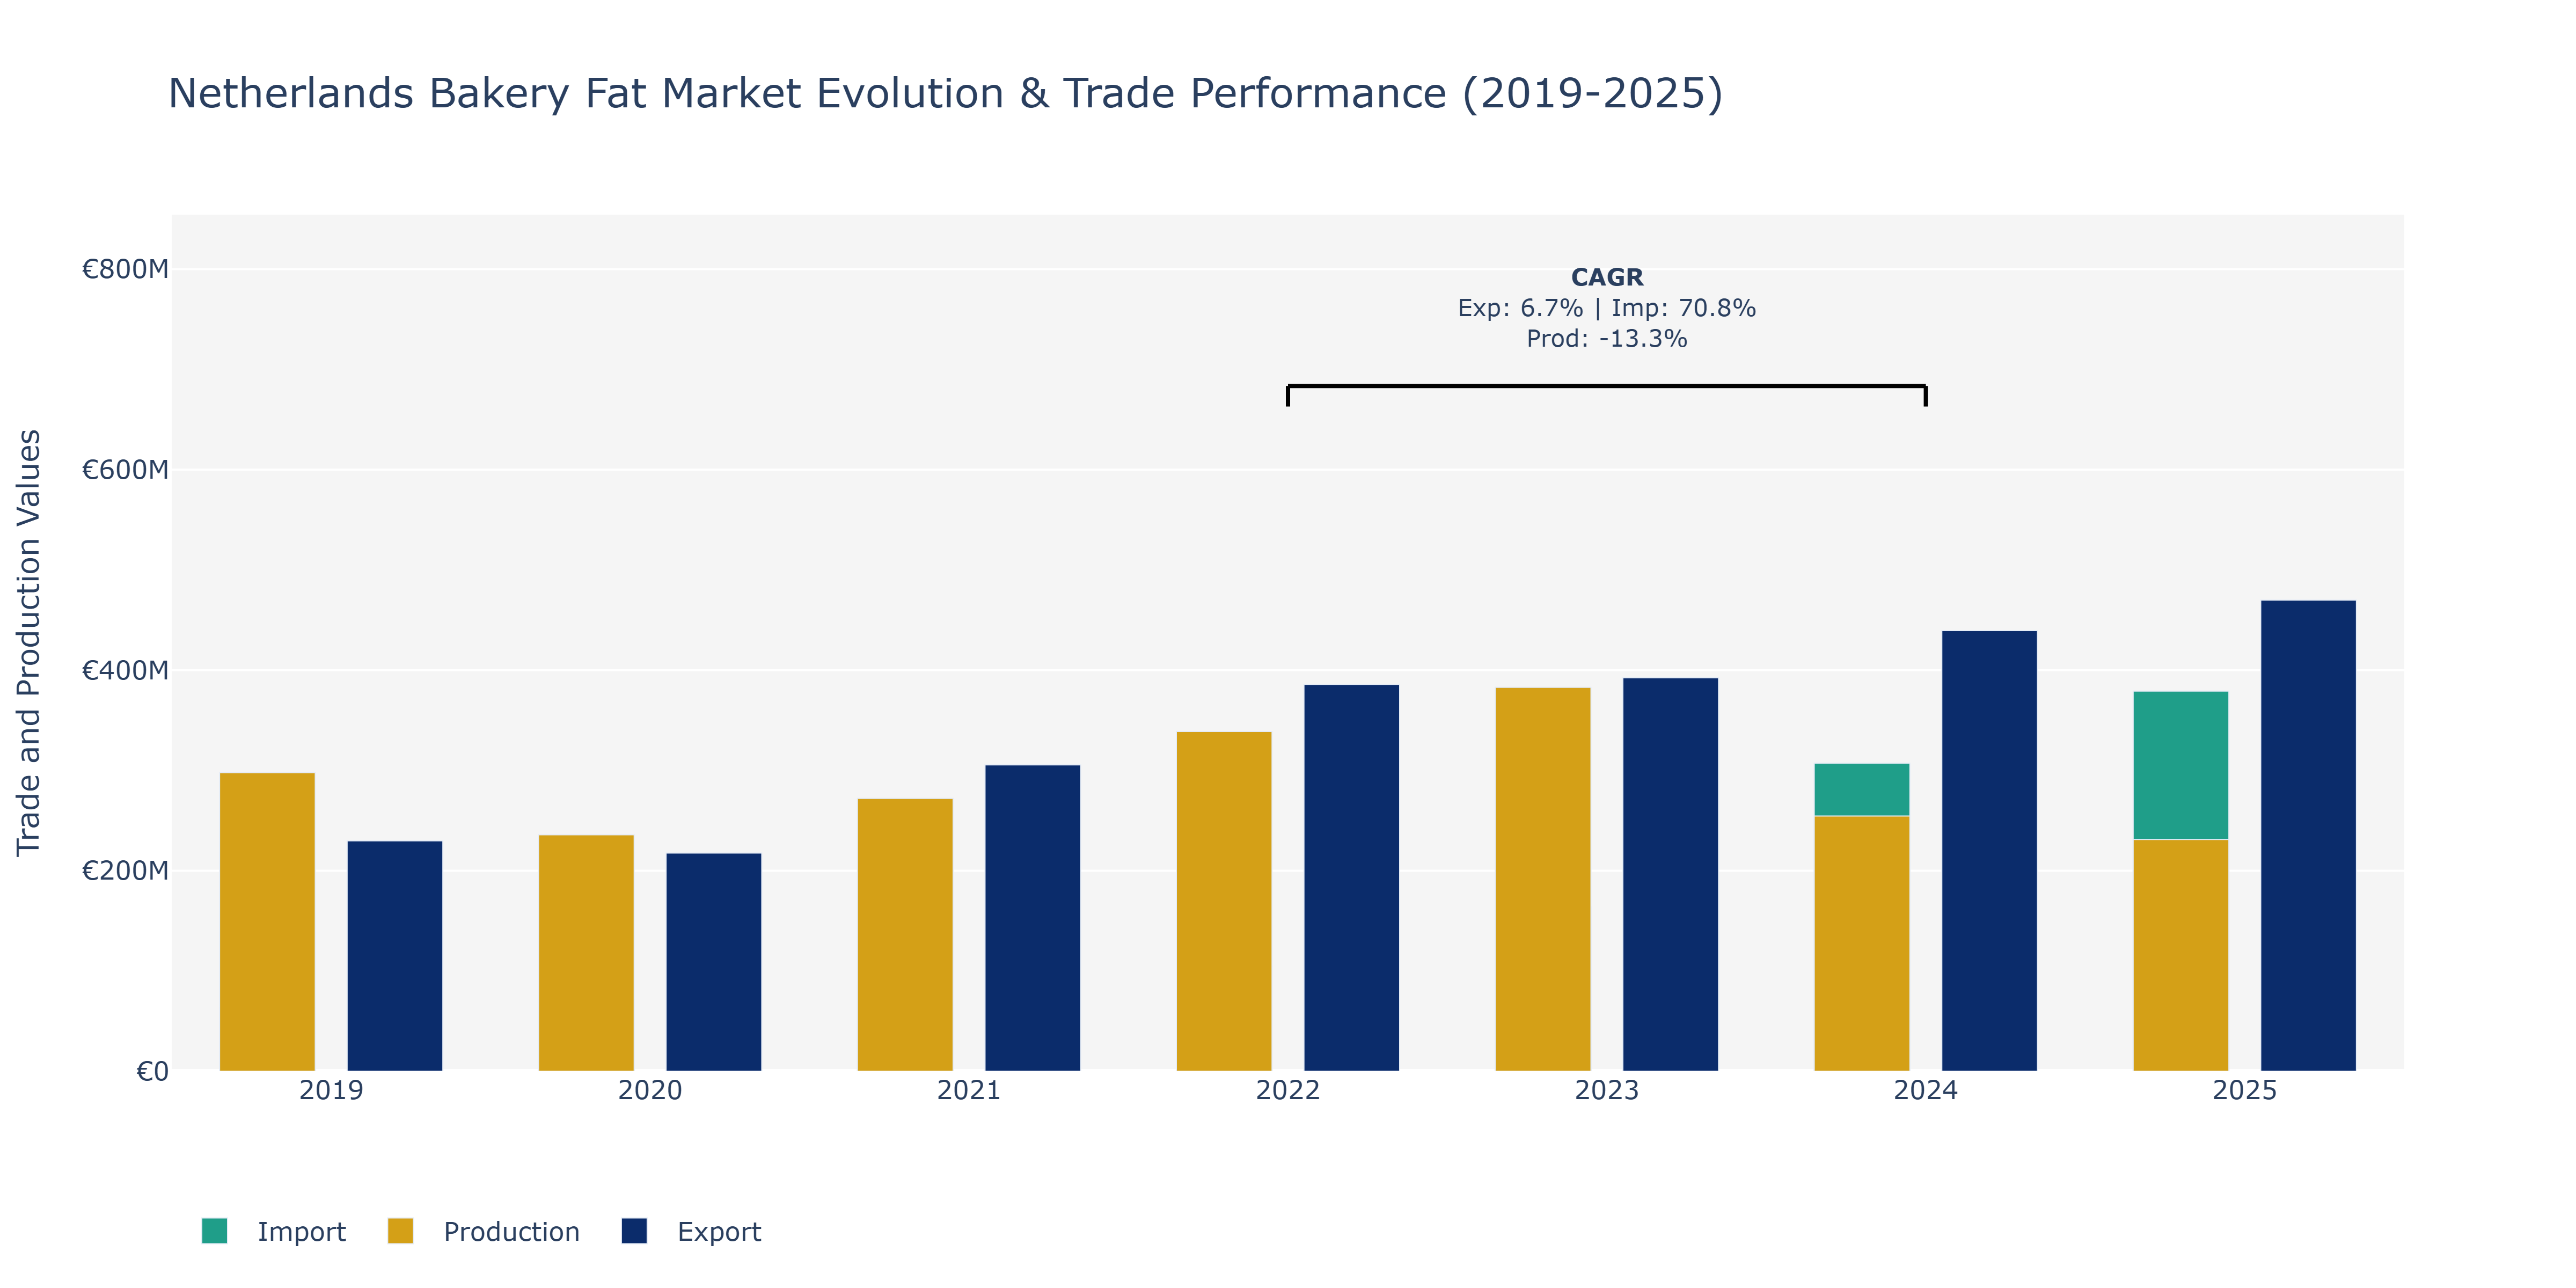
In the Netherlands Bakery Fat Market, from 2019 to 2025, Exports demonstrated a fluctuating trend, starting at €229.83 million in 2019, dipping to €217.65 million in 2020, and then steadily increasing to €469.85 million in 2025, indicating a peak point. Imports, on the other hand, rose consistently from €63.57 million in 2019 to €379.07 million in 2025, with a notable spike in 2024. Production value fluctuated more prominently, decreasing from €297.75 million in 2019 to €231.17 million in 2025, showing a significant decline. These movements can be attributed to various factors such as evolving consumer preferences towards healthier alternatives, global economic conditions affecting trade patterns, and advancements in production technologies aimed at efficiency and cost-effectiveness within the market. For instance, the surge in imports could be influenced by shifting supply chain dynamics and the quest for diverse product offerings to meet changing consumer demands.
Key Highlights of the Report:
- Netherlands Bakery Fat Market Outlook
- Market Size of Netherlands Bakery Fat Market, 2025
- Forecast of Netherlands Bakery Fat Market, 2032
- Historical Data and Forecast of Netherlands Bakery Fat Revenues & Volume for the Period 2022 - 2032
- Netherlands Bakery Fat Market Trend Evolution
- Netherlands Bakery Fat Market Drivers and Challenges
- Netherlands Bakery Fat Price Trends
- Netherlands Bakery Fat Porter's Five Forces
- Netherlands Bakery Fat Industry Life Cycle
- Historical Data and Forecast of Netherlands Bakery Fat Market Revenues & Volume By Type for the Period 2022 - 2032
- Historical Data and Forecast of Netherlands Bakery Fat Market Revenues & Volume By Shortening for the Period 2022 - 2032
- Historical Data and Forecast of Netherlands Bakery Fat Market Revenues & Volume By Margarine for the Period 2022 - 2032
- Historical Data and Forecast of Netherlands Bakery Fat Market Revenues & Volume By Bakery Oils for the Period 2022 - 2032
- Historical Data and Forecast of Netherlands Bakery Fat Market Revenues & Volume By Others for the Period 2022 - 2032
- Historical Data and Forecast of Netherlands Bakery Fat Market Revenues & Volume By End-use for the Period 2022 - 2032
- Historical Data and Forecast of Netherlands Bakery Fat Market Revenues & Volume By Industrial for the Period 2022 - 2032
- Historical Data and Forecast of Netherlands Bakery Fat Market Revenues & Volume By Residential for the Period 2022 - 2032
- Historical Data and Forecast of Netherlands Bakery Fat Market Revenues & Volume By Distribution Channel for the Period 2022 - 2032
- Historical Data and Forecast of Netherlands Bakery Fat Market Revenues & Volume By B2B for the Period 2022 - 2032
- Historical Data and Forecast of Netherlands Bakery Fat Market Revenues & Volume By B2C for the Period 2022 - 2032
- Historical Data and Forecast of Netherlands Bakery Fat Market Revenues & Volume By Online Retailing for the Period 2022 - 2032
- Netherlands Bakery Fat Import Export Trade Statistics
- Market Opportunity Assessment By Type
- Market Opportunity Assessment By End-use
- Market Opportunity Assessment By Distribution Channel
- Netherlands Bakery Fat Top Companies Market Share
- Netherlands Bakery Fat Competitive Benchmarking By Technical and Operational Parameters
- Netherlands Bakery Fat Company Profiles
- Netherlands Bakery Fat Key Strategic Recommendations
Frequently Asked Questions About the Market Study (FAQs):
6Wresearch actively monitors the Netherlands Bakery Fat Market and publishes its comprehensive annual report, highlighting emerging trends, growth drivers, revenue analysis, and forecast outlook. Our insights help businesses to make data-backed strategic decisions with ongoing market dynamics. Our analysts track relevent industries related to the Netherlands Bakery Fat Market, allowing our clients with actionable intelligence and reliable forecasts tailored to emerging regional needs.
Yes, we provide customisation as per your requirements. To learn more, feel free to contact us on sales@6wresearch.com
1 Executive Summary |
2 Introduction |
2.1 Key Highlights of the Report |
2.2 Report Description |
2.3 Market Scope & Segmentation |
2.4 Research Methodology |
2.5 Assumptions |
3 Netherlands Bakery Fat Market Overview |
3.1 Netherlands Country Macro Economic Indicators |
3.2 Netherlands Bakery Fat Market Revenues & Volume, 2022 & 2032F |
3.3 Netherlands Bakery Fat Market - Industry Life Cycle |
3.4 Netherlands Bakery Fat Market - Porter's Five Forces |
3.5 Netherlands Bakery Fat Market Revenues & Volume Share, By Type, 2022 & 2032F |
3.6 Netherlands Bakery Fat Market Revenues & Volume Share, By End-use, 2022 & 2032F |
3.7 Netherlands Bakery Fat Market Revenues & Volume Share, By Distribution Channel, 2022 & 2032F |
4 Netherlands Bakery Fat Market Dynamics |
4.1 Impact Analysis |
4.2 Market Drivers |
4.2.1 Increasing consumer preference for healthier bakery products |
4.2.2 Growing demand for specialty bakery fats with specific functionalities |
4.2.3 Rise in industrial bakery production in the Netherlands |
4.3 Market Restraints |
4.3.1 Fluctuating prices of raw materials impacting production costs |
4.3.2 Stringent regulations on trans fats and sustainability concerns in the bakery fat industry |
5 Netherlands Bakery Fat Market Trends |
6 Netherlands Bakery Fat Market, By Types |
6.1 Netherlands Bakery Fat Market, By Type |
6.1.1 Overview and Analysis |
6.1.2 Netherlands Bakery Fat Market Revenues & Volume, By Type, 2022 - 2032F |
6.1.3 Netherlands Bakery Fat Market Revenues & Volume, By Shortening, 2022 - 2032F |
6.1.4 Netherlands Bakery Fat Market Revenues & Volume, By Margarine, 2022 - 2032F |
6.1.5 Netherlands Bakery Fat Market Revenues & Volume, By Bakery Oils, 2022 - 2032F |
6.1.6 Netherlands Bakery Fat Market Revenues & Volume, By Others, 2022 - 2032F |
6.2 Netherlands Bakery Fat Market, By End-use |
6.2.1 Overview and Analysis |
6.2.2 Netherlands Bakery Fat Market Revenues & Volume, By Industrial, 2022 - 2032F |
6.2.3 Netherlands Bakery Fat Market Revenues & Volume, By Residential, 2022 - 2032F |
6.3 Netherlands Bakery Fat Market, By Distribution Channel |
6.3.1 Overview and Analysis |
6.3.2 Netherlands Bakery Fat Market Revenues & Volume, By B2B, 2022 - 2032F |
6.3.3 Netherlands Bakery Fat Market Revenues & Volume, By B2C, 2022 - 2032F |
6.3.4 Netherlands Bakery Fat Market Revenues & Volume, By Online Retailing, 2022 - 2032F |
7 Netherlands Bakery Fat Market Import-Export Trade Statistics |
7.1 Netherlands Bakery Fat Market Export to Major Countries |
7.2 Netherlands Bakery Fat Market Imports from Major Countries |
8 Netherlands Bakery Fat Market Key Performance Indicators |
8.1 Percentage of bakery fats with clean label ingredients |
8.2 Adoption rate of specialty bakery fats with functional benefits |
8.3 Efficiency of production processes in reducing waste and costs |
9 Netherlands Bakery Fat Market - Opportunity Assessment |
9.1 Netherlands Bakery Fat Market Opportunity Assessment, By Type, 2022 & 2032F |
9.2 Netherlands Bakery Fat Market Opportunity Assessment, By End-use, 2022 & 2032F |
9.3 Netherlands Bakery Fat Market Opportunity Assessment, By Distribution Channel, 2022 & 2032F |
10 Netherlands Bakery Fat Market - Competitive Landscape |
10.1 Netherlands Bakery Fat Market Revenue Share, By Companies, 2025 |
10.2 Netherlands Bakery Fat Market Competitive Benchmarking, By Operating and Technical Parameters |
11 Company Profiles |
12 Recommendations |
13 Disclaimer |
Export potential assessment - trade Analytics for 2030
Export potential enables firms to identify high-growth global markets with greater confidence by combining advanced trade intelligence with a structured quantitative methodology. The framework analyzes emerging demand trends and country-level import patterns while integrating macroeconomic and trade datasets such as GDP and population forecasts, bilateral import–export flows, tariff structures, elasticity differentials between developed and developing economies, geographic distance, and import demand projections. Using weighted trade values from 2020–2024 as the base period to project country-to-country export potential for 2030, these inputs are operationalized through calculated drivers such as gravity model parameters, tariff impact factors, and projected GDP per-capita growth. Through an analysis of hidden potentials, demand hotspots, and market conditions that are most favorable to success, this method enables firms to focus on target countries, maximize returns, and global expansion with data, backed by accuracy.
By factoring in the projected importer demand gap that is currently unmet and could be potential opportunity, it identifies the potential for the Exporter (Country) among 190 countries, against the general trade analysis, which identifies the biggest importer or exporter.
To discover high-growth global markets and optimize your business strategy:
Click Here
Pricing
- Single User License$ 1,995
- Department License$ 2,400
- Site License$ 3,120
- Global License$ 3,795

Search
Thought Leadership and Analyst Meet


Our Clients
Latest Reports
- Philippines Polyhydroxybutyrate-co-Hydroxyvalerate Market (2026-2032) | Trends, Insights, Challenges, Restraints, Competition, Size, Value, Forecast, Pricing, Share, Outlook, Revenue, Investment Opportunities, Strategy, Drivers, Demand, Growth, segmentation, Analysis, Companies
- Peru Polyhydroxybutyrate-co-Hydroxyvalerate Market (2026-2032) | Growth, Demand, Challenges, Share, Trends, Analysis, Pricing, Investment Opportunities, Drivers, Value, Forecast, Competition, Size, Companies, Insights, Outlook, Restraints, segmentation, Revenue, Strategy
- Pakistan Polyhydroxybutyrate-co-Hydroxyvalerate Market (2026-2032) | Restraints, segmentation, Pricing, Forecast, Share, Strategy, Competition, Trends, Insights, Drivers, Challenges, Growth, Revenue, Outlook, Value, Investment Opportunities, Companies, Size, Analysis, Demand
- Oman Polyhydroxybutyrate-co-Hydroxyvalerate Market (2026-2032) | Drivers, segmentation, Insights, Competition, Pricing, Outlook, Size, Revenue, Challenges, Forecast, Analysis, Growth, Value, Share, Trends, Investment Opportunities, Strategy, Restraints, Companies, Demand
- Nigeria Polyhydroxybutyrate-co-Hydroxyvalerate Market (2026-2032) | Value, Investment Opportunities, Analysis, Revenue, Restraints, Pricing, Outlook, Competition, Demand, Growth, Forecast, Companies, Trends, Challenges, segmentation, Drivers, Insights, Share, Size, Strategy
- Nepal Polyhydroxybutyrate-co-Hydroxyvalerate Market (2026-2032) | Insights, Analysis, Drivers, Share, Revenue, Demand, segmentation, Investment Opportunities, Competition, Forecast, Growth, Pricing, Companies, Strategy, Trends, Restraints, Challenges, Outlook, Size, Value
- Myanmar Polyhydroxybutyrate-co-Hydroxyvalerate Market (2026-2032) | Outlook, Revenue, Strategy, Restraints, Drivers, segmentation, Share, Forecast, Competition, Insights, Growth, Pricing, Size, Demand, Value, Companies, Trends, Challenges, Investment Opportunities, Analysis
- Morocco Polyhydroxybutyrate-co-Hydroxyvalerate Market (2026-2032) | Outlook, Investment Opportunities, Restraints, Strategy, Forecast, Challenges, Drivers, Growth, Companies, segmentation, Trends, Size, Competition, Revenue, Demand, Insights, Share, Analysis, Value, Pricing
- Mexico Polyhydroxybutyrate-co-Hydroxyvalerate Market (2026-2032) | Size, Drivers, Outlook, Share, Strategy, Growth, Pricing, Challenges, Companies, Demand, Value, Investment Opportunities, Restraints, Trends, Forecast, segmentation, Analysis, Insights, Competition, Revenue
- Malaysia Polyhydroxybutyrate-co-Hydroxyvalerate Market (2026-2032) | Share, segmentation, Size, Companies, Analysis, Insights, Forecast, Value, Revenue, Drivers, Restraints, Challenges, Investment Opportunities, Trends, Competition, Strategy, Demand, Growth, Outlook, Pricing
Industry Events and Analyst Meet

HIMTEX 2026

India Refining Summit 2026

India EV Show 2026

EV tech India Expo 2026

Auto Tech Asia 2026
Whitepaper
- Middle East & Africa Commercial Security Market Click here to view more.
- Middle East & Africa Fire Safety Systems & Equipment Market Click here to view more.
- GCC Drone Market Click here to view more.
- Middle East Lighting Fixture Market Click here to view more.
- GCC Physical & Perimeter Security Market Click here to view more.
6WResearch In News
- Doha a strategic location for EV manufacturing hub: IPA Qatar
- Demand for luxury TVs surging in the GCC, says Samsung
- Empowering Growth: The Thriving Journey of Bangladesh’s Cable Industry
- Demand for luxury TVs surging in the GCC, says Samsung
- Video call with a traditional healer? Once unthinkable, it’s now common in South Africa
- Intelligent Buildings To Smooth GCC’s Path To Net Zero