Netherlands Bio-Based Platform Chemicals Market (2026-2032) | Strategic Insights, Supply, Analysis, Segmentation, Competitive, Industry, Strategy, Growth, Restraints, Size, Pricing Analysis, Challenges, Segments, Companies, Demand, Outlook, Value, Revenue, Forecast, Drivers, Trends, Opportunities, Share, Investment Trends, Consumer Insights, Competition
Market Forecast By Chemical Type (Bio-Glycerol, Bio-Succinic Acid, Bio-Itaconic Acid), By Application (Pharmaceuticals, Polymers, Coatings), By End User (Healthcare, Automotive, Construction), By Source (Biomass, Plant-Based, Sugar-Based), By Sustainability Factor (Renewable, Eco-Friendly, Non-Toxic) And Competitive Landscape
| Product Code: ETC11446668 | Publication Date: Apr 2025 | Updated Date: Apr 2026 | Product Type: Market Research Report | |
| Publisher: 6Wresearch | No. of Pages: 65 | No. of Figures: 34 | No. of Tables: 19 | |
Netherlands Bio Based Platform Chemicals Market Size (2020-2030)
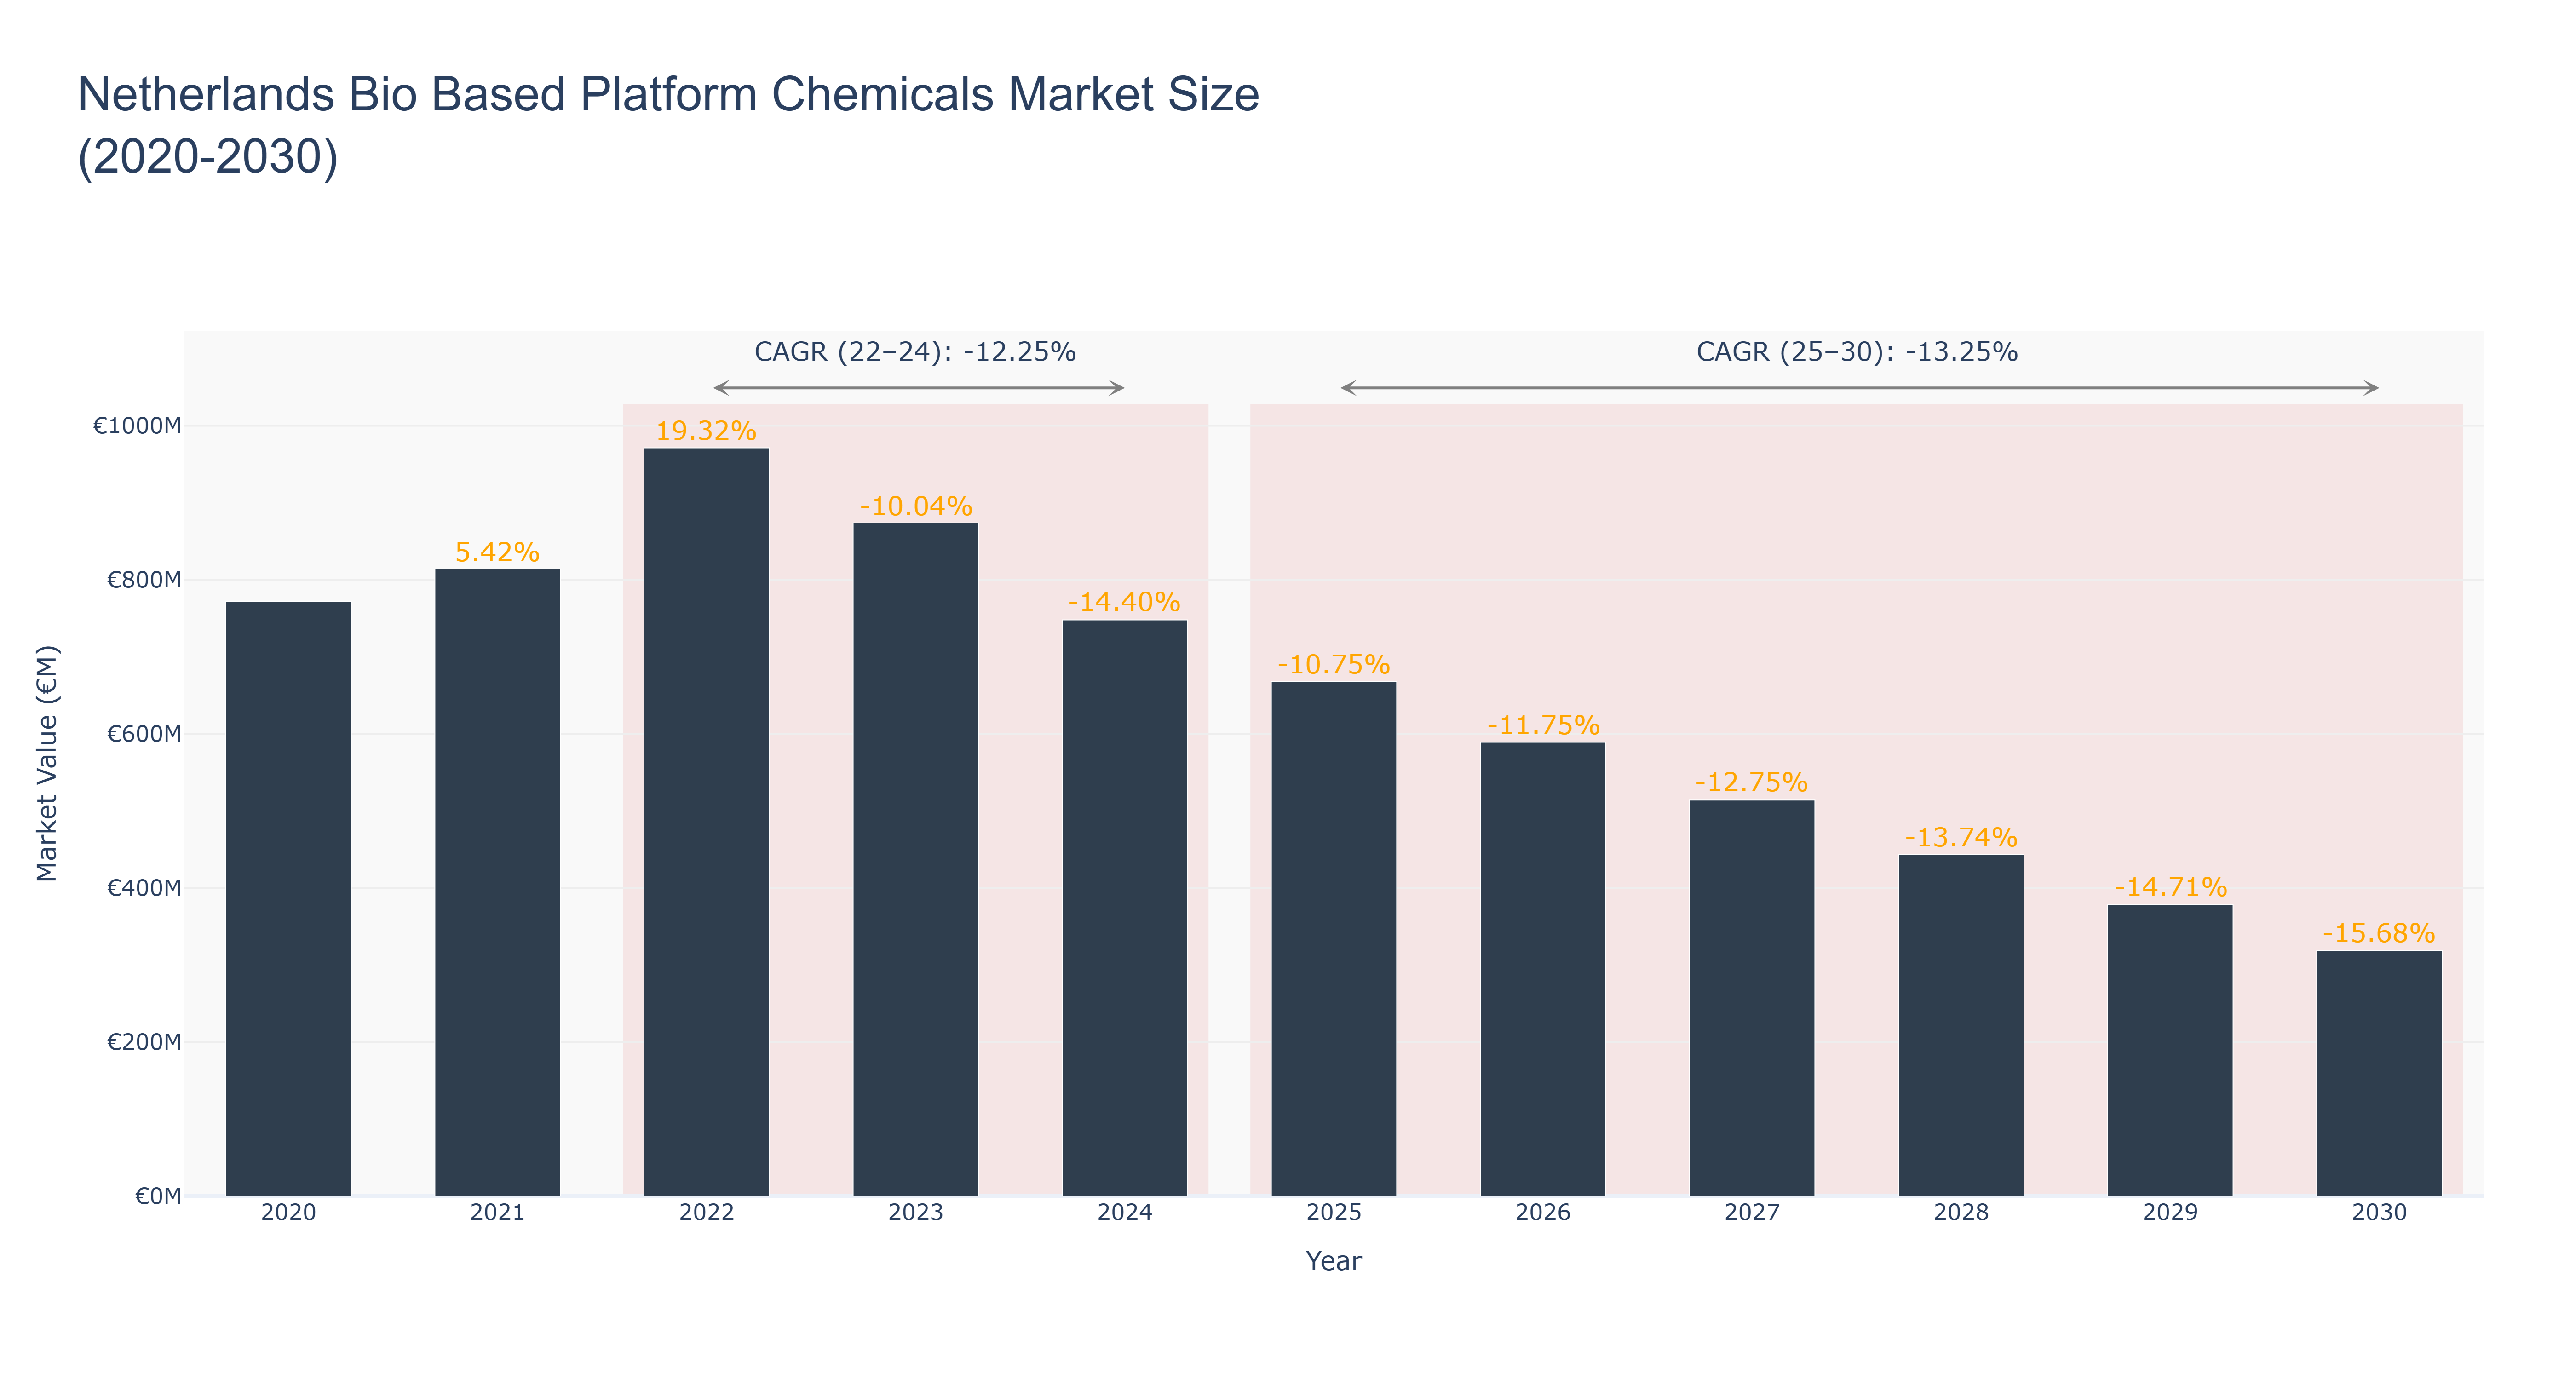
The Netherlands Bio Based Platform Chemicals Market experienced significant fluctuations between 2020 and 2024, peaking in 2022 with a market size of €971.40 million, followed by a notable decline to €748.04 million in 2024, resulting in a compound annual growth rate (CAGR) of -12.25% for the actual period. This downturn can be attributed to various factors, including supply chain disruptions and shifting regulatory landscapes that have adversely impacted production capabilities. Looking ahead, the forecasted period from 2025 to 2030 anticipates further contraction, with projected market sizes decreasing from €667.66 million in 2025 to €318.90 million by 2030, reflecting a CAGR of -13.25%. The ongoing transition towards sustainable practices remains a key driver, albeit challenged by economic pressures and competitive synthetic alternatives. Future developments in bio-based technology may offer potential recovery avenues, yet the immediate outlook remains challenging.
Netherlands Bio Based Platform Chemicals Market: Production & Trade Performance (2019-2025)
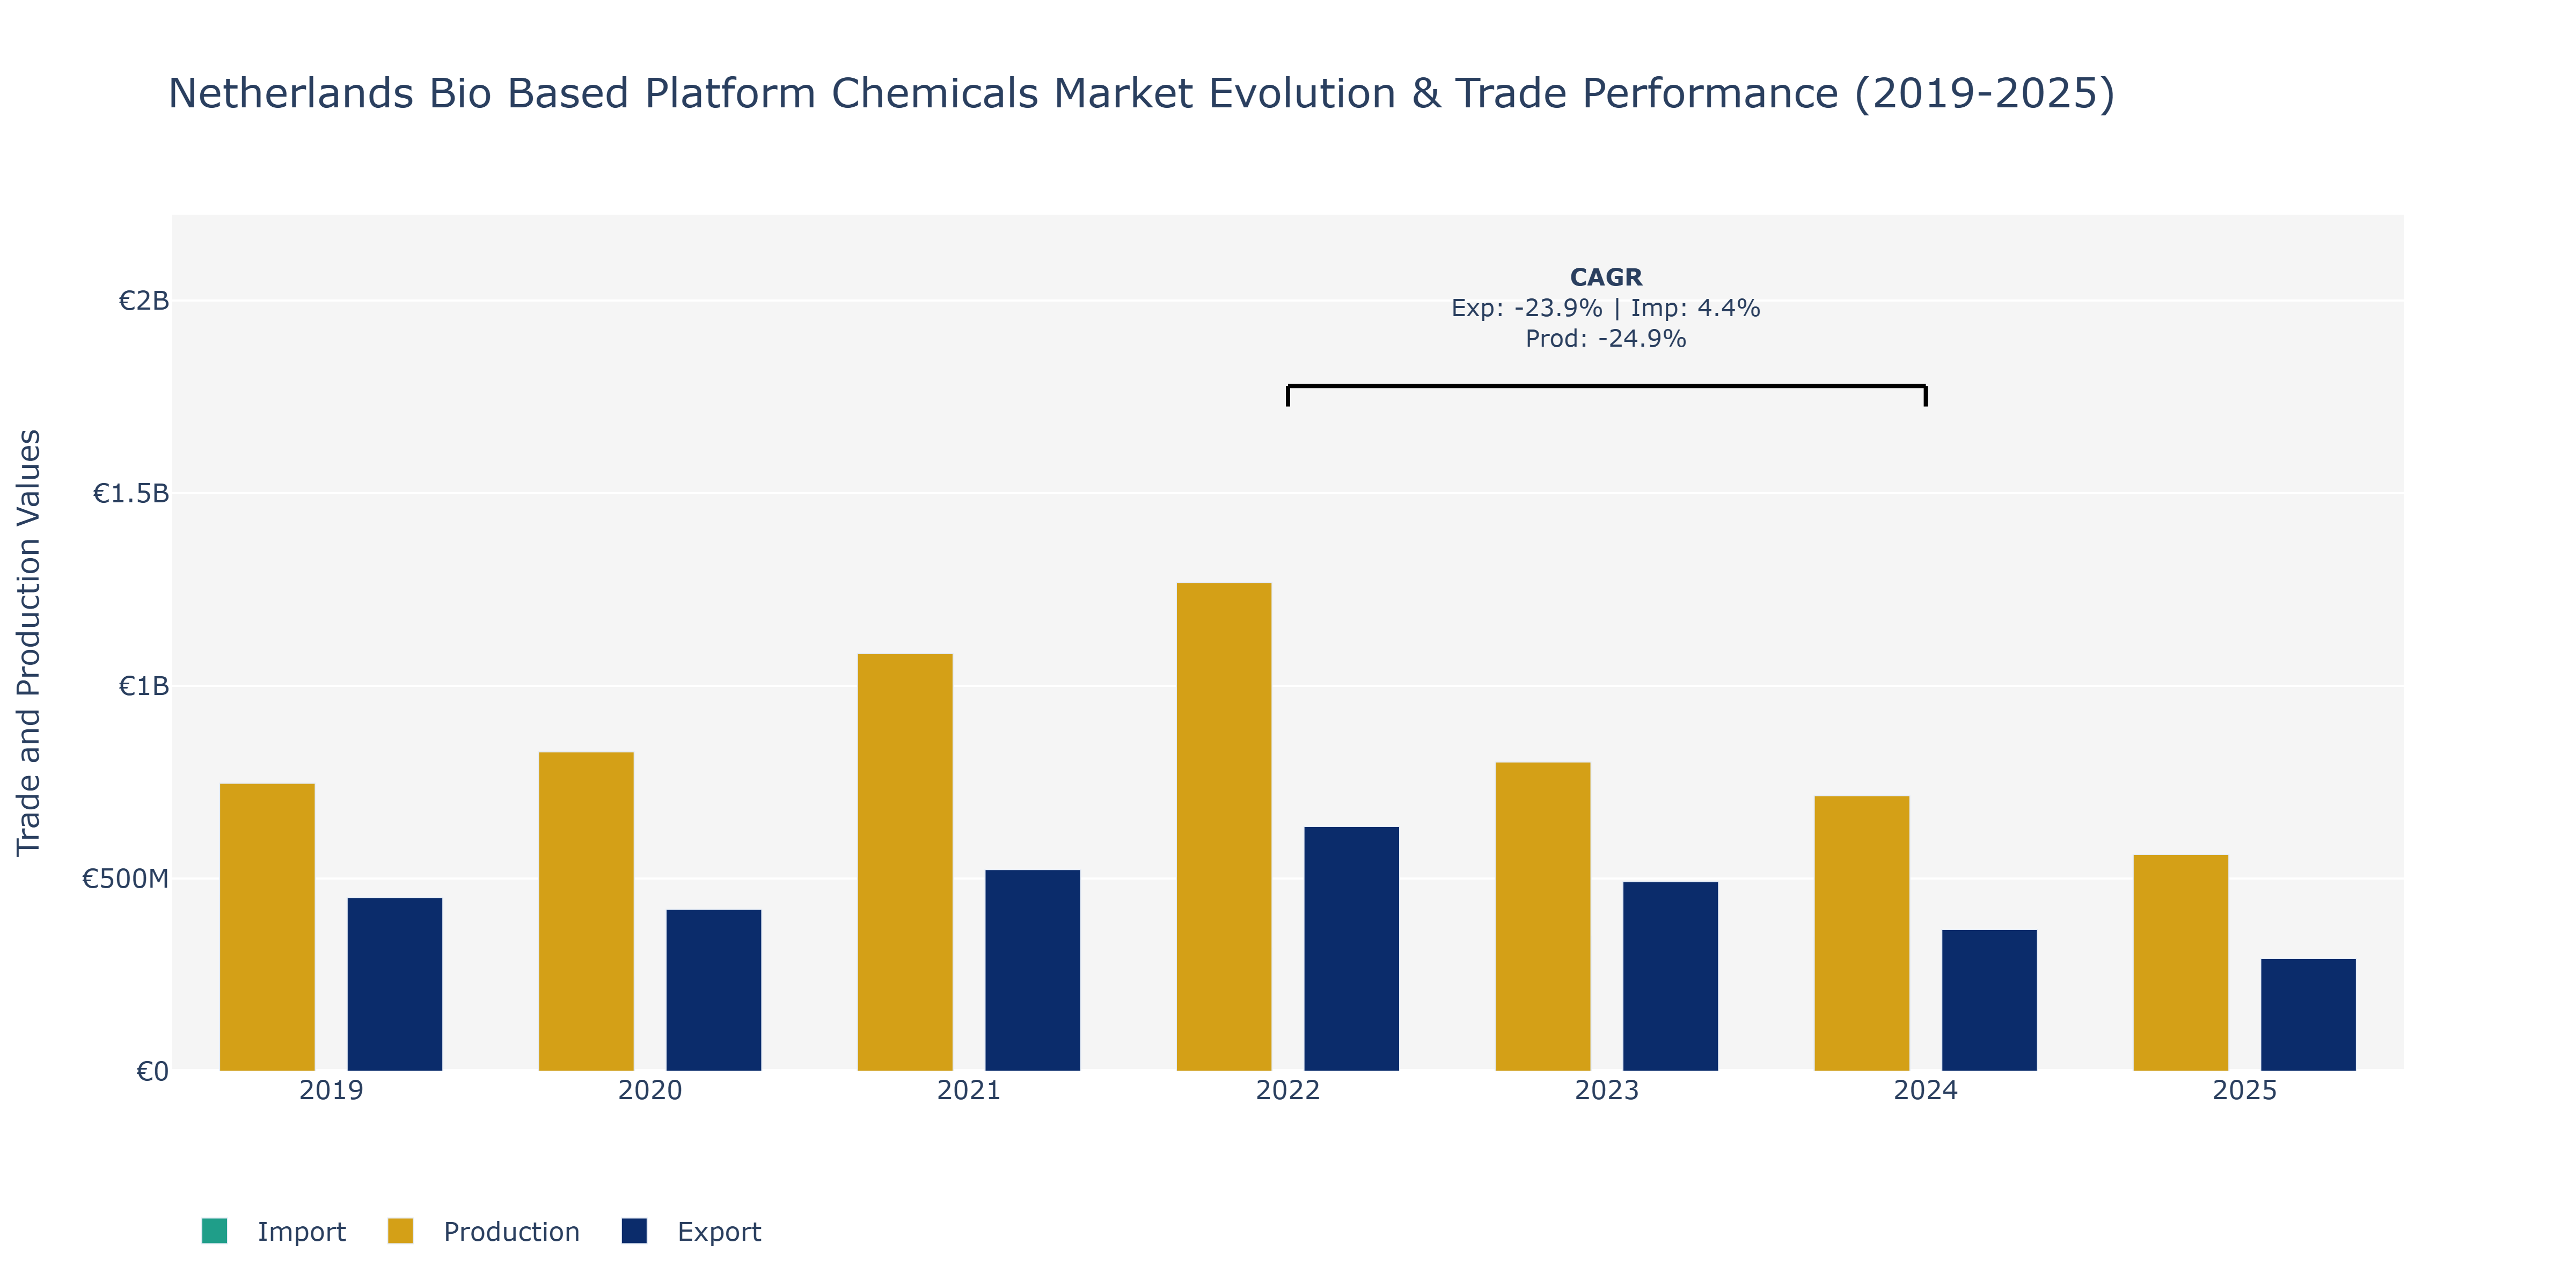
The Netherlands Bio Based Platform Chemicals Market witnessed varied performances in Exports, Imports, and Production from 2019 to 2025. Exports displayed a declining trend, starting at €450.83 million in 2019, experiencing a peak in 2022 at €634.98 million, then dropping to €292.39 million in 2025. Imports, on the other hand, fluctuated, with a peak in 2021 at €304.95 million and a slight increase by 2025, reaching €357.21 million. Production levels were highest in 2022 at €1.27 billion, followed by a significant decrease in 2025 to €562.63 million. The fluctuations in Exports and Imports could be attributed to global demand shifts, trade policies, and market competition. The decline in Production may be linked to regulatory changes, technological advancements, and evolving consumer preferences towards sustainable alternatives. With the increasing focus on sustainability and bio-based products, market players could leverage these shifts to drive innovation and market growth in the coming years.
Key Highlights of the Report:
- Netherlands Bio-Based Platform Chemicals Market Outlook
- Market Size of Netherlands Bio-Based Platform Chemicals Market, 2025
- Forecast of Netherlands Bio-Based Platform Chemicals Market, 2032
- Historical Data and Forecast of Netherlands Bio-Based Platform Chemicals Revenues & Volume for the Period 2022 - 2032F
- Netherlands Bio-Based Platform Chemicals Market Trend Evolution
- Netherlands Bio-Based Platform Chemicals Market Drivers and Challenges
- Netherlands Bio-Based Platform Chemicals Price Trends
- Netherlands Bio-Based Platform Chemicals Porter's Five Forces
- Netherlands Bio-Based Platform Chemicals Industry Life Cycle
- Historical Data and Forecast of Netherlands Bio-Based Platform Chemicals Market Revenues & Volume By Chemical Type for the Period 2022 - 2032F
- Historical Data and Forecast of Netherlands Bio-Based Platform Chemicals Market Revenues & Volume By Bio-Glycerol for the Period 2022 - 2032F
- Historical Data and Forecast of Netherlands Bio-Based Platform Chemicals Market Revenues & Volume By Bio-Succinic Acid for the Period 2022 - 2032F
- Historical Data and Forecast of Netherlands Bio-Based Platform Chemicals Market Revenues & Volume By Bio-Itaconic Acid for the Period 2022 - 2032F
- Historical Data and Forecast of Netherlands Bio-Based Platform Chemicals Market Revenues & Volume By Application for the Period 2022 - 2032F
- Historical Data and Forecast of Netherlands Bio-Based Platform Chemicals Market Revenues & Volume By Pharmaceuticals for the Period 2022 - 2032F
- Historical Data and Forecast of Netherlands Bio-Based Platform Chemicals Market Revenues & Volume By Polymers for the Period 2022 - 2032F
- Historical Data and Forecast of Netherlands Bio-Based Platform Chemicals Market Revenues & Volume By Coatings for the Period 2022 - 2032F
- Historical Data and Forecast of Netherlands Bio-Based Platform Chemicals Market Revenues & Volume By End User for the Period 2022 - 2032F
- Historical Data and Forecast of Netherlands Bio-Based Platform Chemicals Market Revenues & Volume By Healthcare for the Period 2022 - 2032F
- Historical Data and Forecast of Netherlands Bio-Based Platform Chemicals Market Revenues & Volume By Automotive for the Period 2022 - 2032F
- Historical Data and Forecast of Netherlands Bio-Based Platform Chemicals Market Revenues & Volume By Construction for the Period 2022 - 2032F
- Historical Data and Forecast of Netherlands Bio-Based Platform Chemicals Market Revenues & Volume By Source for the Period 2022 - 2032F
- Historical Data and Forecast of Netherlands Bio-Based Platform Chemicals Market Revenues & Volume By Biomass for the Period 2022 - 2032F
- Historical Data and Forecast of Netherlands Bio-Based Platform Chemicals Market Revenues & Volume By Plant-Based for the Period 2022 - 2032F
- Historical Data and Forecast of Netherlands Bio-Based Platform Chemicals Market Revenues & Volume By Sugar-Based for the Period 2022 - 2032F
- Historical Data and Forecast of Netherlands Bio-Based Platform Chemicals Market Revenues & Volume By Sustainability Factor for the Period 2022 - 2032F
- Historical Data and Forecast of Netherlands Bio-Based Platform Chemicals Market Revenues & Volume By Renewable for the Period 2022 - 2032F
- Historical Data and Forecast of Netherlands Bio-Based Platform Chemicals Market Revenues & Volume By Eco-Friendly for the Period 2022 - 2032F
- Historical Data and Forecast of Netherlands Bio-Based Platform Chemicals Market Revenues & Volume By Non-Toxic for the Period 2022 - 2032F
- Netherlands Bio-Based Platform Chemicals Import Export Trade Statistics
- Market Opportunity Assessment By Chemical Type
- Market Opportunity Assessment By Application
- Market Opportunity Assessment By End User
- Market Opportunity Assessment By Source
- Market Opportunity Assessment By Sustainability Factor
- Netherlands Bio-Based Platform Chemicals Top Companies Market Share
- Netherlands Bio-Based Platform Chemicals Competitive Benchmarking By Technical and Operational Parameters
- Netherlands Bio-Based Platform Chemicals Company Profiles
- Netherlands Bio-Based Platform Chemicals Key Strategic Recommendations
Frequently Asked Questions About the Market Study (FAQs):
6Wresearch actively monitors the Netherlands Bio-Based Platform Chemicals Market and publishes its comprehensive annual report, highlighting emerging trends, growth drivers, revenue analysis, and forecast outlook. Our insights help businesses to make data-backed strategic decisions with ongoing market dynamics. Our analysts track relevent industries related to the Netherlands Bio-Based Platform Chemicals Market, allowing our clients with actionable intelligence and reliable forecasts tailored to emerging regional needs.
Yes, we provide customisation as per your requirements. To learn more, feel free to contact us on sales@6wresearch.com
1 Executive Summary |
2 Introduction |
2.1 Key Highlights of the Report |
2.2 Report Description |
2.3 Market Scope & Segmentation |
2.4 Research Methodology |
2.5 Assumptions |
3 Netherlands Bio-Based Platform Chemicals Market Overview |
3.1 Netherlands Country Macro Economic Indicators |
3.2 Netherlands Bio-Based Platform Chemicals Market Revenues & Volume, 2022 & 2032F |
3.3 Netherlands Bio-Based Platform Chemicals Market - Industry Life Cycle |
3.4 Netherlands Bio-Based Platform Chemicals Market - Porter's Five Forces |
3.5 Netherlands Bio-Based Platform Chemicals Market Revenues & Volume Share, By Chemical Type, 2022 & 2032F |
3.6 Netherlands Bio-Based Platform Chemicals Market Revenues & Volume Share, By Application, 2022 & 2032F |
3.7 Netherlands Bio-Based Platform Chemicals Market Revenues & Volume Share, By End User, 2022 & 2032F |
3.8 Netherlands Bio-Based Platform Chemicals Market Revenues & Volume Share, By Source, 2022 & 2032F |
3.9 Netherlands Bio-Based Platform Chemicals Market Revenues & Volume Share, By Sustainability Factor, 2022 & 2032F |
4 Netherlands Bio-Based Platform Chemicals Market Dynamics |
4.1 Impact Analysis |
4.2 Market Drivers |
4.2.1 Increasing demand for sustainable and eco-friendly products |
4.2.2 Government initiatives promoting the use of bio-based chemicals |
4.2.3 Growing awareness about the environmental benefits of bio-based platform chemicals |
4.3 Market Restraints |
4.3.1 High production costs compared to conventional chemicals |
4.3.2 Lack of infrastructure for large-scale production and distribution of bio-based chemicals |
4.3.3 Limited availability and variability of feedstock for bio-based chemicals |
5 Netherlands Bio-Based Platform Chemicals Market Trends |
6 Netherlands Bio-Based Platform Chemicals Market, By Types |
6.1 Netherlands Bio-Based Platform Chemicals Market, By Chemical Type |
6.1.1 Overview and Analysis |
6.1.2 Netherlands Bio-Based Platform Chemicals Market Revenues & Volume, By Chemical Type, 2022 - 2032F |
6.1.3 Netherlands Bio-Based Platform Chemicals Market Revenues & Volume, By Bio-Glycerol, 2022 - 2032F |
6.1.4 Netherlands Bio-Based Platform Chemicals Market Revenues & Volume, By Bio-Succinic Acid, 2022 - 2032F |
6.1.5 Netherlands Bio-Based Platform Chemicals Market Revenues & Volume, By Bio-Itaconic Acid, 2022 - 2032F |
6.2 Netherlands Bio-Based Platform Chemicals Market, By Application |
6.2.1 Overview and Analysis |
6.2.2 Netherlands Bio-Based Platform Chemicals Market Revenues & Volume, By Pharmaceuticals, 2022 - 2032F |
6.2.3 Netherlands Bio-Based Platform Chemicals Market Revenues & Volume, By Polymers, 2022 - 2032F |
6.2.4 Netherlands Bio-Based Platform Chemicals Market Revenues & Volume, By Coatings, 2022 - 2032F |
6.3 Netherlands Bio-Based Platform Chemicals Market, By End User |
6.3.1 Overview and Analysis |
6.3.2 Netherlands Bio-Based Platform Chemicals Market Revenues & Volume, By Healthcare, 2022 - 2032F |
6.3.3 Netherlands Bio-Based Platform Chemicals Market Revenues & Volume, By Automotive, 2022 - 2032F |
6.3.4 Netherlands Bio-Based Platform Chemicals Market Revenues & Volume, By Construction, 2022 - 2032F |
6.4 Netherlands Bio-Based Platform Chemicals Market, By Source |
6.4.1 Overview and Analysis |
6.4.2 Netherlands Bio-Based Platform Chemicals Market Revenues & Volume, By Biomass, 2022 - 2032F |
6.4.3 Netherlands Bio-Based Platform Chemicals Market Revenues & Volume, By Plant-Based, 2022 - 2032F |
6.4.4 Netherlands Bio-Based Platform Chemicals Market Revenues & Volume, By Sugar-Based, 2022 - 2032F |
6.5 Netherlands Bio-Based Platform Chemicals Market, By Sustainability Factor |
6.5.1 Overview and Analysis |
6.5.2 Netherlands Bio-Based Platform Chemicals Market Revenues & Volume, By Renewable, 2022 - 2032F |
6.5.3 Netherlands Bio-Based Platform Chemicals Market Revenues & Volume, By Eco-Friendly, 2022 - 2032F |
6.5.4 Netherlands Bio-Based Platform Chemicals Market Revenues & Volume, By Non-Toxic, 2022 - 2032F |
7 Netherlands Bio-Based Platform Chemicals Market Import-Export Trade Statistics |
7.1 Netherlands Bio-Based Platform Chemicals Market Export to Major Countries |
7.2 Netherlands Bio-Based Platform Chemicals Market Imports from Major Countries |
8 Netherlands Bio-Based Platform Chemicals Market Key Performance Indicators |
8.1 Percentage of bio-based chemicals in the overall chemical market |
8.2 Investment in research and development for bio-based platform chemicals |
8.3 Number of partnerships between companies for the development and commercialization of bio-based chemicals |
8.4 Carbon footprint reduction achieved by the adoption of bio-based platform chemicals |
8.5 Number of patents filed for new bio-based chemical technologies |
9 Netherlands Bio-Based Platform Chemicals Market - Opportunity Assessment |
9.1 Netherlands Bio-Based Platform Chemicals Market Opportunity Assessment, By Chemical Type, 2022 & 2032F |
9.2 Netherlands Bio-Based Platform Chemicals Market Opportunity Assessment, By Application, 2022 & 2032F |
9.3 Netherlands Bio-Based Platform Chemicals Market Opportunity Assessment, By End User, 2022 & 2032F |
9.4 Netherlands Bio-Based Platform Chemicals Market Opportunity Assessment, By Source, 2022 & 2032F |
9.5 Netherlands Bio-Based Platform Chemicals Market Opportunity Assessment, By Sustainability Factor, 2022 & 2032F |
10 Netherlands Bio-Based Platform Chemicals Market - Competitive Landscape |
10.1 Netherlands Bio-Based Platform Chemicals Market Revenue Share, By Companies, 2025 |
10.2 Netherlands Bio-Based Platform Chemicals Market Competitive Benchmarking, By Operating and Technical Parameters |
11 Company Profiles |
12 Recommendations |
13 Disclaimer |
Global Go To Market Strategy - 2030
Export potential enables firms to identify high-growth global markets with greater confidence by combining advanced trade intelligence with a structured quantitative methodology. The framework analyzes emerging demand trends and country-level import patterns while integrating macroeconomic and trade datasets such as GDP and population forecasts, bilateral import–export flows, tariff structures, elasticity differentials between developed and developing economies, geographic distance, and import demand projections. Using weighted trade values from 2020–2024 as the base period to project country-to-country export potential for 2030, these inputs are operationalized through calculated drivers such as gravity model parameters, tariff impact factors, and projected GDP per-capita growth. Through an analysis of hidden potentials, demand hotspots, and market conditions that are most favorable to success, this method enables firms to focus on target countries, maximize returns, and global expansion with data, backed by accuracy.
By factoring in the projected importer demand gap that is currently unmet and could be potential opportunity, it identifies the potential for the Exporter (Country) among 190 countries, against the general trade analysis, which identifies the biggest importer or exporter.
To discover high-growth global markets and optimize your business strategy:
Click Here
Pricing
- Single User License$ 1,995
- Department License$ 2,400
- Site License$ 3,120
- Global License$ 3,795

Leadership Perspectives from Industry Events
Search
Thought Leadership and Analyst Meet


Our Clients
6WResearch In News
- Doha a strategic location for EV manufacturing hub: IPA Qatar
- Demand for luxury TVs surging in the GCC, says Samsung
- Empowering Growth: The Thriving Journey of Bangladesh’s Cable Industry
- Demand for luxury TVs surging in the GCC, says Samsung
- Video call with a traditional healer? Once unthinkable, it’s now common in South Africa
- Intelligent Buildings To Smooth GCC’s Path To Net Zero
Latest Reports
- Taiwan Airport Wireless Infrastructure Market (2026-2032)
- Vietnam Airport Wireless Infrastructure Market (2026-2032)
- Thailand Airport Wireless Infrastructure Market (2026-2032)
- South Korea Airport Wireless Infrastructure Market (2026-2032)
- Romania Airport Wireless Infrastructure Market (2026-2032)
- Qatar Airport Wireless Infrastructure Market (2026-2032)
- Philippines Airport Wireless Infrastructure Market (2026-2032)
- Japan Airport Wireless Infrastructure Market (2026-2032)
- Taiwan Airport Winter Services Market (2026-2032)
- Vietnam Airport Winter Services Market (2026-2032)
Industry Events and Analyst Meet

HIMTEX 2026

India Refining Summit 2026

India EV Show 2026

EV tech India Expo 2026

Auto Tech Asia 2026
Whitepaper
- Middle East & Africa Commercial Security Market Click here to view more.
- Middle East & Africa Fire Safety Systems & Equipment Market Click here to view more.
- GCC Drone Market Click here to view more.
- Middle East Lighting Fixture Market Click here to view more.
- GCC Physical & Perimeter Security Market Click here to view more.