Netherlands Chloroform Market (2026-2032) | Share, Companies, Size, Value, Forecast, Revenue, Trends, Industry, Analysis, Growth, Segmentation & Outlook
Market Forecast By Grade (Technical Grade, Alcohol Stabilized Grade, Fluorocarbon Grade), By Application (Solvent, Intermediates, Reagent, Others), By End-users (Pharmaceutical, Agrochemical, Chemical Industry, Others) And Competitive Landscape
| Product Code: ETC4733946 | Publication Date: Nov 2023 | Updated Date: Apr 2026 | Product Type: Market Research Report | |
| Publisher: 6Wresearch | Author: Shubham Deep | No. of Pages: 60 | No. of Figures: 30 | No. of Tables: 5 |
Netherlands Chloroform Market Size (2020-2030)
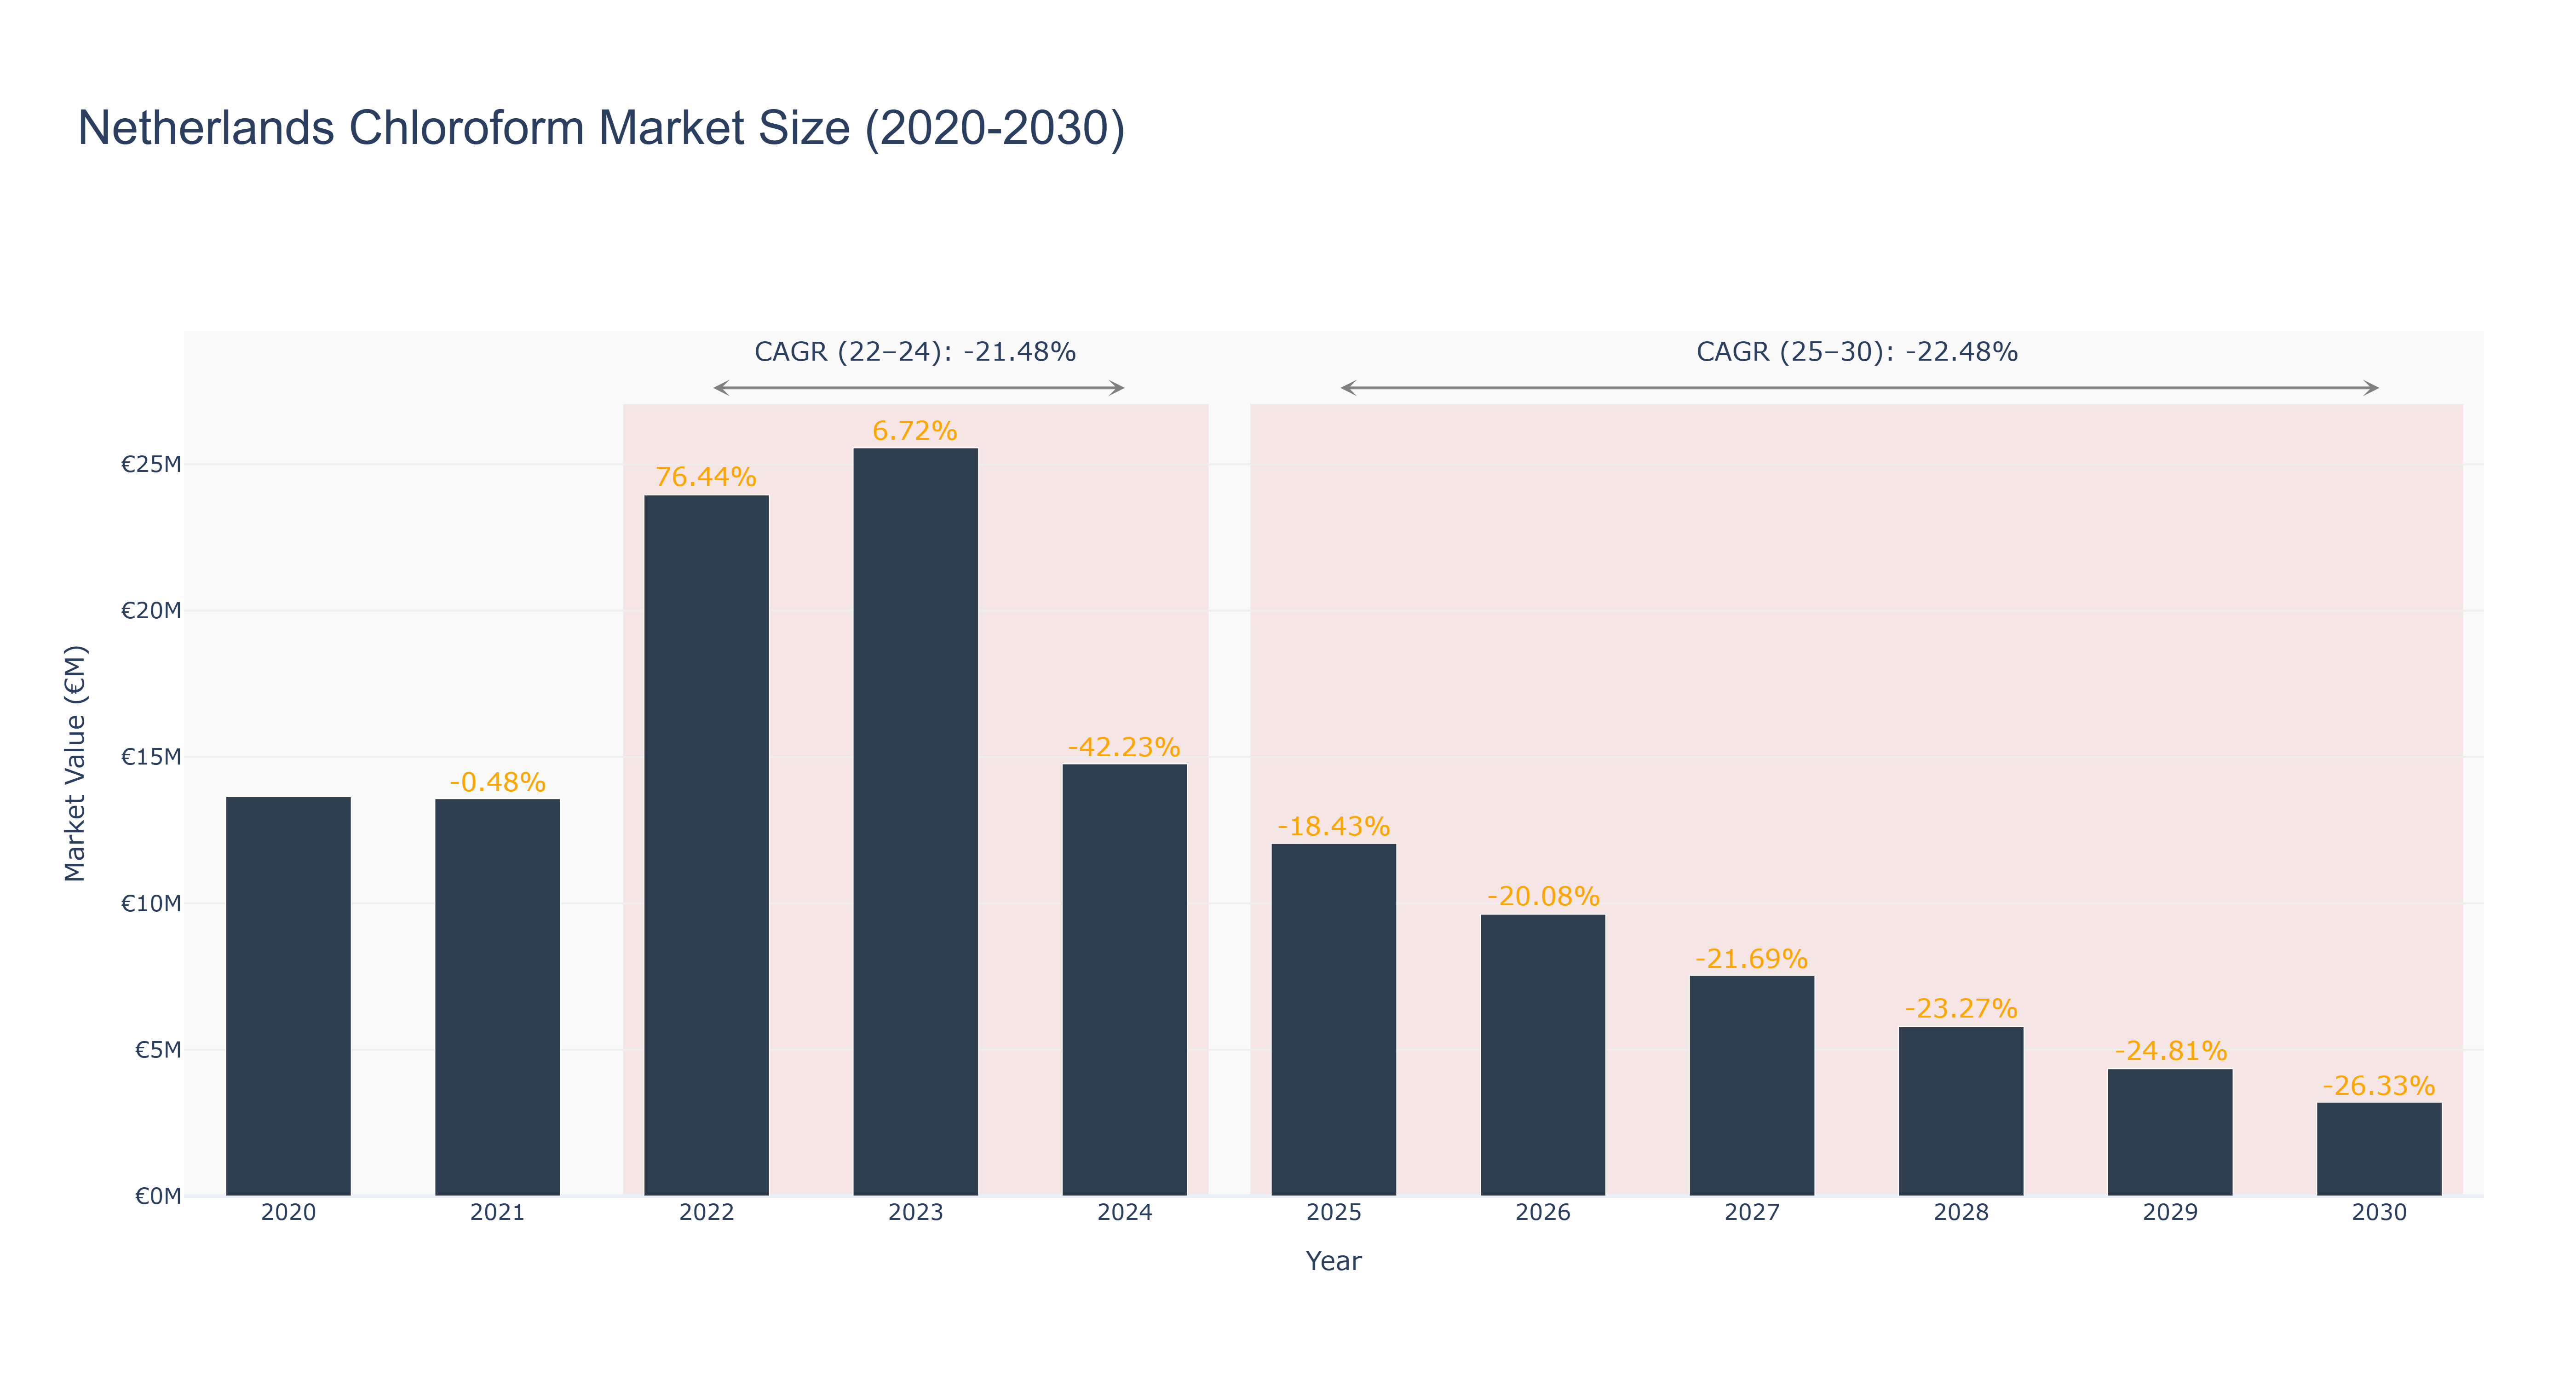
Netherlands Chloroform Market has experienced a notable decline in market size over the past decade. The peak market size of €25.56 million was observed in 2023, followed by a sharp decrease to €12.05 million in 2025. The market is forecasted to further contract to €3.20 million by 2030, with a CAGR of -22.48% from 2025 to 2030. The downturn can be attributed to factors such as regulatory restrictions on chloroform usage due to environmental concerns and the shift towards more sustainable alternatives in the chemical industry. However, recent developments indicate a growing interest in bio-based solvents in the Netherlands, signaling a potential shift towards eco-friendly solutions in the chloroform market. This transition aligns with the industry drivers of sustainability and regulatory compliance, driving innovation and market evolution in the coming years.
Netherlands Chloroform Market: Production & Trade Performance (2019-2025)
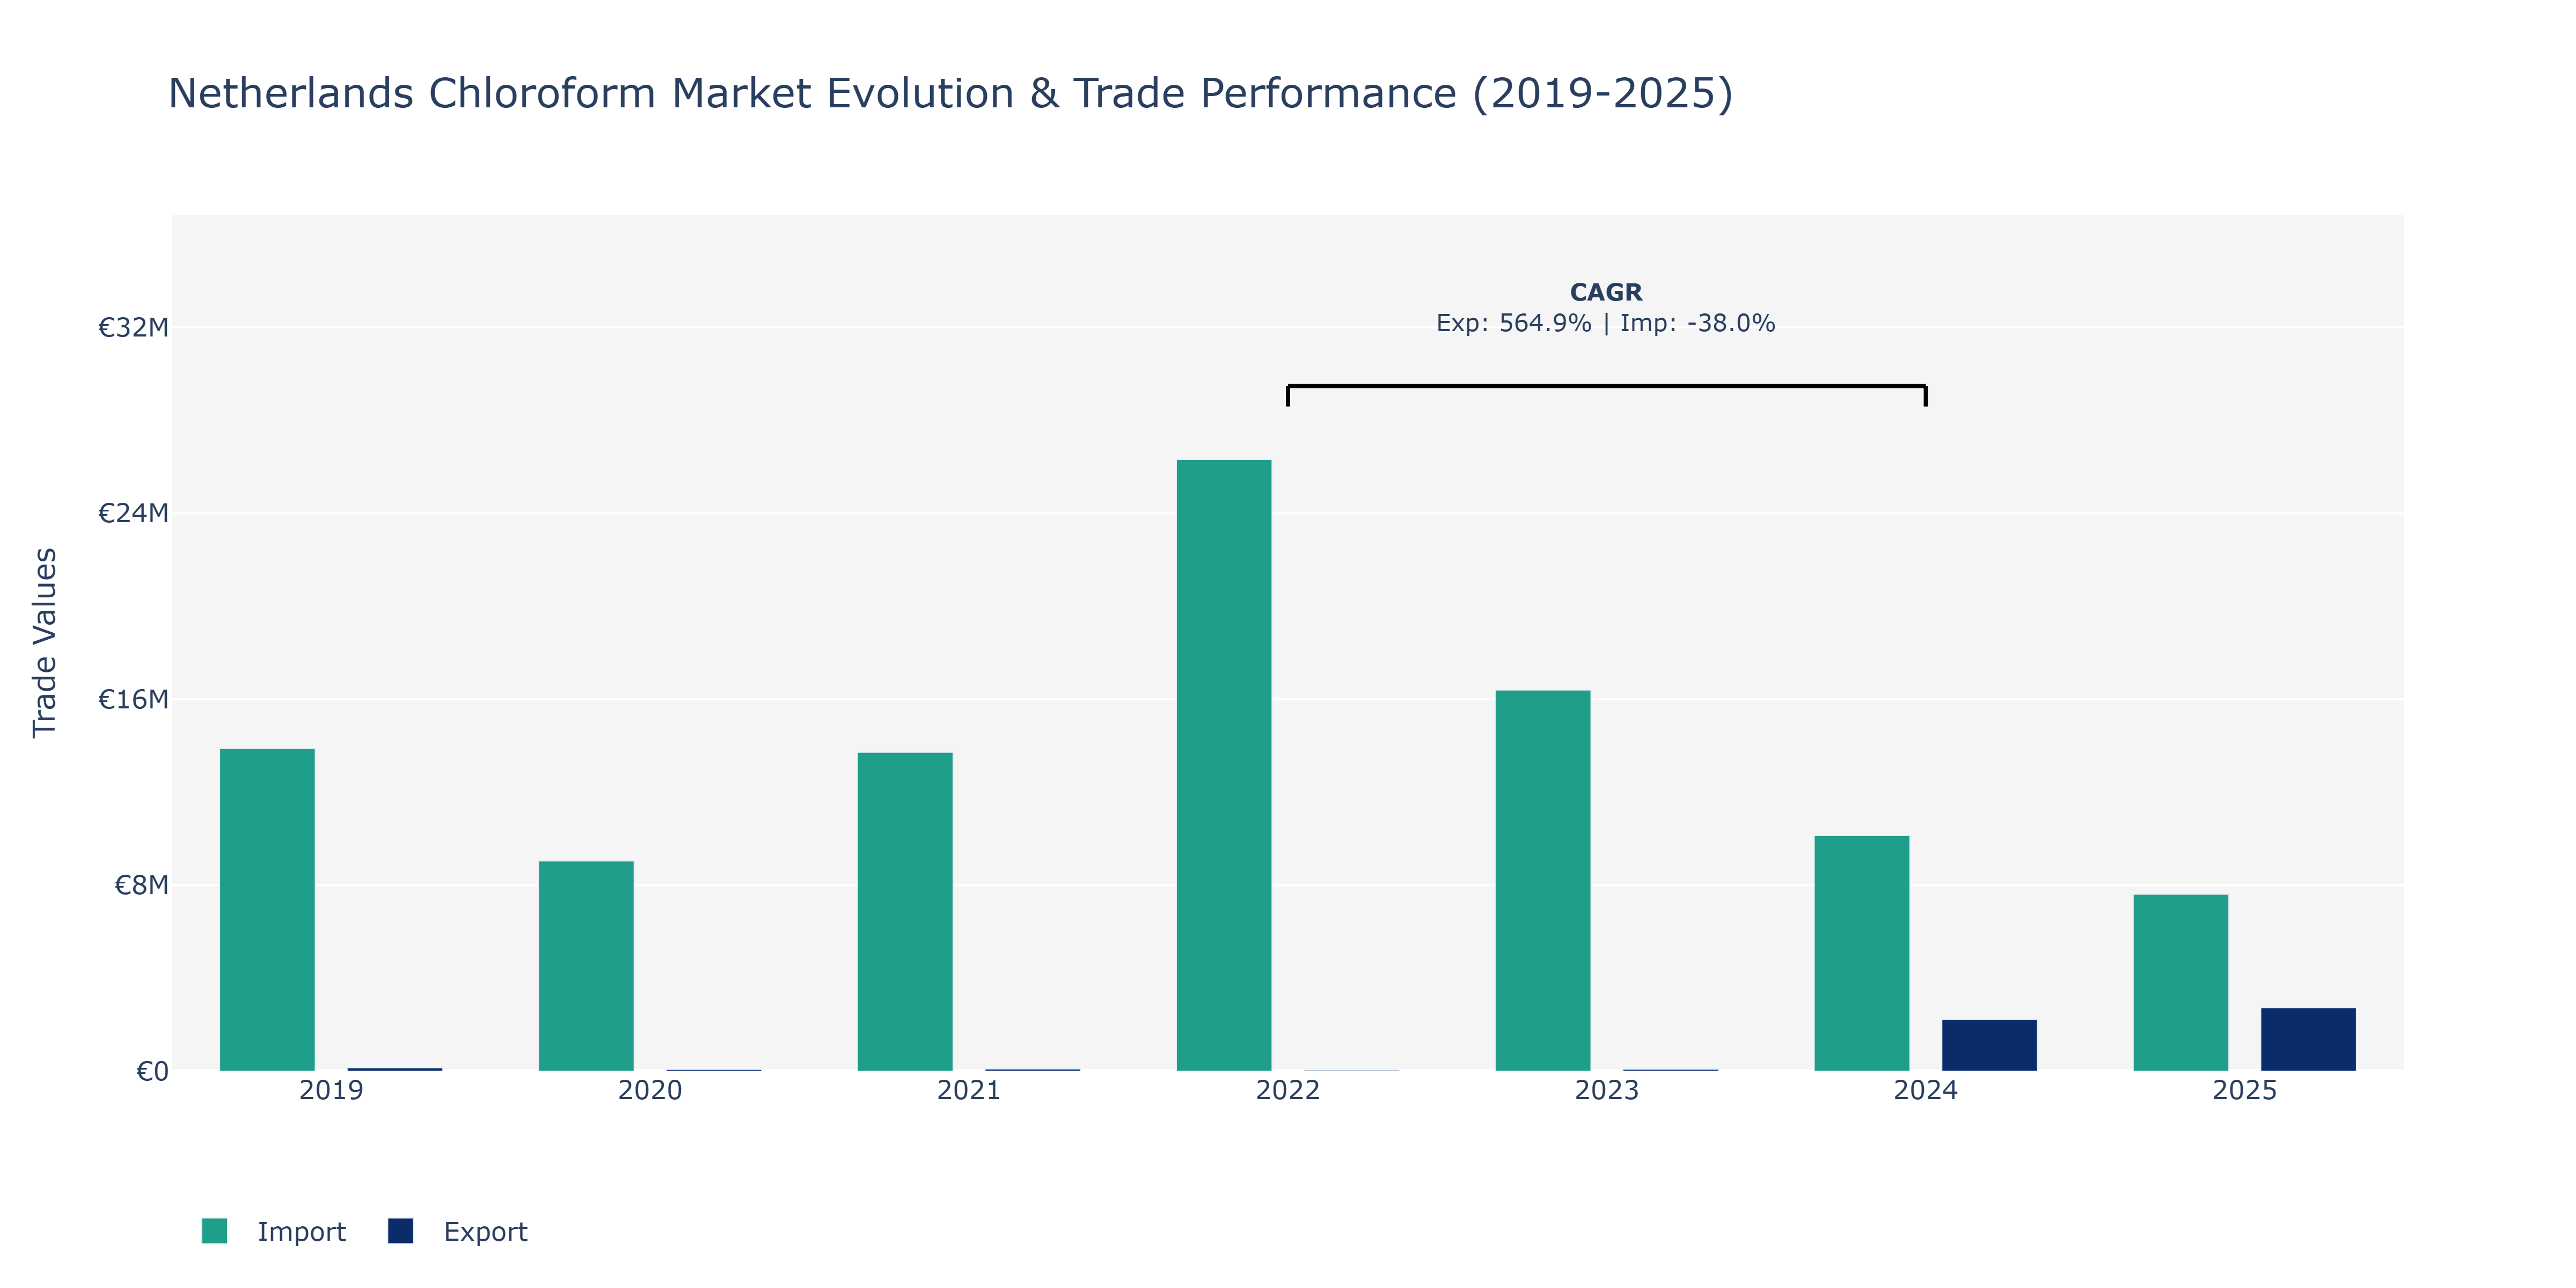
In the Netherlands Chloroform Market, exports experienced fluctuations over the years. In 2019, exports were at €150.15 thousand, dropping notably in 2020 to €76.78 thousand, before gradually recovering in 2021 to €96.81 thousand. A significant surge was observed in 2024, reaching €2.22 million, indicating a remarkable peak point. This growth can be attributed to increased demand for chloroform in various industries, such as pharmaceuticals and chemical manufacturing, possibly due to advancements in production processes and applications. In contrast, imports followed a different trajectory. Starting at €13.88 million in 2019, there was a sharp decrease in 2020 to €9.05 million. However, imports rebounded by 2023 to €16.4 million, indicating a fluctuating pattern. The decline in 2022 to €26.32 million can be attributed to potential shifts in supply chains or changes in trading partners affecting import volumes. This underscores the market's sensitivity to global economic conditions and trade dynamics, emphasizing the need for strategic planning and adaptation to market changes.
Key Highlights of the Report:
- Netherlands Chloroform Market Outlook
- Market Size of Netherlands Chloroform Market, 2025
- Forecast of Netherlands Chloroform Market, 2032
- Historical Data and Forecast of Netherlands Chloroform Revenues & Volume for the Period 2022 - 2032F
- Netherlands Chloroform Market Trend Evolution
- Netherlands Chloroform Market Drivers and Challenges
- Netherlands Chloroform Price Trends
- Netherlands Chloroform Porter`s Five Forces
- Netherlands Chloroform Industry Life Cycle
- Historical Data and Forecast of Netherlands Chloroform Market Revenues & Volume By Grade for the Period 2022 - 2032F
- Historical Data and Forecast of Netherlands Chloroform Market Revenues & Volume By Technical Grade for the Period 2022 - 2032F
- Historical Data and Forecast of Netherlands Chloroform Market Revenues & Volume By Alcohol Stabilized Grade for the Period 2022 - 2032F
- Historical Data and Forecast of Netherlands Chloroform Market Revenues & Volume By Fluorocarbon Grade for the Period 2022 - 2032F
- Historical Data and Forecast of Netherlands Chloroform Market Revenues & Volume By Application for the Period 2022 - 2032F
- Historical Data and Forecast of Netherlands Chloroform Market Revenues & Volume By Solvent for the Period 2022 - 2032F
- Historical Data and Forecast of Netherlands Chloroform Market Revenues & Volume By Intermediates for the Period 2022 - 2032F
- Historical Data and Forecast of Netherlands Chloroform Market Revenues & Volume By Reagent for the Period 2022 - 2032F
- Historical Data and Forecast of Netherlands Chloroform Market Revenues & Volume By Others for the Period 2022 - 2032F
- Historical Data and Forecast of Netherlands Chloroform Market Revenues & Volume By End-users for the Period 2022 - 2032F
- Historical Data and Forecast of Netherlands Chloroform Market Revenues & Volume By Pharmaceutical for the Period 2022 - 2032F
- Historical Data and Forecast of Netherlands Chloroform Market Revenues & Volume By Agrochemical for the Period 2022 - 2032F
- Historical Data and Forecast of Netherlands Chloroform Market Revenues & Volume By Chemical Industry for the Period 2022 - 2032F
- Historical Data and Forecast of Netherlands Chloroform Market Revenues & Volume By Others for the Period 2022 - 2032F
- Netherlands Chloroform Import Export Trade Statistics
- Market Opportunity Assessment By Grade
- Market Opportunity Assessment By Application
- Market Opportunity Assessment By End-users
- Netherlands Chloroform Top Companies Market Share
- Netherlands Chloroform Competitive Benchmarking By Technical and Operational Parameters
- Netherlands Chloroform Company Profiles
- Netherlands Chloroform Key Strategic Recommendations
Frequently Asked Questions About the Market Study (FAQs):
6Wresearch actively monitors the Netherlands Chloroform Market and publishes its comprehensive annual report, highlighting emerging trends, growth drivers, revenue analysis, and forecast outlook. Our insights help businesses to make data-backed strategic decisions with ongoing market dynamics. Our analysts track relevent industries related to the Netherlands Chloroform Market, allowing our clients with actionable intelligence and reliable forecasts tailored to emerging regional needs.
Yes, we provide customisation as per your requirements. To learn more, feel free to contact us on sales@6wresearch.com
1 Executive Summary |
2 Introduction |
2.1 Key Highlights of the Report |
2.2 Report Description |
2.3 Market Scope & Segmentation |
2.4 Research Methodology |
2.5 Assumptions |
3 Netherlands Chloroform Market Overview |
3.1 Netherlands Country Macro Economic Indicators |
3.2 Netherlands Chloroform Market Revenues & Volume, 2022 & 2032F |
3.3 Netherlands Chloroform Market - Industry Life Cycle |
3.4 Netherlands Chloroform Market - Porter's Five Forces |
3.5 Netherlands Chloroform Market Revenues & Volume Share, By Grade, 2022 & 2032F |
3.6 Netherlands Chloroform Market Revenues & Volume Share, By Application, 2022 & 2032F |
3.7 Netherlands Chloroform Market Revenues & Volume Share, By End-users, 2022 & 2032F |
4 Netherlands Chloroform Market Dynamics |
4.1 Impact Analysis |
4.2 Market Drivers |
4.2.1 Increasing demand for chloroform in pharmaceutical and chemical industries in the Netherlands |
4.2.2 Growing awareness about the benefits of using chloroform in various applications |
4.2.3 Technological advancements leading to improved production processes and quality of chloroform |
4.3 Market Restraints |
4.3.1 Stringent regulations and environmental concerns regarding the use of chloroform |
4.3.2 Volatility in raw material prices affecting the production cost of chloroform |
4.3.3 Competition from alternative products impacting the market share of chloroform |
5 Netherlands Chloroform Market Trends |
6 Netherlands Chloroform Market Segmentations |
6.1 Netherlands Chloroform Market, By Grade |
6.1.1 Overview and Analysis |
6.1.2 Netherlands Chloroform Market Revenues & Volume, By Technical Grade, 2022 - 2032F |
6.1.3 Netherlands Chloroform Market Revenues & Volume, By Alcohol Stabilized Grade, 2022 - 2032F |
6.1.4 Netherlands Chloroform Market Revenues & Volume, By Fluorocarbon Grade, 2022 - 2032F |
6.2 Netherlands Chloroform Market, By Application |
6.2.1 Overview and Analysis |
6.2.2 Netherlands Chloroform Market Revenues & Volume, By Solvent, 2022 - 2032F |
6.2.3 Netherlands Chloroform Market Revenues & Volume, By Intermediates, 2022 - 2032F |
6.2.4 Netherlands Chloroform Market Revenues & Volume, By Reagent, 2022 - 2032F |
6.2.5 Netherlands Chloroform Market Revenues & Volume, By Others, 2022 - 2032F |
6.3 Netherlands Chloroform Market, By End-users |
6.3.1 Overview and Analysis |
6.3.2 Netherlands Chloroform Market Revenues & Volume, By Pharmaceutical, 2022 - 2032F |
6.3.3 Netherlands Chloroform Market Revenues & Volume, By Agrochemical, 2022 - 2032F |
6.3.4 Netherlands Chloroform Market Revenues & Volume, By Chemical Industry, 2022 - 2032F |
6.3.5 Netherlands Chloroform Market Revenues & Volume, By Others, 2022 - 2032F |
7 Netherlands Chloroform Market Import-Export Trade Statistics |
7.1 Netherlands Chloroform Market Export to Major Countries |
7.2 Netherlands Chloroform Market Imports from Major Countries |
8 Netherlands Chloroform Market Key Performance Indicators |
8.1 Research and development investment in chloroform technology and applications |
8.2 Environmental compliance metrics related to chloroform production and usage |
8.3 Innovation and patents filed in the field of chloroform applications |
9 Netherlands Chloroform Market - Opportunity Assessment |
9.1 Netherlands Chloroform Market Opportunity Assessment, By Grade, 2022 & 2032F |
9.2 Netherlands Chloroform Market Opportunity Assessment, By Application, 2022 & 2032F |
9.3 Netherlands Chloroform Market Opportunity Assessment, By End-users, 2022 & 2032F |
10 Netherlands Chloroform Market - Competitive Landscape |
10.1 Netherlands Chloroform Market Revenue Share, By Companies, 2025 |
10.2 Netherlands Chloroform Market Competitive Benchmarking, By Operating and Technical Parameters |
11 Company Profiles |
12 Recommendations | 13 Disclaimer |
Global Go To Market Strategy - 2030
Export potential enables firms to identify high-growth global markets with greater confidence by combining advanced trade intelligence with a structured quantitative methodology. The framework analyzes emerging demand trends and country-level import patterns while integrating macroeconomic and trade datasets such as GDP and population forecasts, bilateral import–export flows, tariff structures, elasticity differentials between developed and developing economies, geographic distance, and import demand projections. Using weighted trade values from 2020–2024 as the base period to project country-to-country export potential for 2030, these inputs are operationalized through calculated drivers such as gravity model parameters, tariff impact factors, and projected GDP per-capita growth. Through an analysis of hidden potentials, demand hotspots, and market conditions that are most favorable to success, this method enables firms to focus on target countries, maximize returns, and global expansion with data, backed by accuracy.
By factoring in the projected importer demand gap that is currently unmet and could be potential opportunity, it identifies the potential for the Exporter (Country) among 190 countries, against the general trade analysis, which identifies the biggest importer or exporter.
To discover high-growth global markets and optimize your business strategy:
Click Here
Pricing
- Single User License$ 1,995
- Department License$ 2,400
- Site License$ 3,120
- Global License$ 3,795

Leadership Perspectives from Industry Events
Search
Thought Leadership and Analyst Meet


Our Clients
6WResearch In News
- Doha a strategic location for EV manufacturing hub: IPA Qatar
- Demand for luxury TVs surging in the GCC, says Samsung
- Empowering Growth: The Thriving Journey of Bangladesh’s Cable Industry
- Demand for luxury TVs surging in the GCC, says Samsung
- Video call with a traditional healer? Once unthinkable, it’s now common in South Africa
- Intelligent Buildings To Smooth GCC’s Path To Net Zero
Latest Reports
- Taiwan Airport Wireless Infrastructure Market (2026-2032)
- Vietnam Airport Wireless Infrastructure Market (2026-2032)
- Thailand Airport Wireless Infrastructure Market (2026-2032)
- South Korea Airport Wireless Infrastructure Market (2026-2032)
- Romania Airport Wireless Infrastructure Market (2026-2032)
- Qatar Airport Wireless Infrastructure Market (2026-2032)
- Philippines Airport Wireless Infrastructure Market (2026-2032)
- Japan Airport Wireless Infrastructure Market (2026-2032)
- Taiwan Airport Winter Services Market (2026-2032)
- Vietnam Airport Winter Services Market (2026-2032)
Industry Events and Analyst Meet

HIMTEX 2026

India Refining Summit 2026

India EV Show 2026

EV tech India Expo 2026

Auto Tech Asia 2026
Whitepaper
- Middle East & Africa Commercial Security Market Click here to view more.
- Middle East & Africa Fire Safety Systems & Equipment Market Click here to view more.
- GCC Drone Market Click here to view more.
- Middle East Lighting Fixture Market Click here to view more.
- GCC Physical & Perimeter Security Market Click here to view more.