Netherlands Dicyandiamide Market (2026-2032) | Outlook, Segmentation, Revenue, Industry, Value, Size, Share, Companies, Trends, Forecast, Growth & Analysis
Market Forecast By Grade (Electronic grade, Industrial grade, Pharmaceutical grade), By Application (Pharmaceuticals, Epoxy laminates, Textile & dyeing auxiliaries, Water treatment, Flame retardants, Fertilizers, Others) And Competitive Landscape
| Product Code: ETC4760812 | Publication Date: Nov 2023 | Updated Date: Apr 2026 | Product Type: Market Research Report | |
| Publisher: 6Wresearch | Author: Sachin Kumar Rai | No. of Pages: 60 | No. of Figures: 30 | No. of Tables: 5 |
Netherlands Dicyandiamide Market Size (2020-2030)
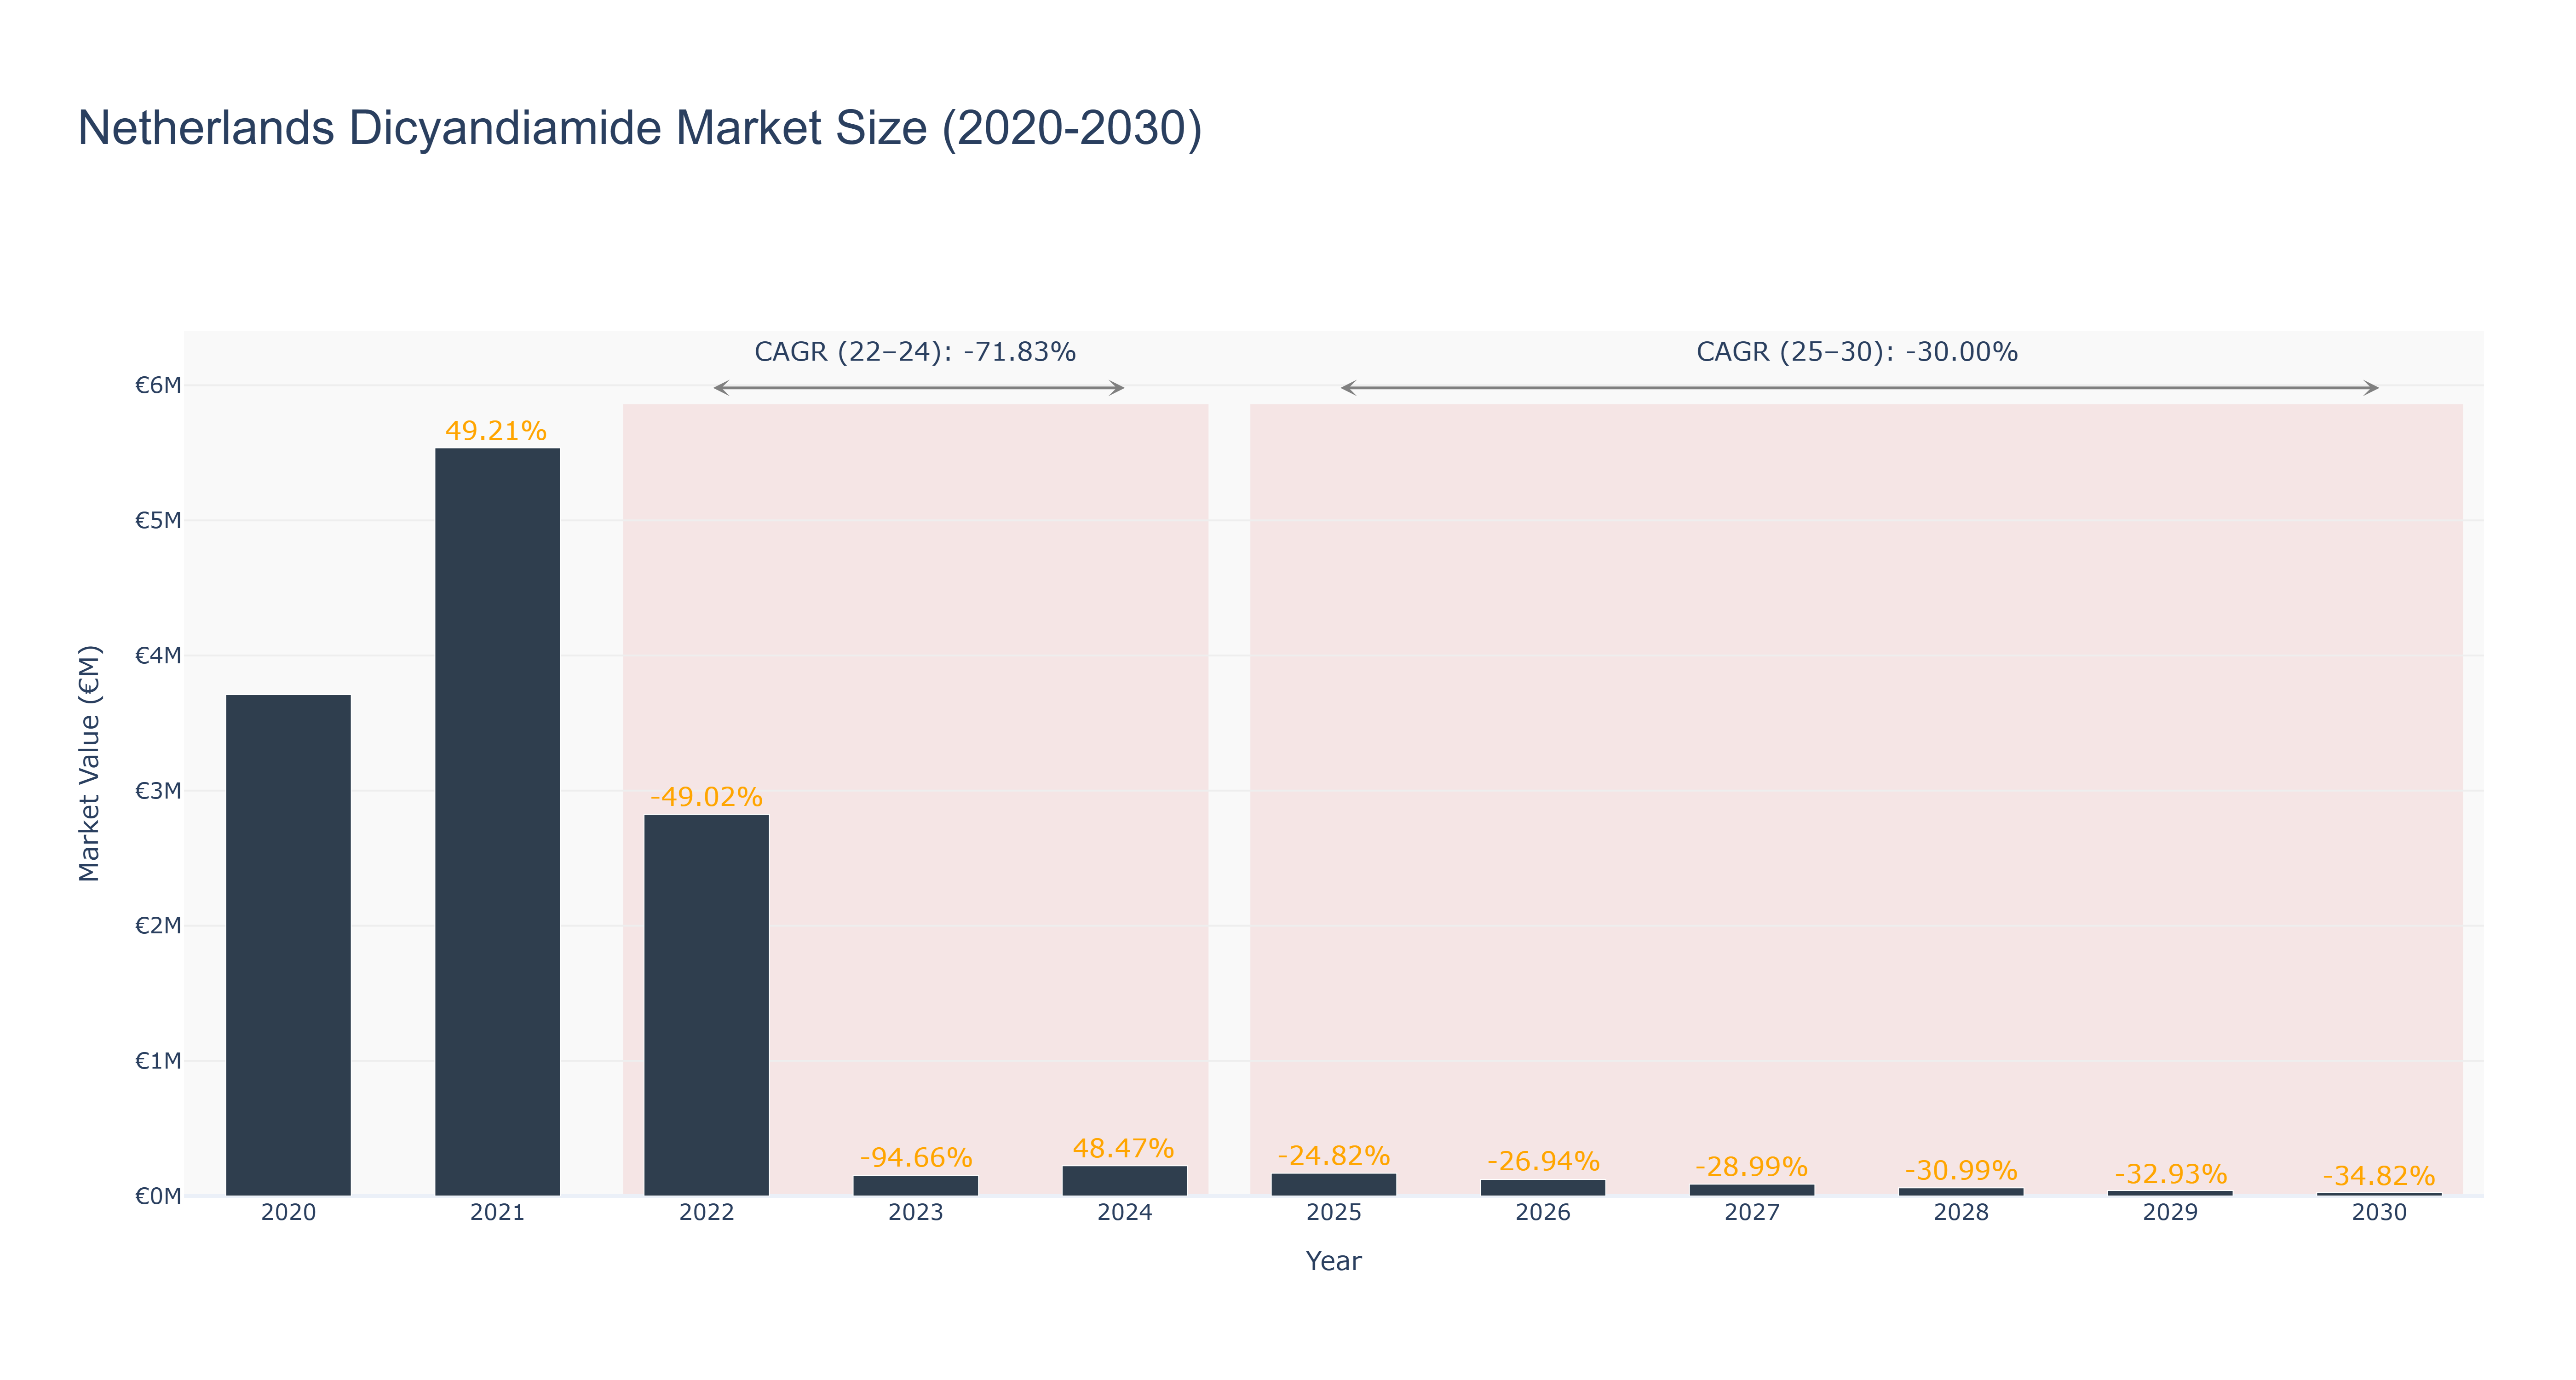
The Netherlands Dicyandiamide Market experienced a peak market size of €5.54 million in 2021, followed by a significant decline to €0.22 million in 2024. The market is forecasted to continue shrinking, with a projected size of €0.03 million in 2030. The CAGR for the period 2022-24 was -71.83%, reflecting a steep downturn, while the CAGR for 2025-30 is expected to be -30.0%. This downward trend can be attributed to various factors such as changing consumer preferences, regulatory challenges, and global economic conditions impacting demand. Despite the current challenges, upcoming initiatives in sustainable production methods and technology advancements are expected to drive growth in the Netherlands Dicyandiamide Market in the near future. Industry drivers include environmental sustainability goals, innovation in manufacturing processes, and increasing focus on product quality and efficiency.
Netherlands Dicyandiamide Market: Production & Trade Performance (2019-2025)
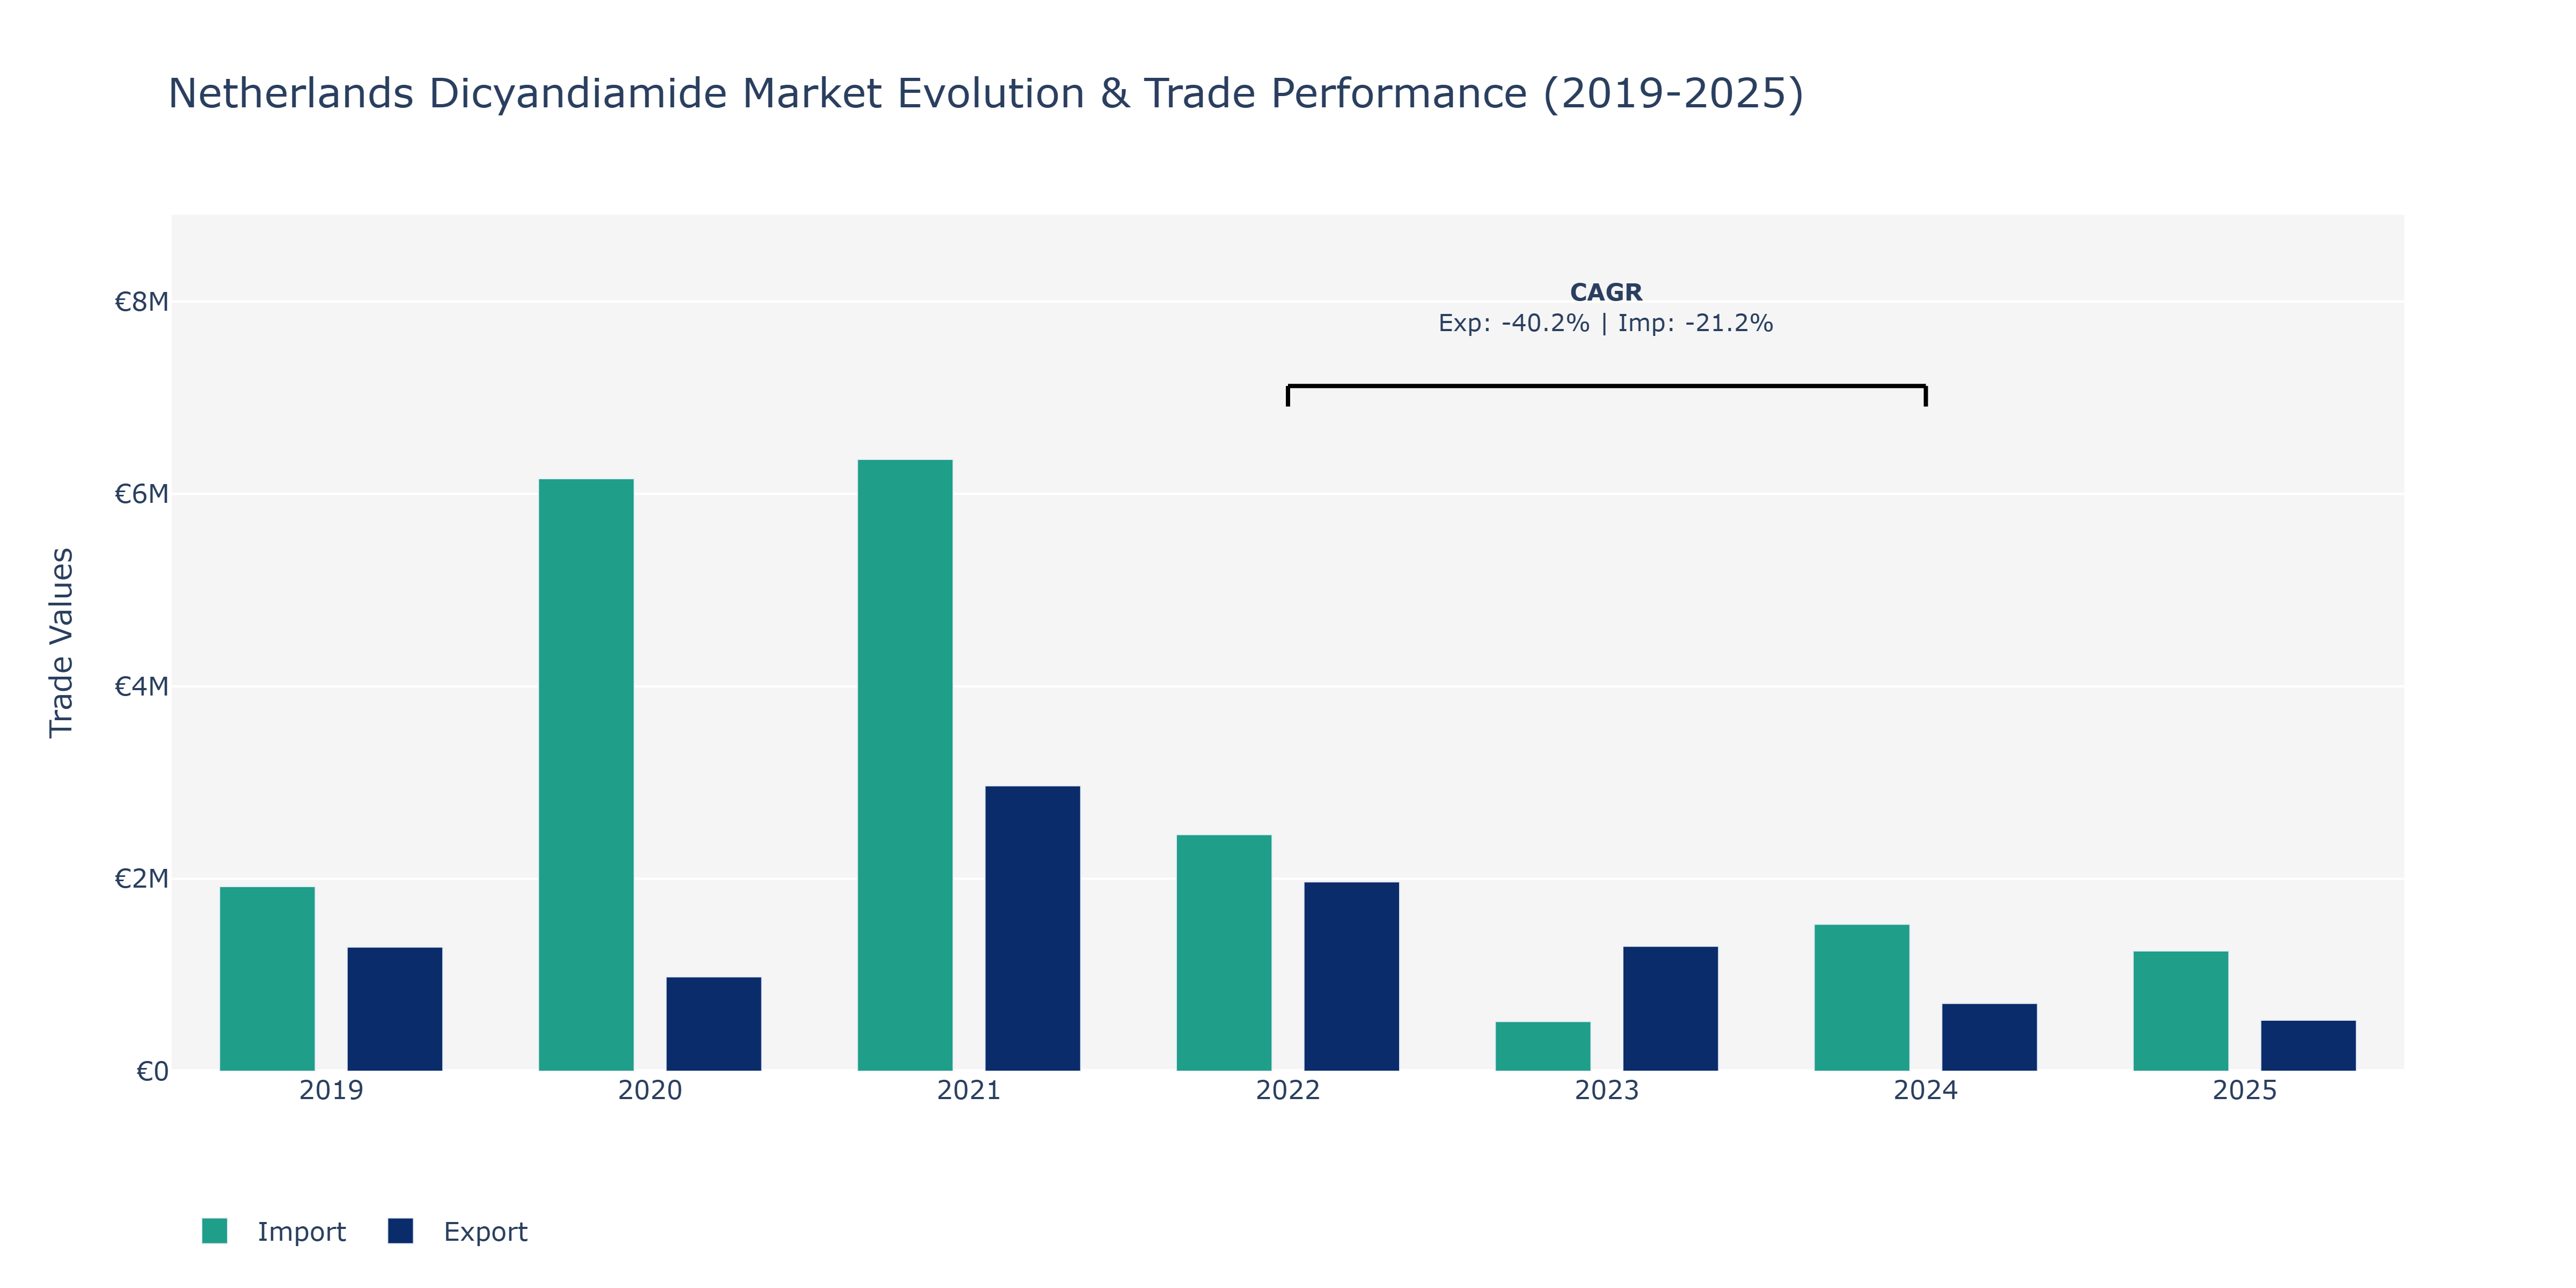
The Netherlands Dicyandiamide Market witnessed fluctuations in both exports and imports over the specified years. In 2019, exports stood at €1.29 million, decreasing notably to €980.24 thousand in 2020 before rebounding to €2.97 million in 2021, marking a significant peak. The trend reversed in 2022 and 2023 with values of €1.97 million and €1.3 million, respectively, declining each year. By 2024, exports further decreased to €704.36 thousand. Similarly, Import value followed a different trajectory, starting at €1.92 million in 2019, increasing substantially to €6.16 million in 2020, and then maintaining a relatively stable level around €2.45 million in 2022 and €1.53 million in 2024. The noticeable decline in imports in 2025 to approximately €1.25 million may indicate changing market dynamics or domestic production capabilities affecting import demands. These fluctuations could be attributed to various factors such as shifts in global demand, regulatory changes impacting trade, or evolving competitive landscapes affecting trade flows in the dicyandiamide market in the Netherlands.
Key Highlights of the Report:
- Netherlands Dicyandiamide Market Outlook
- Market Size of Netherlands Dicyandiamide Market, 2025
- Forecast of Netherlands Dicyandiamide Market, 2032
- Historical Data and Forecast of Netherlands Dicyandiamide Revenues & Volume for the Period 2022 - 2032F
- Netherlands Dicyandiamide Market Trend Evolution
- Netherlands Dicyandiamide Market Drivers and Challenges
- Netherlands Dicyandiamide Price Trends
- Netherlands Dicyandiamide Porter`s Five Forces
- Netherlands Dicyandiamide Industry Life Cycle
- Historical Data and Forecast of Netherlands Dicyandiamide Market Revenues & Volume By Grade for the Period 2022 - 2032F
- Historical Data and Forecast of Netherlands Dicyandiamide Market Revenues & Volume By Electronic grade for the Period 2022 - 2032F
- Historical Data and Forecast of Netherlands Dicyandiamide Market Revenues & Volume By Industrial grade for the Period 2022 - 2032F
- Historical Data and Forecast of Netherlands Dicyandiamide Market Revenues & Volume By Pharmaceutical grade for the Period 2022 - 2032F
- Historical Data and Forecast of Netherlands Dicyandiamide Market Revenues & Volume By Application for the Period 2022 - 2032F
- Historical Data and Forecast of Netherlands Dicyandiamide Market Revenues & Volume By Pharmaceuticals for the Period 2022 - 2032F
- Historical Data and Forecast of Netherlands Dicyandiamide Market Revenues & Volume By Epoxy laminates for the Period 2022 - 2032F
- Historical Data and Forecast of Netherlands Dicyandiamide Market Revenues & Volume By Textile & dyeing auxiliaries for the Period 2022 - 2032F
- Historical Data and Forecast of Netherlands Dicyandiamide Market Revenues & Volume By Water treatment for the Period 2022 - 2032F
- Historical Data and Forecast of Netherlands Dicyandiamide Market Revenues & Volume By Flame retardants for the Period 2022 - 2032F
- Historical Data and Forecast of Netherlands Dicyandiamide Market Revenues & Volume By Fertilizers for the Period 2022 - 2032F
- Historical Data and Forecast of Netherlands Dicyandiamide Market Revenues & Volume By Others for the Period 2022 - 2032F
- Netherlands Dicyandiamide Import Export Trade Statistics
- Market Opportunity Assessment By Grade
- Market Opportunity Assessment By Application
- Netherlands Dicyandiamide Top Companies Market Share
- Netherlands Dicyandiamide Competitive Benchmarking By Technical and Operational Parameters
- Netherlands Dicyandiamide Company Profiles
- Netherlands Dicyandiamide Key Strategic Recommendations
Frequently Asked Questions About the Market Study (FAQs):
6Wresearch actively monitors the Netherlands Dicyandiamide Market and publishes its comprehensive annual report, highlighting emerging trends, growth drivers, revenue analysis, and forecast outlook. Our insights help businesses to make data-backed strategic decisions with ongoing market dynamics. Our analysts track relevent industries related to the Netherlands Dicyandiamide Market, allowing our clients with actionable intelligence and reliable forecasts tailored to emerging regional needs.
Yes, we provide customisation as per your requirements. To learn more, feel free to contact us on sales@6wresearch.com
1 Executive Summary |
2 Introduction |
2.1 Key Highlights of the Report |
2.2 Report Description |
2.3 Market Scope & Segmentation |
2.4 Research Methodology |
2.5 Assumptions |
3 Netherlands Dicyandiamide Market Overview |
3.1 Netherlands Country Macro Economic Indicators |
3.2 Netherlands Dicyandiamide Market Revenues & Volume, 2022 & 2032F |
3.3 Netherlands Dicyandiamide Market - Industry Life Cycle |
3.4 Netherlands Dicyandiamide Market - Porter's Five Forces |
3.5 Netherlands Dicyandiamide Market Revenues & Volume Share, By Grade, 2022 & 2032F |
3.6 Netherlands Dicyandiamide Market Revenues & Volume Share, By Application, 2022 & 2032F |
4 Netherlands Dicyandiamide Market Dynamics |
4.1 Impact Analysis |
4.2 Market Drivers |
4.2.1 Increasing demand for dicyandiamide in the agriculture sector for soil treatment and crop protection. |
4.2.2 Growing awareness about the benefits of dicyandiamide in wastewater treatment applications. |
4.2.3 Favorable government regulations promoting the use of dicyandiamide in various industries. |
4.3 Market Restraints |
4.3.1 Volatility in raw material prices affecting the production cost of dicyandiamide. |
4.3.2 Environmental concerns related to the disposal of dicyandiamide waste products. |
4.3.3 Competition from alternative products impacting the market growth. |
5 Netherlands Dicyandiamide Market Trends |
6 Netherlands Dicyandiamide Market Segmentations |
6.1 Netherlands Dicyandiamide Market, By Grade |
6.1.1 Overview and Analysis |
6.1.2 Netherlands Dicyandiamide Market Revenues & Volume, By Electronic grade, 2022 - 2032F |
6.1.3 Netherlands Dicyandiamide Market Revenues & Volume, By Industrial grade, 2022 - 2032F |
6.1.4 Netherlands Dicyandiamide Market Revenues & Volume, By Pharmaceutical grade, 2022 - 2032F |
6.2 Netherlands Dicyandiamide Market, By Application |
6.2.1 Overview and Analysis |
6.2.2 Netherlands Dicyandiamide Market Revenues & Volume, By Pharmaceuticals, 2022 - 2032F |
6.2.3 Netherlands Dicyandiamide Market Revenues & Volume, By Epoxy laminates, 2022 - 2032F |
6.2.4 Netherlands Dicyandiamide Market Revenues & Volume, By Textile & dyeing auxiliaries, 2022 - 2032F |
6.2.5 Netherlands Dicyandiamide Market Revenues & Volume, By Water treatment, 2022 - 2032F |
6.2.6 Netherlands Dicyandiamide Market Revenues & Volume, By Flame retardants, 2022 - 2032F |
6.2.7 Netherlands Dicyandiamide Market Revenues & Volume, By Fertilizers, 2022 - 2032F |
7 Netherlands Dicyandiamide Market Import-Export Trade Statistics |
7.1 Netherlands Dicyandiamide Market Export to Major Countries |
7.2 Netherlands Dicyandiamide Market Imports from Major Countries |
8 Netherlands Dicyandiamide Market Key Performance Indicators |
8.1 Number of new product developments or innovations in the dicyandiamide market. |
8.2 Investment in research and development activities related to dicyandiamide applications. |
8.3 Adoption rate of dicyandiamide in key end-user industries such as agriculture and water treatment. |
8.4 Environmental impact assessments and sustainability initiatives related to dicyandiamide production and usage. |
9 Netherlands Dicyandiamide Market - Opportunity Assessment |
9.1 Netherlands Dicyandiamide Market Opportunity Assessment, By Grade, 2022 & 2032F |
9.2 Netherlands Dicyandiamide Market Opportunity Assessment, By Application, 2022 & 2032F |
10 Netherlands Dicyandiamide Market - Competitive Landscape |
10.1 Netherlands Dicyandiamide Market Revenue Share, By Companies, 2025 |
10.2 Netherlands Dicyandiamide Market Competitive Benchmarking, By Operating and Technical Parameters |
11 Company Profiles |
12 Recommendations | 13 Disclaimer |
Export potential assessment - trade Analytics for 2030
Export potential enables firms to identify high-growth global markets with greater confidence by combining advanced trade intelligence with a structured quantitative methodology. The framework analyzes emerging demand trends and country-level import patterns while integrating macroeconomic and trade datasets such as GDP and population forecasts, bilateral import–export flows, tariff structures, elasticity differentials between developed and developing economies, geographic distance, and import demand projections. Using weighted trade values from 2020–2024 as the base period to project country-to-country export potential for 2030, these inputs are operationalized through calculated drivers such as gravity model parameters, tariff impact factors, and projected GDP per-capita growth. Through an analysis of hidden potentials, demand hotspots, and market conditions that are most favorable to success, this method enables firms to focus on target countries, maximize returns, and global expansion with data, backed by accuracy.
By factoring in the projected importer demand gap that is currently unmet and could be potential opportunity, it identifies the potential for the Exporter (Country) among 190 countries, against the general trade analysis, which identifies the biggest importer or exporter.
To discover high-growth global markets and optimize your business strategy:
Click Here
Pricing
- Single User License$ 1,995
- Department License$ 2,400
- Site License$ 3,120
- Global License$ 3,795

Search
Thought Leadership and Analyst Meet


Our Clients
Latest Reports
- Canada Cloud CFD Market (2026-2032) | Size & Revenue, Industry, Growth, Competitive Landscape, Forecast, Segmentation, Value, Outlook, Trends, Share, Analysis, Companies
- Taiwan Food Delivery Platform Market (2026-2032) | Companies, Outlook, Analysis, Trends, Value, Revenue, Segmentation, Share, Forecast, Competitive Landscape, Growth, Size & Forecast
- United Kingdom (UK) Long-term Care Insurance Market (2026-2032) | Growth, Share, Consumer Insights, Drivers, Opportunities, Competition, Pricing Analysis, Segments, Restraints, Companies, Competitive, Value, Outlook, Size, Demand, Analysis, Challenges, Strategic Insights, Investment Trends, Revenue, Trends, Supply, Forecast
- United Kingdom (UK) Long Term Care Market (2026-2032) | Companies, Outlook, Analysis, Trends, Value, Revenue, Segmentation, Share, Forecast, Competitive Landscape, Growth, Size & Forecast
- Iraq Insulation and Waterproofing Market (2026-2032) | Outlook, Drivers, Growth, Size, Share, Industry, Revenue, Trends, Demand, Competitive, Strategic Insights, Opportunities, Segments, Companies, Challenges, Strategy, Consumer Insights, Analysis, Investment Trends, Value, Segmentation, Forecast, Restraints
- India Switchgear Market Outlook (2026-2032) | Size, Share, Trends, Growth, Revenue, Forecast, Analysis, Value, Outlook
- Pakistan Contraceptive Implants Market (2025-2031) | Demand, Growth, Size, Share, Industry, Pricing Analysis, Competitive, Strategic Insights, Strategy, Consumer Insights, Analysis, Investment Trends, Opportunities, Revenue, Segments, Value, Segmentation, Supply, Forecast, Restraints, Outlook, Competition, Drivers, Trends, Companies, Challenges
- Sri Lanka Packaging Market (2026-2032) | Outlook, Competition, Drivers, Trends, Demand, Pricing Analysis, Competitive, Strategic Insights, Companies, Challenges, Strategy, Consumer Insights, Analysis, Investment Trends, Opportunities, Growth, Size, Share, Industry, Revenue, Segments, Value, Segmentation, Supply, Forecast, Restraints
- India Kids Watches Market (2026-2032) | Strategy, Consumer Insights, Analysis, Investment Trends, Opportunities, Growth, Size, Share, Industry, Revenue, Segments, Value, Segmentation, Supply, Forecast, Restraints, Outlook, Competition, Drivers, Trends, Demand, Pricing Analysis, Competitive, Strategic Insights, Companies, Challenges
- Saudi Arabia Core Assurance Service Market (2025-2031) | Strategy, Consumer Insights, Analysis, Investment Trends, Opportunities, Growth, Size, Share, Industry, Revenue, Segments, Value, Segmentation, Supply, Forecast, Restraints, Outlook, Competition, Drivers, Trends, Demand, Pricing Analysis, Competitive, Strategic Insights, Companies, Challenges
Industry Events and Analyst Meet

India EV Show 2026

EV tech India Expo 2026

Auto Tech Asia 2026

Battery Tech India 2026

Smart Production Solutions Guangzhou 2026
Whitepaper
- Middle East & Africa Commercial Security Market Click here to view more.
- Middle East & Africa Fire Safety Systems & Equipment Market Click here to view more.
- GCC Drone Market Click here to view more.
- Middle East Lighting Fixture Market Click here to view more.
- GCC Physical & Perimeter Security Market Click here to view more.
6WResearch In News
- Doha a strategic location for EV manufacturing hub: IPA Qatar
- Demand for luxury TVs surging in the GCC, says Samsung
- Empowering Growth: The Thriving Journey of Bangladesh’s Cable Industry
- Demand for luxury TVs surging in the GCC, says Samsung
- Video call with a traditional healer? Once unthinkable, it’s now common in South Africa
- Intelligent Buildings To Smooth GCC’s Path To Net Zero