Netherlands Guar Market (2025-2031) | Consumer Insights, Competition, Companies, Outlook, Value, Competitive, Segmentation, Investment Trends, Revenue, Demand, Restraints, Analysis, Growth, Forecast, Challenges, Drivers, Size, Pricing Analysis, Segments, Strategic Insights, Industry, Strategy, Supply, Share, Opportunities, Trends
Market Forecast By Type (Guar Gum, Guar Split, Guar Meal), By Application (Food Thickening, Oil Drilling, Animal Feed), By End User (Food Industry, Petroleum Industry, Livestock Farming), By Certification (USDA Organic, ISO 22000, Non-GMO Certified), By Category (Premium, Mid-Range, Budget-Friendly) And Competitive Landscape
| Product Code: ETC12399756 | Publication Date: Apr 2025 | Updated Date: Nov 2025 | Product Type: Market Research Report | |
| Publisher: 6Wresearch | Author: Bhawna Singh | No. of Pages: 65 | No. of Figures: 34 | No. of Tables: 19 |
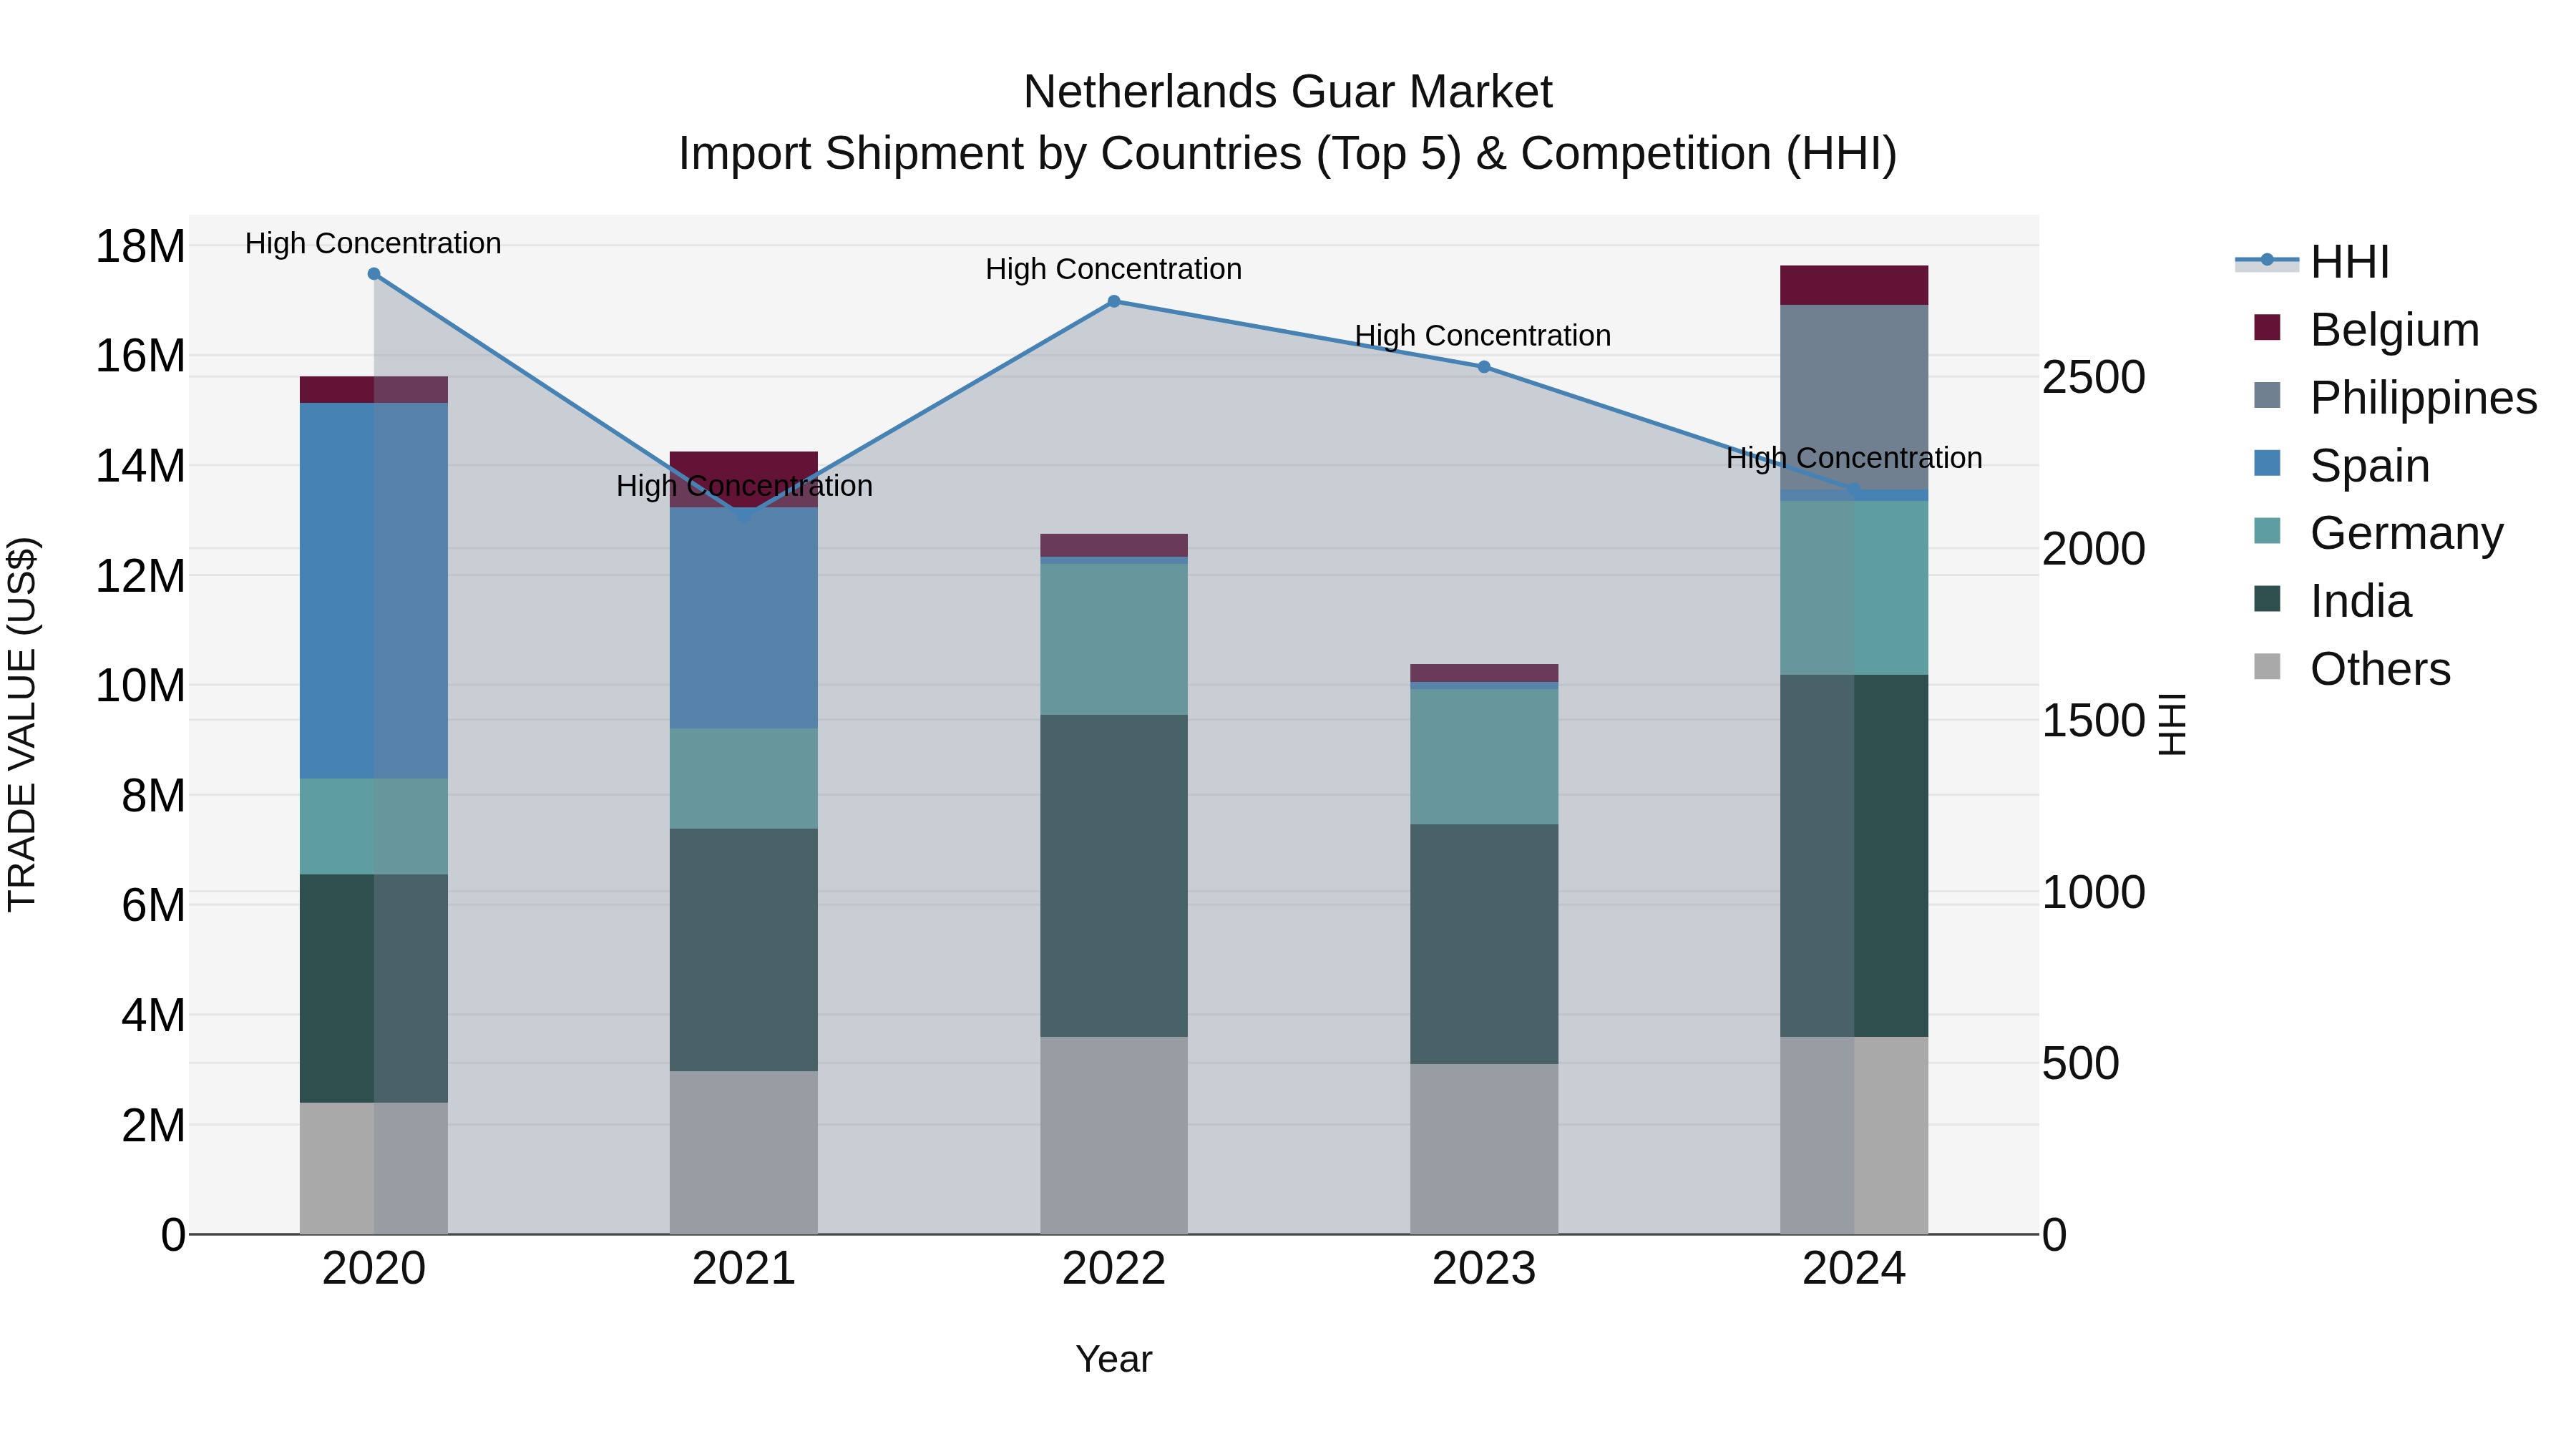
Netherlands Guar Market Top 5 Importing Countries and Market Competition (HHI) Analysis
The Netherlands continues to be a key hub for guar imports, with India, Philippines, Germany, Italy, and Morocco leading the pack in 2024. Despite high concentration with a high Herfindahl-Hirschman Index (HHI), the market has shown steady growth with a compound annual growth rate (CAGR) of 3.07% from 2020 to 2024. Notably, the growth rate spiked at 69.82% from 2023 to 2024, indicating a surge in demand for guar imports in the Netherlands. This data suggests a strong and dynamic market for guar products in the country.
Netherlands Guar Market Market Overview
The Netherlands guar market is characterized by steady demand for guar gum, a natural thickening agent derived from guar beans. Guar gum finds extensive applications in various industries such as food, pharmaceuticals, cosmetics, and oil drilling due to its superior thickening, stabilizing, and emulsifying properties. The Netherlands serves as a key distribution hub for guar gum in Europe, facilitating the import and export of the product to and from various regions. The market is influenced by factors such as fluctuating guar bean prices, supply chain disruptions, and evolving regulatory standards. Companies operating in the Netherlands guar market focus on product quality, sustainability, and innovation to meet the diverse requirements of end-users across different industries while also adapting to changing market dynamics and consumer preferences.
Netherlands Guar Market Trends
The Netherlands guar market is currently experiencing a steady growth due to the increasing demand for guar gum in various industries such as food, pharmaceuticals, and cosmetics. The rising awareness of the benefits of guar gum as a natural thickening and stabilizing agent has fueled its popularity among manufacturers looking for clean label ingredients. Additionally, the expanding use of guar gum in the oil and gas industry for hydraulic fracturing operations has further boosted its demand. Sustainability and traceability concerns are also influencing purchasing decisions, leading to a preference for ethically sourced guar gum. Overall, the Netherlands guar market is expected to continue its upward trajectory driven by the versatile applications and favorable properties of guar gum.
Netherlands Guar Market Challenges
In the Netherlands guar market, one of the key challenges faced is the dependency on imports. Guar gum, which is derived from guar beans, is primarily imported from countries like India and Pakistan. This reliance on external sources can lead to supply chain disruptions, price fluctuations, and quality inconsistencies. Additionally, fluctuations in currency exchange rates and import regulations can impact the cost and availability of guar gum in the Netherlands. Another challenge is the increasing consumer demand for organic and sustainable products, which puts pressure on guar gum suppliers to adhere to strict environmental and ethical standards in their production processes. Overall, the Netherlands guar market needs to address these challenges to ensure a stable and sustainable supply of guar gum for various industries.
Netherlands Guar Market Investment Opportunities
In the Netherlands, the guar market offers investment opportunities primarily in the agriculture and food industries. Guar is a versatile crop that is used in a variety of products such as food additives, pharmaceuticals, and cosmetics. Investing in guar production and processing companies can be a lucrative opportunity due to the increasing demand for guar-based products globally. Additionally, there is potential for investment in research and development of innovative guar-based products to cater to evolving consumer preferences and market trends. Investors can also consider investing in sustainable agriculture practices in guar cultivation to capitalize on the growing preference for environmentally friendly and ethically sourced products. Overall, the Netherlands guar market presents opportunities for investors looking to diversify their portfolio in the agriculture and food sector.
Netherlands Guar Market Government Policy
In the Netherlands, government policies related to the guar market primarily focus on promoting sustainable agricultural practices and ensuring food safety standards. The government provides support for research and innovation in guar cultivation to enhance crop yields and quality. Additionally, there are regulations in place to monitor the use of pesticides and fertilizers in guar farming to minimize environmental impact. The Netherlands also emphasizes the importance of fair trade practices in the guar industry, encouraging transparency and ethical sourcing. Overall, the government aims to create a competitive and sustainable guar market that meets both domestic and international demand while prioritizing environmental conservation and consumer welfare.
Netherlands Guar Market Future Outlook
The future outlook for the Netherlands guar market appears promising, driven by increasing consumer awareness of the health benefits associated with guar consumption. Guar gum is widely used in various industries such as food and beverages, pharmaceuticals, and cosmetics due to its thickening and stabilizing properties. With a growing demand for natural and plant-based ingredients, the guar market is expected to witness steady growth in the coming years. Additionally, the Netherlands` strategic location and well-developed infrastructure make it a key player in the European guar market, attracting both domestic and international manufacturers. However, challenges such as fluctuating prices and supply chain disruptions may impact market growth. Overall, the Netherlands guar market is poised for expansion, supported by evolving consumer preferences and the versatility of guar gum in various applications.
Key Highlights of the Report:
- Netherlands Guar Market Outlook
- Market Size of Netherlands Guar Market,2024
- Forecast of Netherlands Guar Market, 2031
- Historical Data and Forecast of Netherlands Guar Revenues & Volume for the Period 2021-2031
- Netherlands Guar Market Trend Evolution
- Netherlands Guar Market Drivers and Challenges
- Netherlands Guar Price Trends
- Netherlands Guar Porter's Five Forces
- Netherlands Guar Industry Life Cycle
- Historical Data and Forecast of Netherlands Guar Market Revenues & Volume By Type for the Period 2021-2031
- Historical Data and Forecast of Netherlands Guar Market Revenues & Volume By Guar Gum for the Period 2021-2031
- Historical Data and Forecast of Netherlands Guar Market Revenues & Volume By Guar Split for the Period 2021-2031
- Historical Data and Forecast of Netherlands Guar Market Revenues & Volume By Guar Meal for the Period 2021-2031
- Historical Data and Forecast of Netherlands Guar Market Revenues & Volume By Application for the Period 2021-2031
- Historical Data and Forecast of Netherlands Guar Market Revenues & Volume By Food Thickening for the Period 2021-2031
- Historical Data and Forecast of Netherlands Guar Market Revenues & Volume By Oil Drilling for the Period 2021-2031
- Historical Data and Forecast of Netherlands Guar Market Revenues & Volume By Animal Feed for the Period 2021-2031
- Historical Data and Forecast of Netherlands Guar Market Revenues & Volume By End User for the Period 2021-2031
- Historical Data and Forecast of Netherlands Guar Market Revenues & Volume By Food Industry for the Period 2021-2031
- Historical Data and Forecast of Netherlands Guar Market Revenues & Volume By Petroleum Industry for the Period 2021-2031
- Historical Data and Forecast of Netherlands Guar Market Revenues & Volume By Livestock Farming for the Period 2021-2031
- Historical Data and Forecast of Netherlands Guar Market Revenues & Volume By Certification for the Period 2021-2031
- Historical Data and Forecast of Netherlands Guar Market Revenues & Volume By USDA Organic for the Period 2021-2031
- Historical Data and Forecast of Netherlands Guar Market Revenues & Volume By ISO 22000 for the Period 2021-2031
- Historical Data and Forecast of Netherlands Guar Market Revenues & Volume By Non-GMO Certified for the Period 2021-2031
- Historical Data and Forecast of Netherlands Guar Market Revenues & Volume By Category for the Period 2021-2031
- Historical Data and Forecast of Netherlands Guar Market Revenues & Volume By Premium for the Period 2021-2031
- Historical Data and Forecast of Netherlands Guar Market Revenues & Volume By Mid-Range for the Period 2021-2031
- Historical Data and Forecast of Netherlands Guar Market Revenues & Volume By Budget-Friendly for the Period 2021-2031
- Netherlands Guar Import Export Trade Statistics
- Market Opportunity Assessment By Type
- Market Opportunity Assessment By Application
- Market Opportunity Assessment By End User
- Market Opportunity Assessment By Certification
- Market Opportunity Assessment By Category
- Netherlands Guar Top Companies Market Share
- Netherlands Guar Competitive Benchmarking By Technical and Operational Parameters
- Netherlands Guar Company Profiles
- Netherlands Guar Key Strategic Recommendations
Frequently Asked Questions About the Market Study (FAQs):
6Wresearch actively monitors the Netherlands Guar Market and publishes its comprehensive annual report, highlighting emerging trends, growth drivers, revenue analysis, and forecast outlook. Our insights help businesses to make data-backed strategic decisions with ongoing market dynamics. Our analysts track relevent industries related to the Netherlands Guar Market, allowing our clients with actionable intelligence and reliable forecasts tailored to emerging regional needs.
Yes, we provide customisation as per your requirements. To learn more, feel free to contact us on sales@6wresearch.com
1 Executive Summary |
2 Introduction |
2.1 Key Highlights of the Report |
2.2 Report Description |
2.3 Market Scope & Segmentation |
2.4 Research Methodology |
2.5 Assumptions |
3 Netherlands Guar Market Overview |
3.1 Netherlands Country Macro Economic Indicators |
3.2 Netherlands Guar Market Revenues & Volume, 2021 & 2031F |
3.3 Netherlands Guar Market - Industry Life Cycle |
3.4 Netherlands Guar Market - Porter's Five Forces |
3.5 Netherlands Guar Market Revenues & Volume Share, By Type, 2021 & 2031F |
3.6 Netherlands Guar Market Revenues & Volume Share, By Application, 2021 & 2031F |
3.7 Netherlands Guar Market Revenues & Volume Share, By End User, 2021 & 2031F |
3.8 Netherlands Guar Market Revenues & Volume Share, By Certification, 2021 & 2031F |
3.9 Netherlands Guar Market Revenues & Volume Share, By Category, 2021 & 2031F |
4 Netherlands Guar Market Dynamics |
4.1 Impact Analysis |
4.2 Market Drivers |
4.2.1 Increasing demand for natural and organic products in the Netherlands |
4.2.2 Rising awareness about the health benefits of guar gum in food and pharmaceutical industries |
4.2.3 Growth in the vegan and gluten-free food sectors |
4.3 Market Restraints |
4.3.1 Fluctuations in guar gum prices due to supply chain disruptions |
4.3.2 Regulatory challenges related to the approval and labeling of guar gum in different applications |
5 Netherlands Guar Market Trends |
6 Netherlands Guar Market, By Types |
6.1 Netherlands Guar Market, By Type |
6.1.1 Overview and Analysis |
6.1.2 Netherlands Guar Market Revenues & Volume, By Type, 2021 - 2031F |
6.1.3 Netherlands Guar Market Revenues & Volume, By Guar Gum, 2021 - 2031F |
6.1.4 Netherlands Guar Market Revenues & Volume, By Guar Split, 2021 - 2031F |
6.1.5 Netherlands Guar Market Revenues & Volume, By Guar Meal, 2021 - 2031F |
6.2 Netherlands Guar Market, By Application |
6.2.1 Overview and Analysis |
6.2.2 Netherlands Guar Market Revenues & Volume, By Food Thickening, 2021 - 2031F |
6.2.3 Netherlands Guar Market Revenues & Volume, By Oil Drilling, 2021 - 2031F |
6.2.4 Netherlands Guar Market Revenues & Volume, By Animal Feed, 2021 - 2031F |
6.3 Netherlands Guar Market, By End User |
6.3.1 Overview and Analysis |
6.3.2 Netherlands Guar Market Revenues & Volume, By Food Industry, 2021 - 2031F |
6.3.3 Netherlands Guar Market Revenues & Volume, By Petroleum Industry, 2021 - 2031F |
6.3.4 Netherlands Guar Market Revenues & Volume, By Livestock Farming, 2021 - 2031F |
6.4 Netherlands Guar Market, By Certification |
6.4.1 Overview and Analysis |
6.4.2 Netherlands Guar Market Revenues & Volume, By USDA Organic, 2021 - 2031F |
6.4.3 Netherlands Guar Market Revenues & Volume, By ISO 22000, 2021 - 2031F |
6.4.4 Netherlands Guar Market Revenues & Volume, By Non-GMO Certified, 2021 - 2031F |
6.5 Netherlands Guar Market, By Category |
6.5.1 Overview and Analysis |
6.5.2 Netherlands Guar Market Revenues & Volume, By Premium, 2021 - 2031F |
6.5.3 Netherlands Guar Market Revenues & Volume, By Mid-Range, 2021 - 2031F |
6.5.4 Netherlands Guar Market Revenues & Volume, By Budget-Friendly, 2021 - 2031F |
7 Netherlands Guar Market Import-Export Trade Statistics |
7.1 Netherlands Guar Market Export to Major Countries |
7.2 Netherlands Guar Market Imports from Major Countries |
8 Netherlands Guar Market Key Performance Indicators |
8.1 Consumption of guar gum in the Netherlands across various industries |
8.2 Adoption rate of guar gum in new product developments |
8.3 Number of research studies conducted on the benefits and applications of guar gum in the Netherlands |
8.4 Percentage of food manufacturers using guar gum as a stabilizer or thickening agent |
9 Netherlands Guar Market - Opportunity Assessment |
9.1 Netherlands Guar Market Opportunity Assessment, By Type, 2021 & 2031F |
9.2 Netherlands Guar Market Opportunity Assessment, By Application, 2021 & 2031F |
9.3 Netherlands Guar Market Opportunity Assessment, By End User, 2021 & 2031F |
9.4 Netherlands Guar Market Opportunity Assessment, By Certification, 2021 & 2031F |
9.5 Netherlands Guar Market Opportunity Assessment, By Category, 2021 & 2031F |
10 Netherlands Guar Market - Competitive Landscape |
10.1 Netherlands Guar Market Revenue Share, By Companies, 2024 |
10.2 Netherlands Guar Market Competitive Benchmarking, By Operating and Technical Parameters |
11 Company Profiles |
12 Recommendations |
13 Disclaimer |
Global Go To Market Strategy - 2030
Export potential enables firms to identify high-growth global markets with greater confidence by combining advanced trade intelligence with a structured quantitative methodology. The framework analyzes emerging demand trends and country-level import patterns while integrating macroeconomic and trade datasets such as GDP and population forecasts, bilateral import–export flows, tariff structures, elasticity differentials between developed and developing economies, geographic distance, and import demand projections. Using weighted trade values from 2020–2024 as the base period to project country-to-country export potential for 2030, these inputs are operationalized through calculated drivers such as gravity model parameters, tariff impact factors, and projected GDP per-capita growth. Through an analysis of hidden potentials, demand hotspots, and market conditions that are most favorable to success, this method enables firms to focus on target countries, maximize returns, and global expansion with data, backed by accuracy.
By factoring in the projected importer demand gap that is currently unmet and could be potential opportunity, it identifies the potential for the Exporter (Country) among 190 countries, against the general trade analysis, which identifies the biggest importer or exporter.
To discover high-growth global markets and optimize your business strategy:
Click Here
Pricing
- Single User License$ 1,995
- Department License$ 2,400
- Site License$ 3,120
- Global License$ 3,795

Leadership Perspectives from Industry Events
Search
Thought Leadership and Analyst Meet


Our Clients
6WResearch In News
- India Air Conditioner Market Set for Strong Rebound in 2026 After Weather-Led Correction and GST-Driven Recovery: 6Wresearch
- ADAS in India: How Automatic Emergency Braking, Blind Spot Detection & Driver Monitoring are Transforming Road Safety
- Doha a strategic location for EV manufacturing hub: IPA Qatar
- Demand for luxury TVs surging in the GCC, says Samsung
- Empowering Growth: The Thriving Journey of Bangladesh’s Cable Industry
- Demand for luxury TVs surging in the GCC, says Samsung
Latest Reports
- Poland Fire Protection Systems Market (2026-2032)
- Cape Verde Portable Hand-Thrown Extinguisher Market (2026-2032)
- Canada Portable Hand-Thrown Extinguisher Market (2026-2032)
- Cameroon Portable Hand-Thrown Extinguisher Market (2026-2032)
- Burundi Portable Hand-Thrown Extinguisher Market (2026-2032)
- Burkina Faso Portable Hand-Thrown Extinguisher Market (2026-2032)
- Bulgaria Portable Hand-Thrown Extinguisher Market (2026-2032)
- Brunei Portable Hand-Thrown Extinguisher Market (2026-2032)
- Botswana Portable Hand-Thrown Extinguisher Market (2026-2032)
- Bosnia and Herzegovina Portable Hand-Thrown Extinguisher Market (2026-2032)
Industry Events and Analyst Meet

HIMTEX 2026

India Refining Summit 2026

India EV Show 2026

EV tech India Expo 2026

Auto Tech Asia 2026
Whitepaper
- Middle East & Africa Commercial Security Market Click here to view more.
- Middle East & Africa Fire Safety Systems & Equipment Market Click here to view more.
- GCC Drone Market Click here to view more.
- Middle East Lighting Fixture Market Click here to view more.
- GCC Physical & Perimeter Security Market Click here to view more.