Netherlands Gums Market (2026-2032) | Growth, Value, Competitive Landscape, Analysis, Segmentation, Companies, Size & Revenue, Trends, Share, Forecast, Outlook, Industry
Market Forecast By Confectionery Variant (Bubble Gum, Chewing Gum), By Distribution Channel (Convenience Store, Online Retail Store, Supermarket/Hypermarket, Others) And Competitive Landscape
| Product Code: ETC8539665 | Publication Date: Sep 2024 | Updated Date: Apr 2026 | Product Type: Market Research Report | |
| Publisher: 6Wresearch | Author: Vasudha | No. of Pages: 75 | No. of Figures: 35 | No. of Tables: 20 |
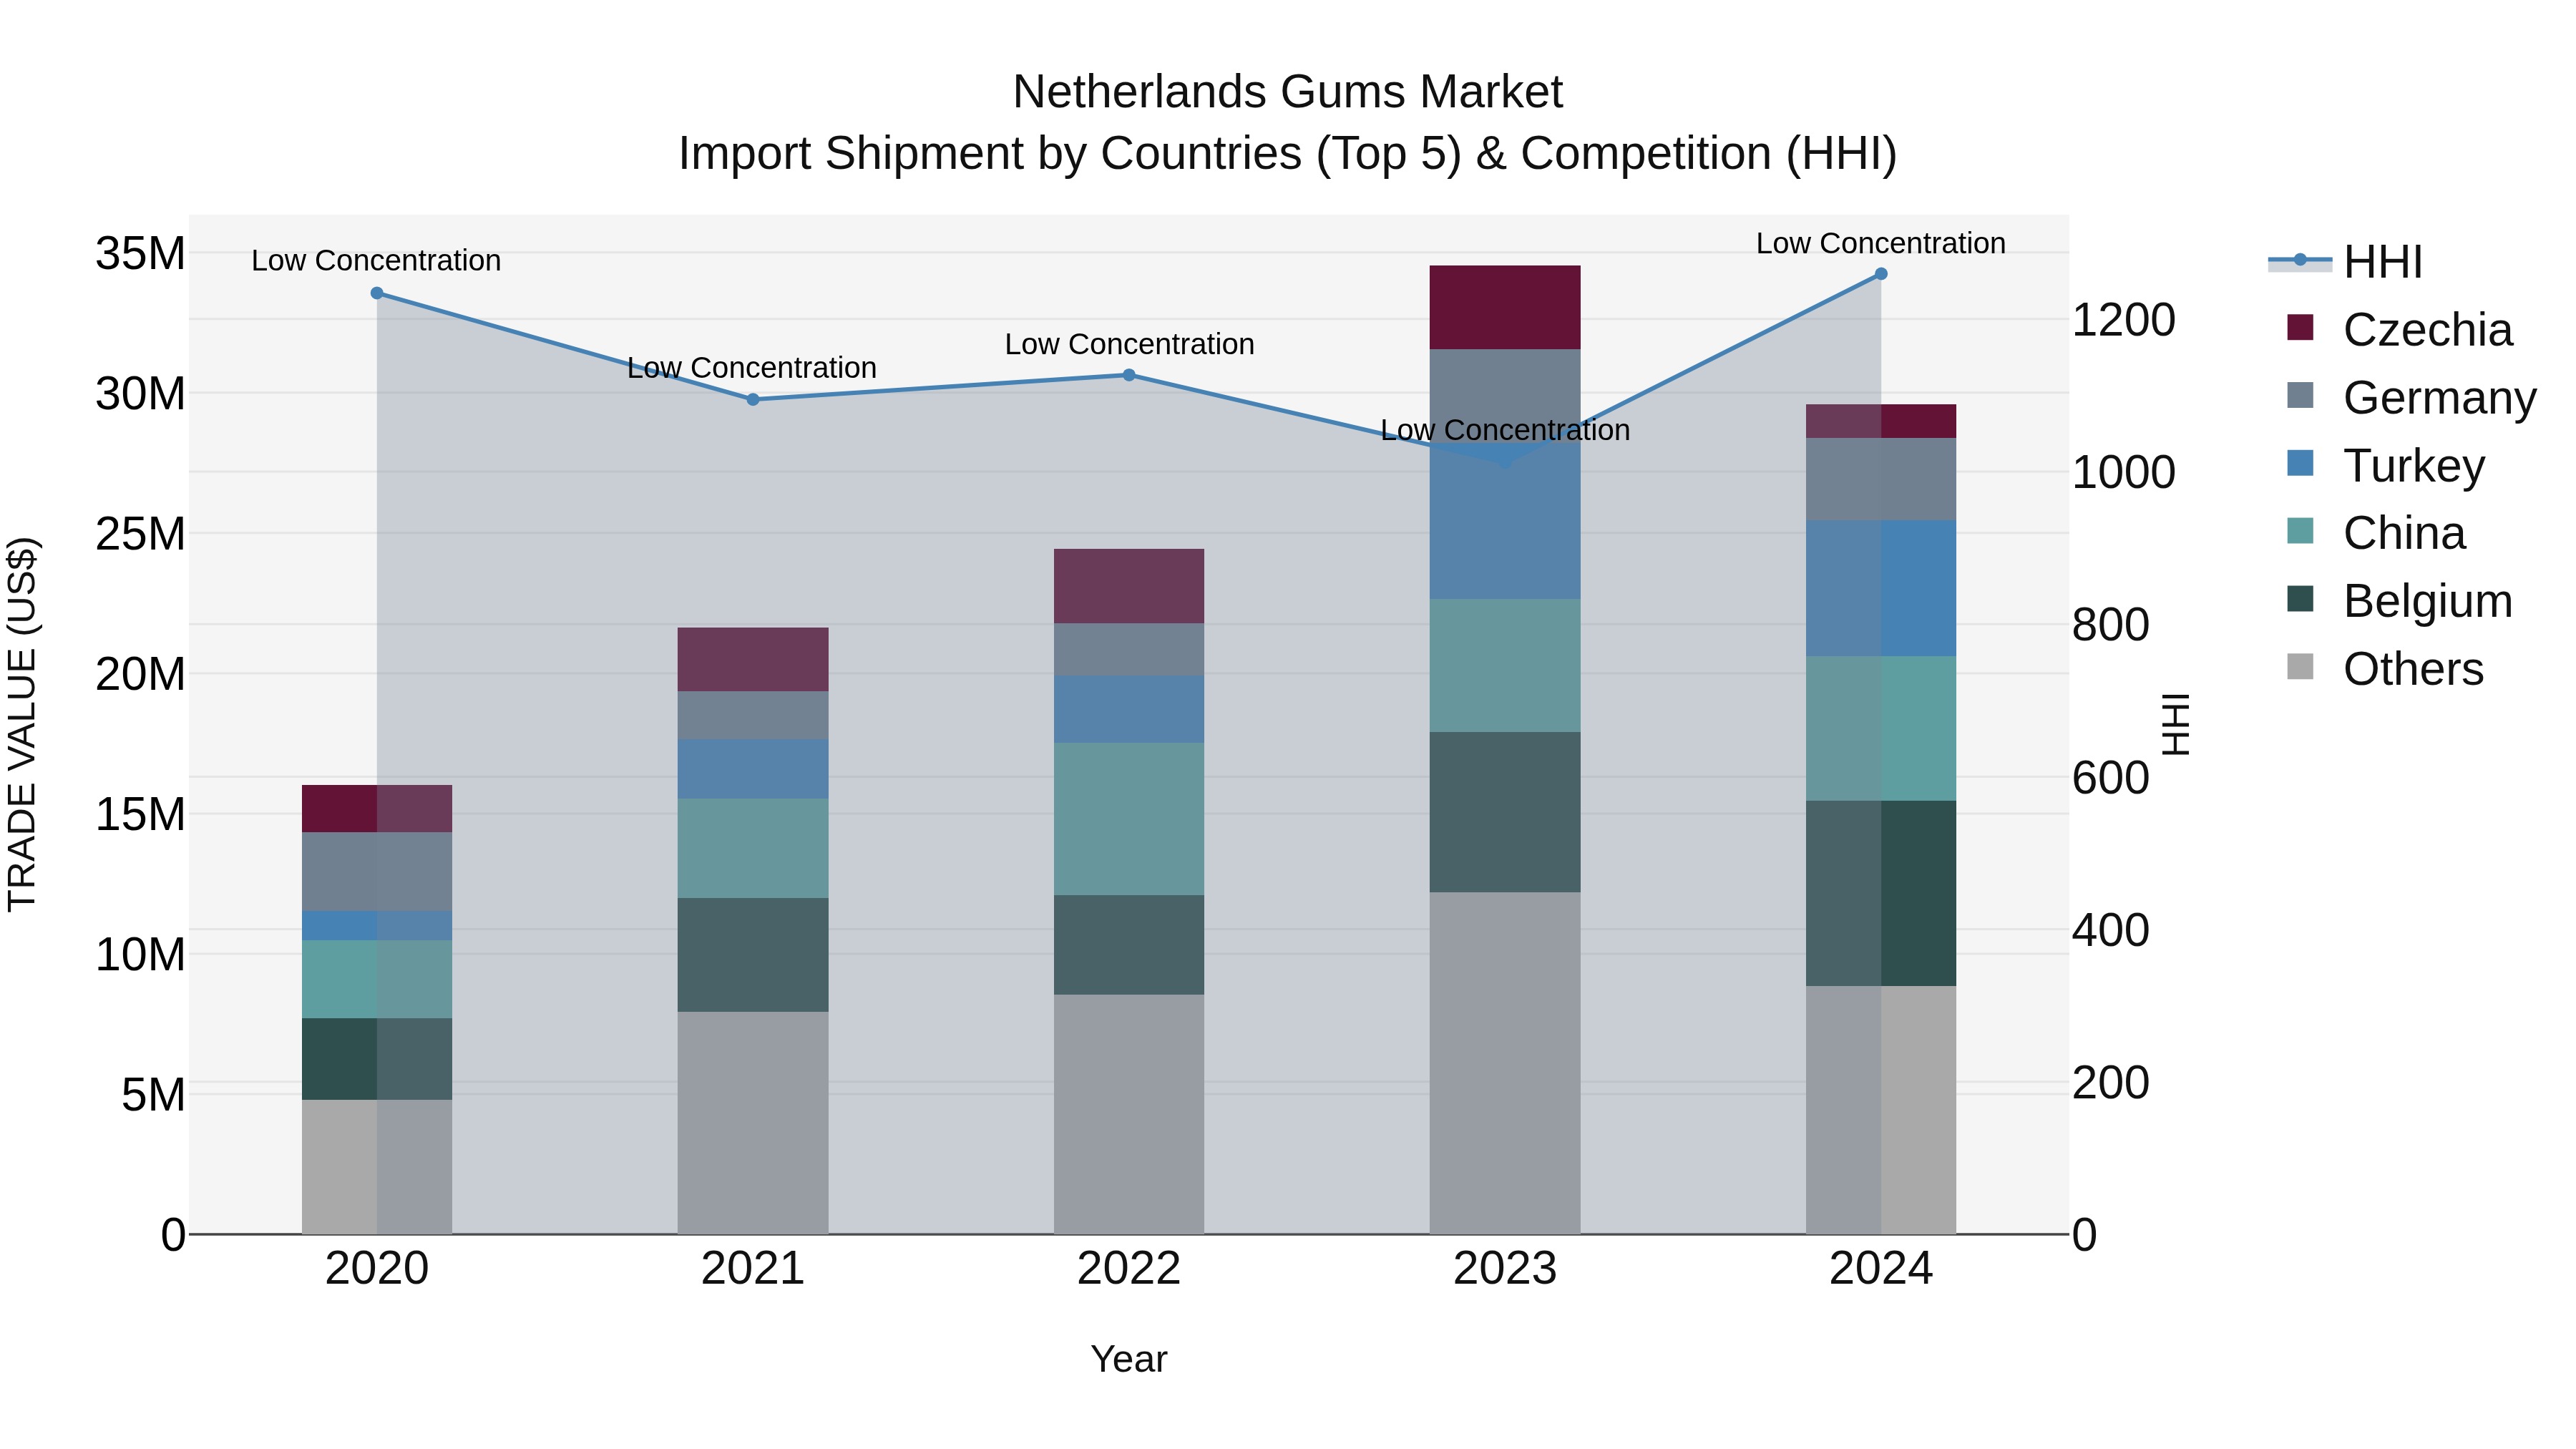
Netherlands Gums Market Top 5 Importing Countries and Market Competition (HHI) Analysis
The Netherlands experienced a steady increase in gums import shipments from top exporting countries like Belgium, China, Turkey, Germany, and Spain in 2024, indicating a diverse sourcing strategy. Despite the healthy Compound Annual Growth Rate (CAGR) of 16.57% from 2020 to 2024, there was a slight decline in growth rate from 2023 to 2024 at -14.34%. The market remains competitive with low concentration as reflected by the Herfindahl-Hirschman Index (HHI), suggesting opportunities for market expansion and innovation in the gums import sector in the Netherlands.
Key Highlights of the Report:
- Netherlands Gums Market Outlook
- Market Size of Netherlands Gums Market, 2025
- Forecast of Netherlands Gums Market, 2032
- Historical Data and Forecast of Netherlands Gums Revenues & Volume for the Period 2022 - 2032
- Netherlands Gums Market Trend Evolution
- Netherlands Gums Market Drivers and Challenges
- Netherlands Gums Price Trends
- Netherlands Gums Porter's Five Forces
- Netherlands Gums Industry Life Cycle
- Historical Data and Forecast of Netherlands Gums Market Revenues & Volume By Confectionery Variant for the Period 2022 - 2032
- Historical Data and Forecast of Netherlands Gums Market Revenues & Volume By Bubble Gum for the Period 2022 - 2032
- Historical Data and Forecast of Netherlands Gums Market Revenues & Volume By Chewing Gum for the Period 2022 - 2032
- Historical Data and Forecast of Netherlands Gums Market Revenues & Volume By Distribution Channel for the Period 2022 - 2032
- Historical Data and Forecast of Netherlands Gums Market Revenues & Volume By Convenience Store for the Period 2022 - 2032
- Historical Data and Forecast of Netherlands Gums Market Revenues & Volume By Online Retail Store for the Period 2022 - 2032
- Historical Data and Forecast of Netherlands Gums Market Revenues & Volume By Supermarket/Hypermarket for the Period 2022 - 2032
- Historical Data and Forecast of Netherlands Gums Market Revenues & Volume By Others for the Period 2022 - 2032
- Netherlands Gums Import Export Trade Statistics
- Market Opportunity Assessment By Confectionery Variant
- Market Opportunity Assessment By Distribution Channel
- Netherlands Gums Top Companies Market Share
- Netherlands Gums Competitive Benchmarking By Technical and Operational Parameters
- Netherlands Gums Company Profiles
- Netherlands Gums Key Strategic Recommendations
Frequently Asked Questions About the Market Study (FAQs):
6Wresearch actively monitors the Netherlands Gums Market and publishes its comprehensive annual report, highlighting emerging trends, growth drivers, revenue analysis, and forecast outlook. Our insights help businesses to make data-backed strategic decisions with ongoing market dynamics. Our analysts track relevent industries related to the Netherlands Gums Market, allowing our clients with actionable intelligence and reliable forecasts tailored to emerging regional needs.
Yes, we provide customisation as per your requirements. To learn more, feel free to contact us on sales@6wresearch.com
1 Executive Summary |
2 Introduction |
2.1 Key Highlights of the Report |
2.2 Report Description |
2.3 Market Scope & Segmentation |
2.4 Research Methodology |
2.5 Assumptions |
3 Netherlands Gums Market Overview |
3.1 Netherlands Country Macro Economic Indicators |
3.2 Netherlands Gums Market Revenues & Volume, 2022 & 2032F |
3.3 Netherlands Gums Market - Industry Life Cycle |
3.4 Netherlands Gums Market - Porter's Five Forces |
3.5 Netherlands Gums Market Revenues & Volume Share, By Confectionery Variant, 2022 & 2032F |
3.6 Netherlands Gums Market Revenues & Volume Share, By Distribution Channel, 2022 & 2032F |
4 Netherlands Gums Market Dynamics |
4.1 Impact Analysis |
4.2 Market Drivers |
4.2.1 Increasing health consciousness among consumers leading to a demand for sugar-free and functional gums. |
4.2.2 Introduction of innovative flavors and product variants in the gum market. |
4.2.3 Rising disposable income and changing consumer preferences towards convenient and on-the-go snacks. |
4.3 Market Restraints |
4.3.1 Regulatory restrictions on certain ingredients used in gums, such as artificial sweeteners or food colorings. |
4.3.2 Competition from alternative snack options like mints, candies, and chocolates. |
4.3.3 Fluctuating raw material prices impacting production costs and pricing strategies. |
5 Netherlands Gums Market Trends |
6 Netherlands Gums Market, By Types |
6.1 Netherlands Gums Market, By Confectionery Variant |
6.1.1 Overview and Analysis |
6.1.2 Netherlands Gums Market Revenues & Volume, By Confectionery Variant, 2022 - 2032F |
6.1.3 Netherlands Gums Market Revenues & Volume, By Bubble Gum, 2022 - 2032F |
6.1.4 Netherlands Gums Market Revenues & Volume, By Chewing Gum, 2022 - 2032F |
6.2 Netherlands Gums Market, By Distribution Channel |
6.2.1 Overview and Analysis |
6.2.2 Netherlands Gums Market Revenues & Volume, By Convenience Store, 2022 - 2032F |
6.2.3 Netherlands Gums Market Revenues & Volume, By Online Retail Store, 2022 - 2032F |
6.2.4 Netherlands Gums Market Revenues & Volume, By Supermarket/Hypermarket, 2022 - 2032F |
6.2.5 Netherlands Gums Market Revenues & Volume, By Others, 2022 - 2032F |
7 Netherlands Gums Market Import-Export Trade Statistics |
7.1 Netherlands Gums Market Export to Major Countries |
7.2 Netherlands Gums Market Imports from Major Countries |
8 Netherlands Gums Market Key Performance Indicators |
8.1 Consumer engagement metrics on social media platforms for gum brands. |
8.2 Rate of new product launches and innovations in the gums market. |
8.3 Percentage of market share held by sugar-free and functional gums compared to traditional gums. |
9 Netherlands Gums Market - Opportunity Assessment |
9.1 Netherlands Gums Market Opportunity Assessment, By Confectionery Variant, 2022 & 2032F |
9.2 Netherlands Gums Market Opportunity Assessment, By Distribution Channel, 2022 & 2032F |
10 Netherlands Gums Market - Competitive Landscape |
10.1 Netherlands Gums Market Revenue Share, By Companies, 2025 |
10.2 Netherlands Gums Market Competitive Benchmarking, By Operating and Technical Parameters |
11 Company Profiles |
12 Recommendations |
13 Disclaimer |
Global Go To Market Strategy - 2030
Export potential enables firms to identify high-growth global markets with greater confidence by combining advanced trade intelligence with a structured quantitative methodology. The framework analyzes emerging demand trends and country-level import patterns while integrating macroeconomic and trade datasets such as GDP and population forecasts, bilateral import–export flows, tariff structures, elasticity differentials between developed and developing economies, geographic distance, and import demand projections. Using weighted trade values from 2020–2024 as the base period to project country-to-country export potential for 2030, these inputs are operationalized through calculated drivers such as gravity model parameters, tariff impact factors, and projected GDP per-capita growth. Through an analysis of hidden potentials, demand hotspots, and market conditions that are most favorable to success, this method enables firms to focus on target countries, maximize returns, and global expansion with data, backed by accuracy.
By factoring in the projected importer demand gap that is currently unmet and could be potential opportunity, it identifies the potential for the Exporter (Country) among 190 countries, against the general trade analysis, which identifies the biggest importer or exporter.
To discover high-growth global markets and optimize your business strategy:
Click Here
Pricing
- Single User License$ 1,995
- Department License$ 2,400
- Site License$ 3,120
- Global License$ 3,795

Leadership Perspectives from Industry Events
Search
Thought Leadership and Analyst Meet


Our Clients
6WResearch In News
- Doha a strategic location for EV manufacturing hub: IPA Qatar
- Demand for luxury TVs surging in the GCC, says Samsung
- Empowering Growth: The Thriving Journey of Bangladesh’s Cable Industry
- Demand for luxury TVs surging in the GCC, says Samsung
- Video call with a traditional healer? Once unthinkable, it’s now common in South Africa
- Intelligent Buildings To Smooth GCC’s Path To Net Zero
Latest Reports
- Cape Verde Portable Hand-Thrown Extinguisher Market (2026-2032)
- Canada Portable Hand-Thrown Extinguisher Market (2026-2032)
- Cameroon Portable Hand-Thrown Extinguisher Market (2026-2032)
- Burundi Portable Hand-Thrown Extinguisher Market (2026-2032)
- Burkina Faso Portable Hand-Thrown Extinguisher Market (2026-2032)
- Bulgaria Portable Hand-Thrown Extinguisher Market (2026-2032)
- Brunei Portable Hand-Thrown Extinguisher Market (2026-2032)
- Botswana Portable Hand-Thrown Extinguisher Market (2026-2032)
- Bosnia and Herzegovina Portable Hand-Thrown Extinguisher Market (2026-2032)
- Bolivia Portable Hand-Thrown Extinguisher Market (2026-2032)
Industry Events and Analyst Meet

HIMTEX 2026

India Refining Summit 2026

India EV Show 2026

EV tech India Expo 2026

Auto Tech Asia 2026
Whitepaper
- Middle East & Africa Commercial Security Market Click here to view more.
- Middle East & Africa Fire Safety Systems & Equipment Market Click here to view more.
- GCC Drone Market Click here to view more.
- Middle East Lighting Fixture Market Click here to view more.
- GCC Physical & Perimeter Security Market Click here to view more.