Netherlands Jerry Cans Market (2026-2032) | Outlook, Size & Revenue, Forecast, Industry, Share, Companies, Competitive Landscape, Segmentation, Growth, Trends, Analysis, Value
Market Forecast By Capacity (20 Liters, 30 Liters, 40 Liters, 50 Liters, 60 Liters, 70 Liters, 80 Liters, Others), By Material (HDPE, LDPE, PP And PET), By Shape (Round, Square, Stackable, Others), By Manufacturing Process (Blow Molding, Injection Molding, Compression Molding), By End-User (Food & Beverages, Chemicals, Pharmaceuticals, Agrochemicals, Oil and Lubricants, Others) And Competitive Landscape
| Product Code: ETC8541089 | Publication Date: Sep 2024 | Updated Date: Apr 2026 | Product Type: Market Research Report | |
| Publisher: 6Wresearch | Author: Vasudha | No. of Pages: 75 | No. of Figures: 35 | No. of Tables: 20 |
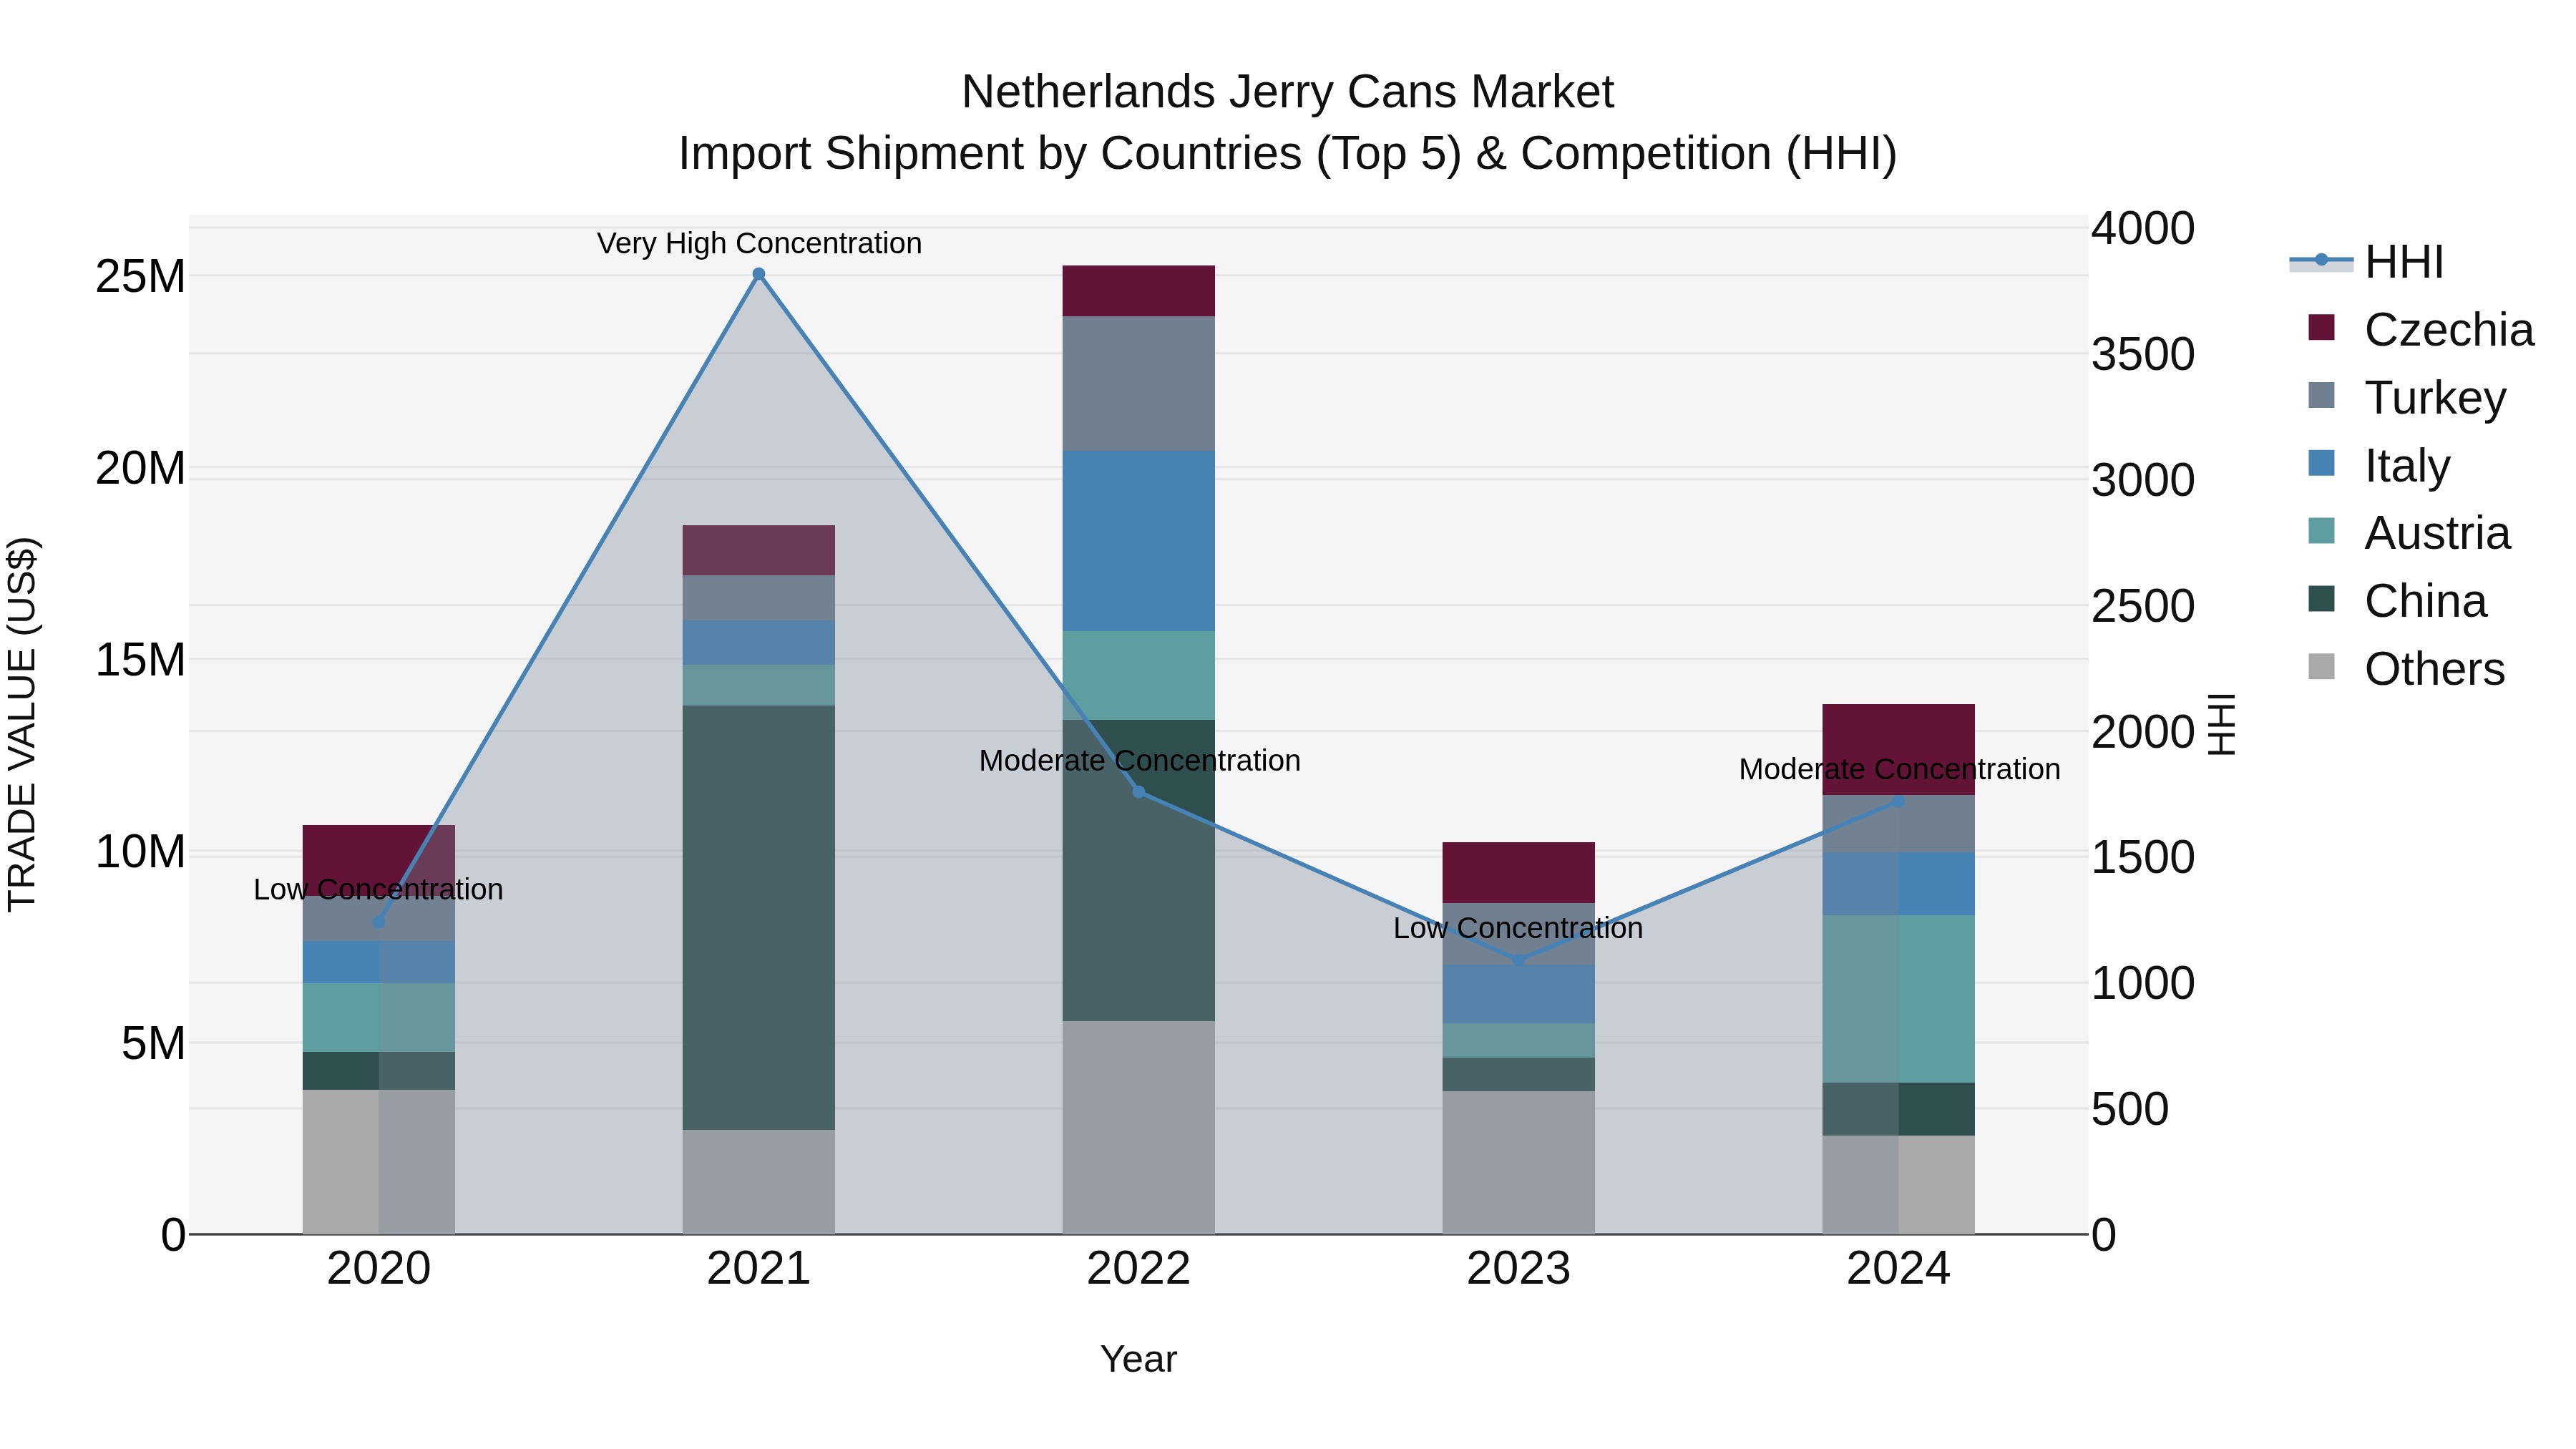
Netherlands Jerry Cans Market Top 5 Importing Countries and Market Competition (HHI) Analysis
The Netherlands saw a significant increase in Jerry cans import shipments in 2024, with top exporting countries being Austria, Czechia, Italy, Turkey, and China. The market concentration, as measured by HHI, shifted from low to moderate concentration, indicating a more balanced distribution among suppliers. The impressive Compound Annual Growth Rate (CAGR) of 6.67% from 2020 to 2024 highlights the steady expansion of the market. Moreover, the notable growth rate of 35.37% from 2023 to 2024 suggests a rapid acceleration in import activities, reflecting the increasing demand for Jerry cans in the Netherlands.
Key Highlights of the Report:
- Netherlands Jerry Cans Market Outlook
- Market Size of Netherlands Jerry Cans Market, 2025
- Forecast of Netherlands Jerry Cans Market, 2032
- Historical Data and Forecast of Netherlands Jerry Cans Revenues & Volume for the Period 2022 - 2032
- Netherlands Jerry Cans Market Trend Evolution
- Netherlands Jerry Cans Market Drivers and Challenges
- Netherlands Jerry Cans Price Trends
- Netherlands Jerry Cans Porter's Five Forces
- Netherlands Jerry Cans Industry Life Cycle
- Historical Data and Forecast of Netherlands Jerry Cans Market Revenues & Volume By Capacity for the Period 2022 - 2032
- Historical Data and Forecast of Netherlands Jerry Cans Market Revenues & Volume By 20 Liters for the Period 2022 - 2032
- Historical Data and Forecast of Netherlands Jerry Cans Market Revenues & Volume By 30 Liters for the Period 2022 - 2032
- Historical Data and Forecast of Netherlands Jerry Cans Market Revenues & Volume By 40 Liters for the Period 2022 - 2032
- Historical Data and Forecast of Netherlands Jerry Cans Market Revenues & Volume By 50 Liters for the Period 2022 - 2032
- Historical Data and Forecast of Netherlands Jerry Cans Market Revenues & Volume By 60 Liters for the Period 2022 - 2032
- Historical Data and Forecast of Netherlands Jerry Cans Market Revenues & Volume By 70 Liters for the Period 2022 - 2032
- Historical Data and Forecast of Netherlands Jerry Cans Market Revenues & Volume By 80 Liters for the Period 2022 - 2032
- Historical Data and Forecast of Netherlands 20 Liters Jerry Cans Market Revenues & Volume By Others for the Period 2022 - 2032
- Historical Data and Forecast of Netherlands Jerry Cans Market Revenues & Volume By Material for the Period 2022 - 2032
- Historical Data and Forecast of Netherlands Jerry Cans Market Revenues & Volume By HDPE for the Period 2022 - 2032
- Historical Data and Forecast of Netherlands Jerry Cans Market Revenues & Volume By LDPE for the Period 2022 - 2032
- Historical Data and Forecast of Netherlands Jerry Cans Market Revenues & Volume By PP And PET for the Period 2022 - 2032
- Historical Data and Forecast of Netherlands Jerry Cans Market Revenues & Volume By Shape for the Period 2022 - 2032
- Historical Data and Forecast of Netherlands Jerry Cans Market Revenues & Volume By Round for the Period 2022 - 2032
- Historical Data and Forecast of Netherlands Jerry Cans Market Revenues & Volume By Square for the Period 2022 - 2032
- Historical Data and Forecast of Netherlands Jerry Cans Market Revenues & Volume By Stackable for the Period 2022 - 2032
- Historical Data and Forecast of Netherlands Jerry Cans Market Revenues & Volume By Others for the Period 2022 - 2032
- Historical Data and Forecast of Netherlands Jerry Cans Market Revenues & Volume By Manufacturing Process for the Period 2022 - 2032
- Historical Data and Forecast of Netherlands Jerry Cans Market Revenues & Volume By Blow Molding for the Period 2022 - 2032
- Historical Data and Forecast of Netherlands Jerry Cans Market Revenues & Volume By Injection Molding for the Period 2022 - 2032
- Historical Data and Forecast of Netherlands Jerry Cans Market Revenues & Volume By Compression Molding for the Period 2022 - 2032
- Historical Data and Forecast of Netherlands Jerry Cans Market Revenues & Volume By End-User for the Period 2022 - 2032
- Historical Data and Forecast of Netherlands Jerry Cans Market Revenues & Volume By Food & Beverages for the Period 2022 - 2032
- Historical Data and Forecast of Netherlands Jerry Cans Market Revenues & Volume By Chemicals for the Period 2022 - 2032
- Historical Data and Forecast of Netherlands Jerry Cans Market Revenues & Volume By Pharmaceuticals for the Period 2022 - 2032
- Historical Data and Forecast of Netherlands Jerry Cans Market Revenues & Volume By Agrochemicals for the Period 2022 - 2032
- Historical Data and Forecast of Netherlands Jerry Cans Market Revenues & Volume By Oil and Lubricants for the Period 2022 - 2032
- Historical Data and Forecast of Netherlands Jerry Cans Market Revenues & Volume By Others for the Period 2022 - 2032
- Netherlands Jerry Cans Import Export Trade Statistics
- Market Opportunity Assessment By Capacity
- Market Opportunity Assessment By Material
- Market Opportunity Assessment By Shape
- Market Opportunity Assessment By Manufacturing Process
- Market Opportunity Assessment By End-User
- Netherlands Jerry Cans Top Companies Market Share
- Netherlands Jerry Cans Competitive Benchmarking By Technical and Operational Parameters
- Netherlands Jerry Cans Company Profiles
- Netherlands Jerry Cans Key Strategic Recommendations
Frequently Asked Questions About the Market Study (FAQs):
6Wresearch actively monitors the Netherlands Jerry Cans Market and publishes its comprehensive annual report, highlighting emerging trends, growth drivers, revenue analysis, and forecast outlook. Our insights help businesses to make data-backed strategic decisions with ongoing market dynamics. Our analysts track relevent industries related to the Netherlands Jerry Cans Market, allowing our clients with actionable intelligence and reliable forecasts tailored to emerging regional needs.
Yes, we provide customisation as per your requirements. To learn more, feel free to contact us on sales@6wresearch.com
1 Executive Summary |
2 Introduction |
2.1 Key Highlights of the Report |
2.2 Report Description |
2.3 Market Scope & Segmentation |
2.4 Research Methodology |
2.5 Assumptions |
3 Netherlands Jerry Cans Market Overview |
3.1 Netherlands Country Macro Economic Indicators |
3.2 Netherlands Jerry Cans Market Revenues & Volume, 2022 & 2032F |
3.3 Netherlands Jerry Cans Market - Industry Life Cycle |
3.4 Netherlands Jerry Cans Market - Porter's Five Forces |
3.5 Netherlands Jerry Cans Market Revenues & Volume Share, By Capacity, 2022 & 2032F |
3.6 Netherlands Jerry Cans Market Revenues & Volume Share, By Material, 2022 & 2032F |
3.7 Netherlands Jerry Cans Market Revenues & Volume Share, By Shape, 2022 & 2032F |
3.8 Netherlands Jerry Cans Market Revenues & Volume Share, By Manufacturing Process, 2022 & 2032F |
3.9 Netherlands Jerry Cans Market Revenues & Volume Share, By End-User, 2022 & 2032F |
4 Netherlands Jerry Cans Market Dynamics |
4.1 Impact Analysis |
4.2 Market Drivers |
4.2.1 Growing demand for durable and sustainable packaging solutions |
4.2.2 Increasing focus on efficient storage and transportation of liquids |
4.2.3 Rise in outdoor activities and recreational use of jerry cans |
4.3 Market Restraints |
4.3.1 Stringent regulations related to the use of plastics in packaging |
4.3.2 Fluctuating raw material prices impacting production costs |
4.3.3 Competition from alternative packaging solutions such as collapsible water containers |
5 Netherlands Jerry Cans Market Trends |
6 Netherlands Jerry Cans Market, By Types |
6.1 Netherlands Jerry Cans Market, By Capacity |
6.1.1 Overview and Analysis |
6.1.2 Netherlands Jerry Cans Market Revenues & Volume, By Capacity, 2022 - 2032F |
6.1.3 Netherlands Jerry Cans Market Revenues & Volume, By 20 Liters, 2022 - 2032F |
6.1.4 Netherlands Jerry Cans Market Revenues & Volume, By 30 Liters, 2022 - 2032F |
6.1.5 Netherlands Jerry Cans Market Revenues & Volume, By 40 Liters, 2022 - 2032F |
6.1.6 Netherlands Jerry Cans Market Revenues & Volume, By 50 Liters, 2022 - 2032F |
6.1.7 Netherlands Jerry Cans Market Revenues & Volume, By 60 Liters, 2022 - 2032F |
6.1.8 Netherlands Jerry Cans Market Revenues & Volume, By 70 Liters, 2022 - 2032F |
6.1.9 Netherlands Jerry Cans Market Revenues & Volume, By Others, 2022 - 2032F |
6.1.10 Netherlands Jerry Cans Market Revenues & Volume, By Others, 2022 - 2032F |
6.2 Netherlands Jerry Cans Market, By Material |
6.2.1 Overview and Analysis |
6.2.2 Netherlands Jerry Cans Market Revenues & Volume, By HDPE, 2022 - 2032F |
6.2.3 Netherlands Jerry Cans Market Revenues & Volume, By LDPE, 2022 - 2032F |
6.2.4 Netherlands Jerry Cans Market Revenues & Volume, By PP And PET, 2022 - 2032F |
6.3 Netherlands Jerry Cans Market, By Shape |
6.3.1 Overview and Analysis |
6.3.2 Netherlands Jerry Cans Market Revenues & Volume, By Round, 2022 - 2032F |
6.3.3 Netherlands Jerry Cans Market Revenues & Volume, By Square, 2022 - 2032F |
6.3.4 Netherlands Jerry Cans Market Revenues & Volume, By Stackable, 2022 - 2032F |
6.3.5 Netherlands Jerry Cans Market Revenues & Volume, By Others, 2022 - 2032F |
6.4 Netherlands Jerry Cans Market, By Manufacturing Process |
6.4.1 Overview and Analysis |
6.4.2 Netherlands Jerry Cans Market Revenues & Volume, By Blow Molding, 2022 - 2032F |
6.4.3 Netherlands Jerry Cans Market Revenues & Volume, By Injection Molding, 2022 - 2032F |
6.4.4 Netherlands Jerry Cans Market Revenues & Volume, By Compression Molding, 2022 - 2032F |
6.5 Netherlands Jerry Cans Market, By End-User |
6.5.1 Overview and Analysis |
6.5.2 Netherlands Jerry Cans Market Revenues & Volume, By Food & Beverages, 2022 - 2032F |
6.5.3 Netherlands Jerry Cans Market Revenues & Volume, By Chemicals, 2022 - 2032F |
6.5.4 Netherlands Jerry Cans Market Revenues & Volume, By Pharmaceuticals, 2022 - 2032F |
6.5.5 Netherlands Jerry Cans Market Revenues & Volume, By Agrochemicals, 2022 - 2032F |
6.5.6 Netherlands Jerry Cans Market Revenues & Volume, By Oil and Lubricants, 2022 - 2032F |
6.5.7 Netherlands Jerry Cans Market Revenues & Volume, By Others, 2022 - 2032F |
7 Netherlands Jerry Cans Market Import-Export Trade Statistics |
7.1 Netherlands Jerry Cans Market Export to Major Countries |
7.2 Netherlands Jerry Cans Market Imports from Major Countries |
8 Netherlands Jerry Cans Market Key Performance Indicators |
8.1 Percentage of jerry cans made from recycled materials |
8.2 Average weight reduction per jerry can design iteration |
8.3 Number of new product innovations in the jerry cans market |
8.4 Customer satisfaction ratings for jerry can durability and leak-proof features |
8.5 Percentage increase in sales of jerry cans for outdoor and recreational use |
9 Netherlands Jerry Cans Market - Opportunity Assessment |
9.1 Netherlands Jerry Cans Market Opportunity Assessment, By Capacity, 2022 & 2032F |
9.2 Netherlands Jerry Cans Market Opportunity Assessment, By Material, 2022 & 2032F |
9.3 Netherlands Jerry Cans Market Opportunity Assessment, By Shape, 2022 & 2032F |
9.4 Netherlands Jerry Cans Market Opportunity Assessment, By Manufacturing Process, 2022 & 2032F |
9.5 Netherlands Jerry Cans Market Opportunity Assessment, By End-User, 2022 & 2032F |
10 Netherlands Jerry Cans Market - Competitive Landscape |
10.1 Netherlands Jerry Cans Market Revenue Share, By Companies, 2025 |
10.2 Netherlands Jerry Cans Market Competitive Benchmarking, By Operating and Technical Parameters |
11 Company Profiles |
12 Recommendations |
13 Disclaimer |
Global Go To Market Strategy - 2030
Export potential enables firms to identify high-growth global markets with greater confidence by combining advanced trade intelligence with a structured quantitative methodology. The framework analyzes emerging demand trends and country-level import patterns while integrating macroeconomic and trade datasets such as GDP and population forecasts, bilateral import–export flows, tariff structures, elasticity differentials between developed and developing economies, geographic distance, and import demand projections. Using weighted trade values from 2020–2024 as the base period to project country-to-country export potential for 2030, these inputs are operationalized through calculated drivers such as gravity model parameters, tariff impact factors, and projected GDP per-capita growth. Through an analysis of hidden potentials, demand hotspots, and market conditions that are most favorable to success, this method enables firms to focus on target countries, maximize returns, and global expansion with data, backed by accuracy.
By factoring in the projected importer demand gap that is currently unmet and could be potential opportunity, it identifies the potential for the Exporter (Country) among 190 countries, against the general trade analysis, which identifies the biggest importer or exporter.
To discover high-growth global markets and optimize your business strategy:
Click Here
Pricing
- Single User License$ 1,995
- Department License$ 2,400
- Site License$ 3,120
- Global License$ 3,795

Leadership Perspectives from Industry Events
Search
Thought Leadership and Analyst Meet


Our Clients
6WResearch In News
- Doha a strategic location for EV manufacturing hub: IPA Qatar
- Demand for luxury TVs surging in the GCC, says Samsung
- Empowering Growth: The Thriving Journey of Bangladesh’s Cable Industry
- Demand for luxury TVs surging in the GCC, says Samsung
- Video call with a traditional healer? Once unthinkable, it’s now common in South Africa
- Intelligent Buildings To Smooth GCC’s Path To Net Zero
Latest Reports
- Taiwan Airport Wireless Infrastructure Market (2026-2032)
- Vietnam Airport Wireless Infrastructure Market (2026-2032)
- Thailand Airport Wireless Infrastructure Market (2026-2032)
- South Korea Airport Wireless Infrastructure Market (2026-2032)
- Romania Airport Wireless Infrastructure Market (2026-2032)
- Qatar Airport Wireless Infrastructure Market (2026-2032)
- Philippines Airport Wireless Infrastructure Market (2026-2032)
- Japan Airport Wireless Infrastructure Market (2026-2032)
- Taiwan Airport Winter Services Market (2026-2032)
- Vietnam Airport Winter Services Market (2026-2032)
Industry Events and Analyst Meet

HIMTEX 2026

India Refining Summit 2026

India EV Show 2026

EV tech India Expo 2026

Auto Tech Asia 2026
Whitepaper
- Middle East & Africa Commercial Security Market Click here to view more.
- Middle East & Africa Fire Safety Systems & Equipment Market Click here to view more.
- GCC Drone Market Click here to view more.
- Middle East Lighting Fixture Market Click here to view more.
- GCC Physical & Perimeter Security Market Click here to view more.