Netherlands Purified Water Market (2025-2031) | Companies, Size & Revenue, Share, Forecast, Value, Competitive Landscape, Industry, Growth, Analysis, Outlook, Segmentation, Trends
Market Forecast By Category (Plain, Flavored), By Product (Still Bottle Water, Packaged Drinking Water, Functional Water Bottle, Flavored Bottled Water, Distilled Bottled Water, Carbonated Bottle Water), By Quality (Premium, Non-Premium), By Origin of Product (Public, Private), By Raw Material (Polyethylene Terephthalate (PET), Glass), By Pack Size (1501 ml and above, 1001 ml - 1500 ml, 501 ml - 1000 ml, 331 ml - 500ml, 330 ml), By Distribution Channel (Store-Based, Non-Store-Based), By End User Packaging (Plastic Bottle, Glass Bottle, Drum (Bulk)) And Competitive Landscape
| Product Code: ETC8547198 | Publication Date: Sep 2024 | Updated Date: Nov 2025 | Product Type: Market Research Report | |
| Publisher: 6Wresearch | Author: Dhaval Chaurasia | No. of Pages: 75 | No. of Figures: 35 | No. of Tables: 20 |
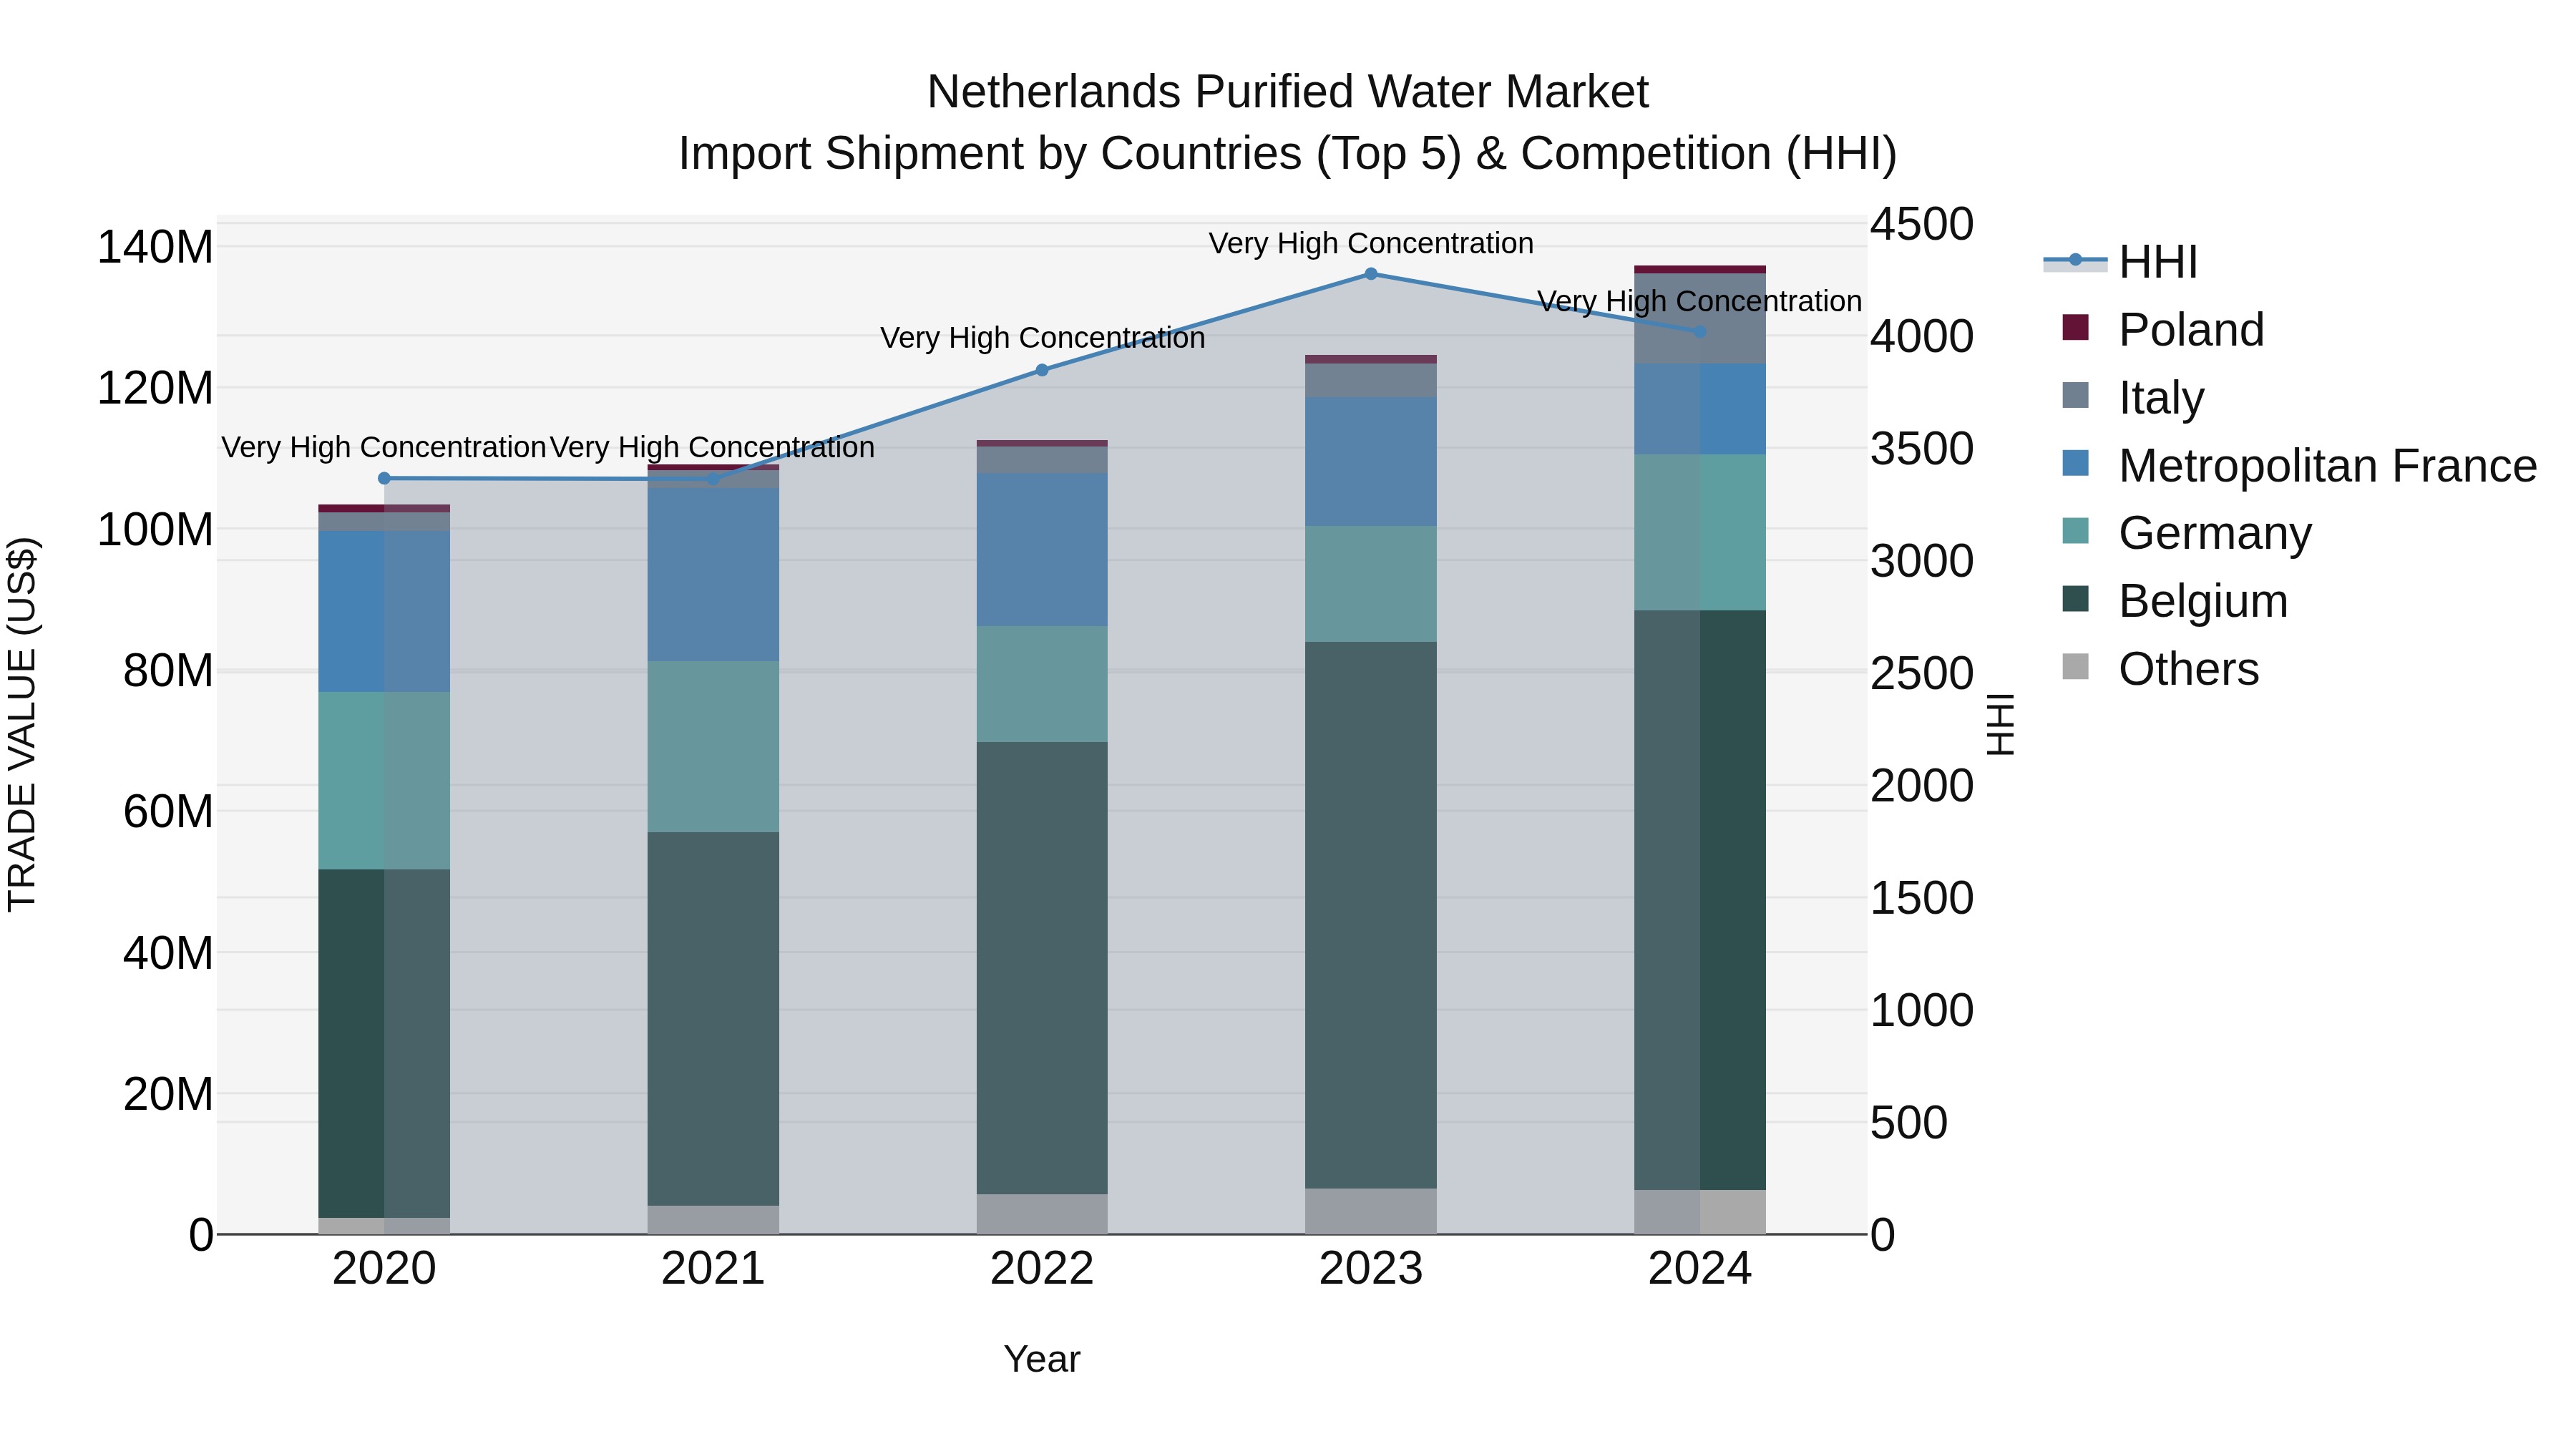
Netherlands Purified Water Market Import Shipment by Countries (Top 5) & Competition (HHI)
The Netherlands continues to be a key market for purified water imports, with top suppliers including Belgium, Germany, Metropolitan France, Italy, and the UK in 2024. Despite high concentration levels indicated by the Herfindahl-Hirschman Index (HHI), the market has shown steady growth with a Compound Annual Growth Rate (CAGR) of 7.32% from 2020 to 2024. The growth momentum remained strong in 2024 with a notable growth rate of 10.19% compared to the previous year, reflecting a robust demand for purified water in the Netherlands.
Key Highlights of the Report:
- Netherlands Purified Water Market Outlook
- Market Size of Netherlands Purified Water Market, 2024
- Forecast of Netherlands Purified Water Market, 2031
- Historical Data and Forecast of Netherlands Purified Water Revenues & Volume for the Period 2021- 2031
- Netherlands Purified Water Market Trend Evolution
- Netherlands Purified Water Market Drivers and Challenges
- Netherlands Purified Water Price Trends
- Netherlands Purified Water Porter's Five Forces
- Netherlands Purified Water Industry Life Cycle
- Historical Data and Forecast of Netherlands Purified Water Market Revenues & Volume By Category for the Period 2021- 2031
- Historical Data and Forecast of Netherlands Purified Water Market Revenues & Volume By Plain for the Period 2021- 2031
- Historical Data and Forecast of Netherlands Purified Water Market Revenues & Volume By Flavored for the Period 2021- 2031
- Historical Data and Forecast of Netherlands Purified Water Market Revenues & Volume By Product for the Period 2021- 2031
- Historical Data and Forecast of Netherlands Purified Water Market Revenues & Volume By Still Bottle Water for the Period 2021- 2031
- Historical Data and Forecast of Netherlands Purified Water Market Revenues & Volume By Packaged Drinking Water for the Period 2021- 2031
- Historical Data and Forecast of Netherlands Purified Water Market Revenues & Volume By Functional Water Bottle for the Period 2021- 2031
- Historical Data and Forecast of Netherlands Purified Water Market Revenues & Volume By Flavored Bottled Water for the Period 2021- 2031
- Historical Data and Forecast of Netherlands Purified Water Market Revenues & Volume By Distilled Bottled Water for the Period 2021- 2031
- Historical Data and Forecast of Netherlands Purified Water Market Revenues & Volume By Carbonated Bottle Water for the Period 2021- 2031
- Historical Data and Forecast of Netherlands Purified Water Market Revenues & Volume By Quality for the Period 2021- 2031
- Historical Data and Forecast of Netherlands Purified Water Market Revenues & Volume By Premium for the Period 2021- 2031
- Historical Data and Forecast of Netherlands Purified Water Market Revenues & Volume By Non-Premium for the Period 2021- 2031
- Historical Data and Forecast of Netherlands Purified Water Market Revenues & Volume By Origin of Product for the Period 2021- 2031
- Historical Data and Forecast of Netherlands Purified Water Market Revenues & Volume By Public for the Period 2021- 2031
- Historical Data and Forecast of Netherlands Purified Water Market Revenues & Volume By Private for the Period 2021- 2031
- Historical Data and Forecast of Netherlands Purified Water Market Revenues & Volume By Raw Material for the Period 2021- 2031
- Historical Data and Forecast of Netherlands Purified Water Market Revenues & Volume By Polyethylene Terephthalate (PET) for the Period 2021- 2031
- Historical Data and Forecast of Netherlands Purified Water Market Revenues & Volume By Glass for the Period 2021- 2031
- Historical Data and Forecast of Netherlands Purified Water Market Revenues & Volume By Pack Size for the Period 2021- 2031
- Historical Data and Forecast of Netherlands Purified Water Market Revenues & Volume By 1501 ml and above for the Period 2021- 2031
- Historical Data and Forecast of Netherlands Purified Water Market Revenues & Volume By 1001 ml - 1500 ml for the Period 2021- 2031
- Historical Data and Forecast of Netherlands Purified Water Market Revenues & Volume By 501 ml - 1000 ml for the Period 2021- 2031
- Historical Data and Forecast of Netherlands Purified Water Market Revenues & Volume By 331 ml - 500ml for the Period 2021- 2031
- Historical Data and Forecast of Netherlands Purified Water Market Revenues & Volume By 330 ml for the Period 2021- 2031
- Historical Data and Forecast of Netherlands Purified Water Market Revenues & Volume By Distribution Channel for the Period 2021- 2031
- Historical Data and Forecast of Netherlands Purified Water Market Revenues & Volume By Store-Based for the Period 2021- 2031
- Historical Data and Forecast of Netherlands Purified Water Market Revenues & Volume By Non-Store-Based for the Period 2021- 2031
- Historical Data and Forecast of Netherlands Purified Water Market Revenues & Volume By End User Packaging for the Period 2021- 2031
- Historical Data and Forecast of Netherlands Purified Water Market Revenues & Volume By Plastic Bottle for the Period 2021- 2031
- Historical Data and Forecast of Netherlands Purified Water Market Revenues & Volume By Glass Bottle for the Period 2021- 2031
- Historical Data and Forecast of Netherlands Purified Water Market Revenues & Volume By Drum (Bulk) for the Period 2021- 2031
- Netherlands Purified Water Import Export Trade Statistics
- Market Opportunity Assessment By Category
- Market Opportunity Assessment By Product
- Market Opportunity Assessment By Quality
- Market Opportunity Assessment By Origin of Product
- Market Opportunity Assessment By Raw Material
- Market Opportunity Assessment By Pack Size
- Market Opportunity Assessment By Distribution Channel
- Market Opportunity Assessment By End User Packaging
- Netherlands Purified Water Top Companies Market Share
- Netherlands Purified Water Competitive Benchmarking By Technical and Operational Parameters
- Netherlands Purified Water Company Profiles
- Netherlands Purified Water Key Strategic Recommendations
Frequently Asked Questions About the Market Study (FAQs):
6Wresearch actively monitors the Netherlands Purified Water Market and publishes its comprehensive annual report, highlighting emerging trends, growth drivers, revenue analysis, and forecast outlook. Our insights help businesses to make data-backed strategic decisions with ongoing market dynamics. Our analysts track relevent industries related to the Netherlands Purified Water Market, allowing our clients with actionable intelligence and reliable forecasts tailored to emerging regional needs.
Yes, we provide customisation as per your requirements. To learn more, feel free to contact us on sales@6wresearch.com
1 Executive Summary |
2 Introduction |
2.1 Key Highlights of the Report |
2.2 Report Description |
2.3 Market Scope & Segmentation |
2.4 Research Methodology |
2.5 Assumptions |
3 Netherlands Purified Water Market Overview |
3.1 Netherlands Country Macro Economic Indicators |
3.2 Netherlands Purified Water Market Revenues & Volume, 2021 & 2031F |
3.3 Netherlands Purified Water Market - Industry Life Cycle |
3.4 Netherlands Purified Water Market - Porter's Five Forces |
3.5 Netherlands Purified Water Market Revenues & Volume Share, By Category, 2021 & 2031F |
3.6 Netherlands Purified Water Market Revenues & Volume Share, By Product, 2021 & 2031F |
3.7 Netherlands Purified Water Market Revenues & Volume Share, By Quality, 2021 & 2031F |
3.8 Netherlands Purified Water Market Revenues & Volume Share, By Origin of Product, 2021 & 2031F |
3.9 Netherlands Purified Water Market Revenues & Volume Share, By Raw Material, 2021 & 2031F |
3.10 Netherlands Purified Water Market Revenues & Volume Share, By Pack Size, 2021 & 2031F |
3.11 Netherlands Purified Water Market Revenues & Volume Share, By Distribution Channel, 2021 & 2031F |
4 Netherlands Purified Water Market Dynamics |
4.1 Impact Analysis |
4.2 Market Drivers |
4.2.1 Increasing awareness about the importance of consuming purified water for health and well-being |
4.2.2 Growing concerns over water pollution and its impact on health |
4.2.3 Rise in disposable income leading to higher spending on premium water products |
4.3 Market Restraints |
4.3.1 Presence of alternative beverages like flavored water, juices, and soft drinks impacting the demand for purified water |
4.3.2 Regulatory challenges and compliance requirements for water purification processes |
5 Netherlands Purified Water Market Trends |
6 Netherlands Purified Water Market, By Types |
6.1 Netherlands Purified Water Market, By Category |
6.1.1 Overview and Analysis |
6.1.2 Netherlands Purified Water Market Revenues & Volume, By Category, 2021- 2031F |
6.1.3 Netherlands Purified Water Market Revenues & Volume, By Plain, 2021- 2031F |
6.1.4 Netherlands Purified Water Market Revenues & Volume, By Flavored, 2021- 2031F |
6.2 Netherlands Purified Water Market, By Product |
6.2.1 Overview and Analysis |
6.2.2 Netherlands Purified Water Market Revenues & Volume, By Still Bottle Water, 2021- 2031F |
6.2.3 Netherlands Purified Water Market Revenues & Volume, By Packaged Drinking Water, 2021- 2031F |
6.2.4 Netherlands Purified Water Market Revenues & Volume, By Functional Water Bottle, 2021- 2031F |
6.2.5 Netherlands Purified Water Market Revenues & Volume, By Flavored Bottled Water, 2021- 2031F |
6.2.6 Netherlands Purified Water Market Revenues & Volume, By Distilled Bottled Water, 2021- 2031F |
6.2.7 Netherlands Purified Water Market Revenues & Volume, By Carbonated Bottle Water, 2021- 2031F |
6.3 Netherlands Purified Water Market, By Quality |
6.3.1 Overview and Analysis |
6.3.2 Netherlands Purified Water Market Revenues & Volume, By Premium, 2021- 2031F |
6.3.3 Netherlands Purified Water Market Revenues & Volume, By Non-Premium, 2021- 2031F |
6.4 Netherlands Purified Water Market, By Origin of Product |
6.4.1 Overview and Analysis |
6.4.2 Netherlands Purified Water Market Revenues & Volume, By Public, 2021- 2031F |
6.4.3 Netherlands Purified Water Market Revenues & Volume, By Private, 2021- 2031F |
6.5 Netherlands Purified Water Market, By Raw Material |
6.5.1 Overview and Analysis |
6.5.2 Netherlands Purified Water Market Revenues & Volume, By Polyethylene Terephthalate (PET), 2021- 2031F |
6.5.3 Netherlands Purified Water Market Revenues & Volume, By Glass, 2021- 2031F |
6.6 Netherlands Purified Water Market, By Pack Size |
6.6.1 Overview and Analysis |
6.6.2 Netherlands Purified Water Market Revenues & Volume, By 1501 ml and above, 2021- 2031F |
6.6.3 Netherlands Purified Water Market Revenues & Volume, By 1001 ml - 1500 ml, 2021- 2031F |
6.6.4 Netherlands Purified Water Market Revenues & Volume, By 501 ml - 1000 ml, 2021- 2031F |
6.6.5 Netherlands Purified Water Market Revenues & Volume, By 331 ml - 500ml, 2021- 2031F |
6.6.6 Netherlands Purified Water Market Revenues & Volume, By 330 ml, 2021- 2031F |
6.7 Netherlands Purified Water Market, By Distribution Channel |
6.7.1 Overview and Analysis |
6.7.2 Netherlands Purified Water Market Revenues & Volume, By Store-Based, 2021- 2031F |
6.7.3 Netherlands Purified Water Market Revenues & Volume, By Non-Store-Based, 2021- 2031F |
6.8 Netherlands Purified Water Market, By End User Packaging |
6.8.1 Overview and Analysis |
6.8.2 Netherlands Purified Water Market Revenues & Volume, By Plastic Bottle, 2021- 2031F |
6.8.3 Netherlands Purified Water Market Revenues & Volume, By Glass Bottle, 2021- 2031F |
6.8.4 Netherlands Purified Water Market Revenues & Volume, By , 2021- 2031F |
7 Netherlands Purified Water Market Import-Export Trade Statistics |
7.1 Netherlands Purified Water Market Export to Major Countries |
7.2 Netherlands Purified Water Market Imports from Major Countries |
8 Netherlands Purified Water Market Key Performance Indicators |
8.1 Consumer perception and preference towards purified water |
8.2 Adoption rate of water purification technologies in households and commercial establishments |
8.3 Sustainability initiatives and certifications related to water sourcing and packaging materials |
9 Netherlands Purified Water Market - Opportunity Assessment |
9.1 Netherlands Purified Water Market Opportunity Assessment, By Category, 2021 & 2031F |
9.2 Netherlands Purified Water Market Opportunity Assessment, By Product, 2021 & 2031F |
9.3 Netherlands Purified Water Market Opportunity Assessment, By Quality, 2021 & 2031F |
9.4 Netherlands Purified Water Market Opportunity Assessment, By Origin of Product, 2021 & 2031F |
9.5 Netherlands Purified Water Market Opportunity Assessment, By Raw Material, 2021 & 2031F |
9.6 Netherlands Purified Water Market Opportunity Assessment, By Pack Size, 2021 & 2031F |
9.7 Netherlands Purified Water Market Opportunity Assessment, By Distribution Channel, 2021 & 2031F |
9.7 Netherlands Purified Water Market Opportunity Assessment, By End User Packaging, 2021 & 2031F |
10 Netherlands Purified Water Market - Competitive Landscape |
10.1 Netherlands Purified Water Market Revenue Share, By Companies, 2024 |
10.2 Netherlands Purified Water Market Competitive Benchmarking, By Operating and Technical Parameters |
11 Company Profiles |
12 Recommendations |
13 Disclaimer |
Global Go To Market Strategy - 2030
Export potential enables firms to identify high-growth global markets with greater confidence by combining advanced trade intelligence with a structured quantitative methodology. The framework analyzes emerging demand trends and country-level import patterns while integrating macroeconomic and trade datasets such as GDP and population forecasts, bilateral import–export flows, tariff structures, elasticity differentials between developed and developing economies, geographic distance, and import demand projections. Using weighted trade values from 2020–2024 as the base period to project country-to-country export potential for 2030, these inputs are operationalized through calculated drivers such as gravity model parameters, tariff impact factors, and projected GDP per-capita growth. Through an analysis of hidden potentials, demand hotspots, and market conditions that are most favorable to success, this method enables firms to focus on target countries, maximize returns, and global expansion with data, backed by accuracy.
By factoring in the projected importer demand gap that is currently unmet and could be potential opportunity, it identifies the potential for the Exporter (Country) among 190 countries, against the general trade analysis, which identifies the biggest importer or exporter.
To discover high-growth global markets and optimize your business strategy:
Click Here
Pricing
- Single User License$ 1,995
- Department License$ 2,400
- Site License$ 3,120
- Global License$ 3,795

Leadership Perspectives from Industry Events
Search
Thought Leadership and Analyst Meet


Our Clients
6WResearch In News
- Doha a strategic location for EV manufacturing hub: IPA Qatar
- Demand for luxury TVs surging in the GCC, says Samsung
- Empowering Growth: The Thriving Journey of Bangladesh’s Cable Industry
- Demand for luxury TVs surging in the GCC, says Samsung
- Video call with a traditional healer? Once unthinkable, it’s now common in South Africa
- Intelligent Buildings To Smooth GCC’s Path To Net Zero
Latest Reports
- Taiwan Airport Wireless Infrastructure Market (2026-2032)
- Vietnam Airport Wireless Infrastructure Market (2026-2032)
- Thailand Airport Wireless Infrastructure Market (2026-2032)
- South Korea Airport Wireless Infrastructure Market (2026-2032)
- Romania Airport Wireless Infrastructure Market (2026-2032)
- Qatar Airport Wireless Infrastructure Market (2026-2032)
- Philippines Airport Wireless Infrastructure Market (2026-2032)
- Japan Airport Wireless Infrastructure Market (2026-2032)
- Taiwan Airport Winter Services Market (2026-2032)
- Vietnam Airport Winter Services Market (2026-2032)
Industry Events and Analyst Meet

HIMTEX 2026

India Refining Summit 2026

India EV Show 2026

EV tech India Expo 2026

Auto Tech Asia 2026
Whitepaper
- Middle East & Africa Commercial Security Market Click here to view more.
- Middle East & Africa Fire Safety Systems & Equipment Market Click here to view more.
- GCC Drone Market Click here to view more.
- Middle East Lighting Fixture Market Click here to view more.
- GCC Physical & Perimeter Security Market Click here to view more.