Netherlands Smart Well Market (2025-2031) | Share, Size, Opportunities, Demand, Pricing Analysis, Supply, Segments, Segmentation, Investment Trends, Restraints, Analysis, Revenue, Strategic Insights, Challenges, Industry, Strategy, Competition, Forecast, Consumer Insights, Value, Companies, Outlook, Growth, Competitive, Trends, Drivers
Market Forecast By Well Type (Oil & Gas Smart Wells, Smart Water Wells, Geothermal Smart Wells, Industrial Smart Wells, Smart Injection Wells), By Monitoring Features (Real-Time Pressure Sensors, AI Water Purification, Thermal Monitoring, AI Leak Detection, Fluid Composition Sensors), By AI & IoT Integration (Predictive Maintenance, Automated Flow Control, AI-Based Optimization, IoT-Based Data Logging, Automated Reporting), By Application Areas (Energy & Power Plants, Drinking Water Supply, Geothermal Power Generation, Manufacturing & Processing Plants, Carbon Capture & Storage), By Sustainability & Efficiency (Reduced Carbon Footprint, Renewable Energy-Powered Wells, Blockchain Data Logging, IoT-Connected Infrastructure, AI-Powered Sustainability Models) And Competitive Landscape
| Product Code: ETC10841484 | Publication Date: Apr 2025 | Updated Date: Nov 2025 | Product Type: Market Research Report | |
| Publisher: 6Wresearch | Author: Ravi Bhandari | No. of Pages: 65 | No. of Figures: 34 | No. of Tables: 19 |
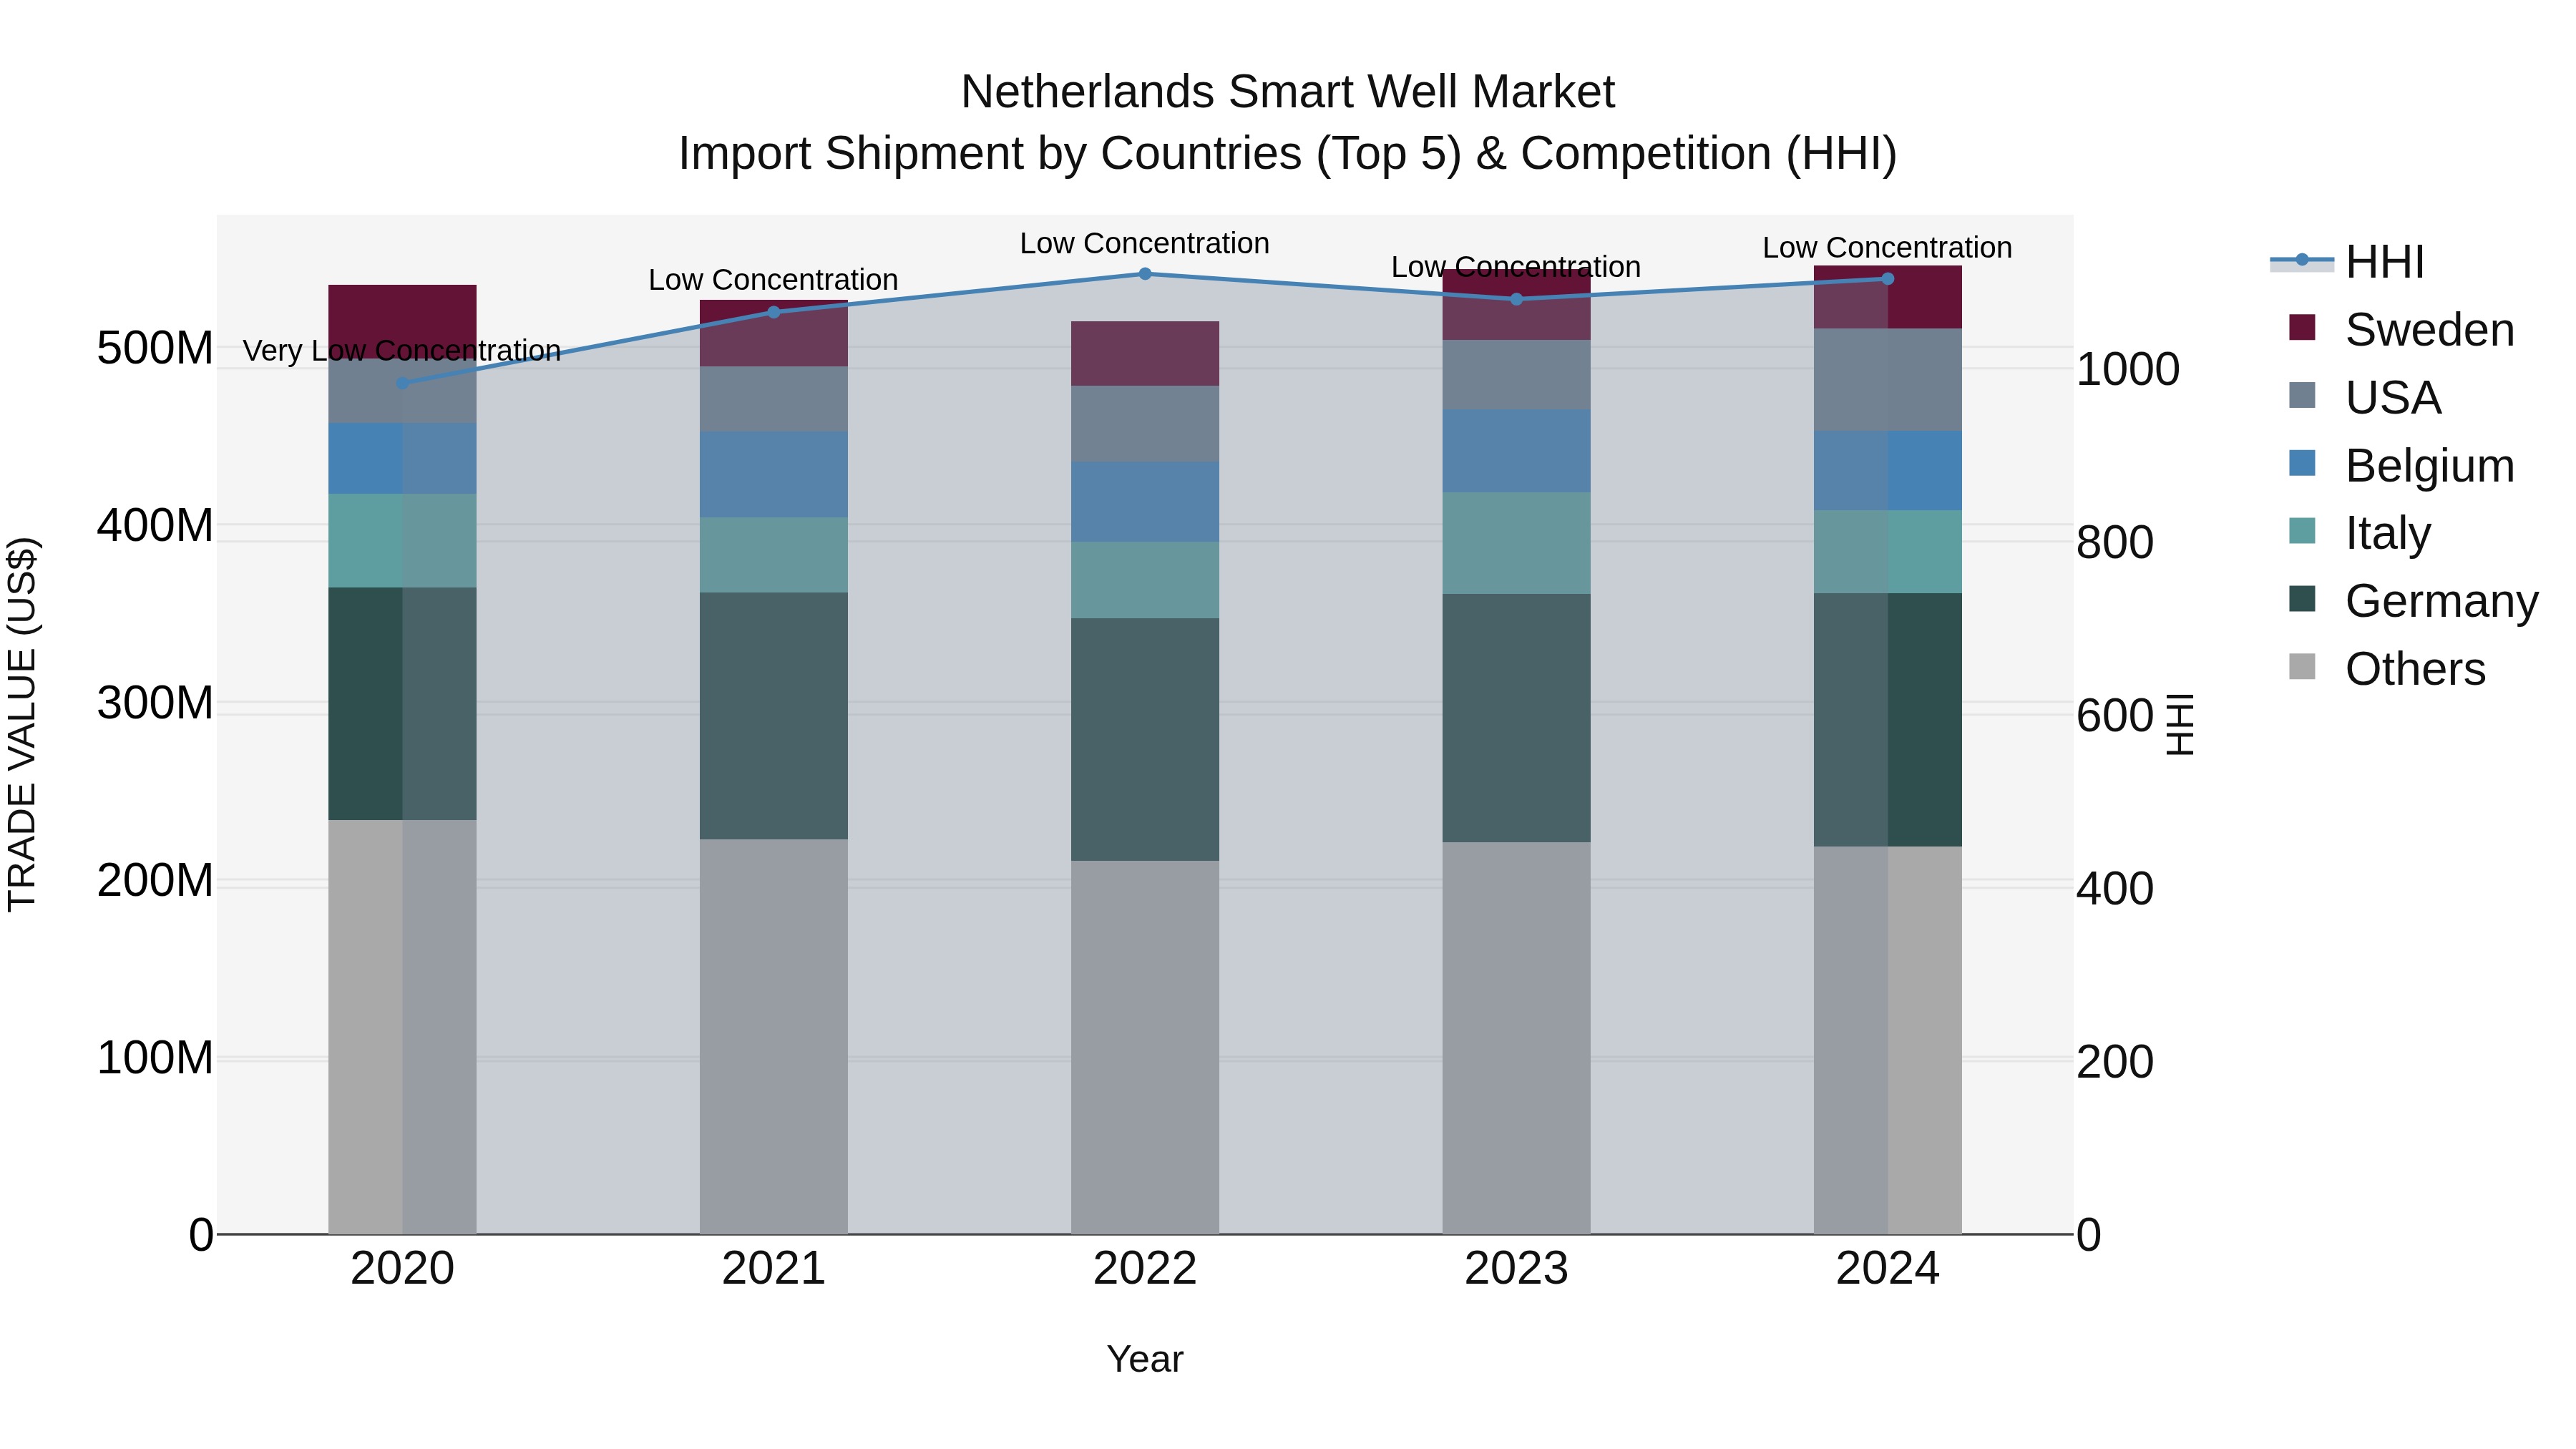
Netherlands Smart Well Market Top 5 Importing Countries and Market Competition (HHI) Analysis
The Netherlands continues to see steady growth in smart well imports, with top exporting countries including Germany, USA, Italy, Belgium, and Sweden. The market remains competitive with low concentration as indicated by the Herfindahl-Hirschman Index (HHI) in 2024. The compound annual growth rate (CAGR) from 2020 to 2024 stands at 0.49%, with a growth rate of 0.32% from 2023 to 2024, reflecting a stable and consistent upward trajectory in the smart well import market in the Netherlands.
Netherlands Smart Well Market Overview
The Netherlands smart well market is experiencing significant growth driven by advancements in technology, increasing focus on sustainability, and the need for efficient oil and gas production. Smart well technology allows for real-time monitoring and control of well operations, optimizing production and reducing costs. Key players in the market are investing in research and development to enhance smart well capabilities, including sensors, automation, and data analytics. The Netherlands, known for its expertise in the oil and gas industry, is well-positioned to capitalize on the smart well trend. Regulatory support for smart well deployment, coupled with a strong network of technology providers and service companies, further fuels market expansion. Overall, the Netherlands smart well market presents lucrative opportunities for stakeholders looking to improve operational efficiency and maximize production output in the energy sector.
Netherlands Smart Well Market Trends
The Netherlands smart well market is experiencing growth driven by increasing adoption of digital oilfield technologies and the need for enhanced production efficiency. Key trends in the market include the integration of advanced sensors and monitoring systems to optimize well performance, the use of artificial intelligence and machine learning for predictive maintenance and reservoir management, and the deployment of smart well technologies for real-time data analysis and decision-making. Companies are also focusing on developing smart well solutions that are cost-effective and environmentally sustainable, aligning with the Netherlands` commitment to renewable energy and sustainability. Overall, the smart well market in the Netherlands is poised for further expansion as operators seek to maximize production and minimize operational costs through innovative digital solutions.
Netherlands Smart Well Market Challenges
In the Netherlands smart well market, some challenges include regulatory hurdles, limited infrastructure for smart well technology implementation, and the high initial investment required for setting up smart well systems. The regulatory environment in the Netherlands can be complex and may require extensive approvals for the deployment of smart well technology, leading to delays and increased costs for companies operating in this market. Additionally, the lack of existing infrastructure tailored for smart well systems can pose logistical challenges and necessitate significant modifications to existing oil and gas operations. The high costs associated with implementing smart well technology, including the installation of sensors, data analytics software, and monitoring equipment, can also act as a barrier to entry for smaller companies or operators with limited budgets, potentially limiting the growth of the smart well market in the Netherlands.
Netherlands Smart Well Market Investment Opportunities
The Netherlands smart well market presents promising investment opportunities in the realm of advanced oil and gas production technologies. With the country`s rich history in the energy sector and its commitment to sustainability, there is a growing demand for smart well solutions that optimize operations, enhance efficiency, and reduce environmental impact. Investors can explore opportunities in companies specializing in smart well automation, data analytics, and remote monitoring systems to capitalize on the increasing adoption of digital technologies in the oil and gas industry. Additionally, partnerships with Dutch research institutions and government initiatives focused on energy innovation can provide valuable resources and support for companies looking to establish a presence in the Netherlands smart well market.
Netherlands Smart Well Market Government Policy
In the Netherlands, the smart well market is influenced by various government policies aimed at promoting sustainable energy production and efficient water management. The government has implemented initiatives such as the Energy Agreement for Sustainable Growth and the Climate Agreement, which set targets for reducing greenhouse gas emissions and increasing the share of renewable energy sources. Additionally, the Dutch government provides financial incentives and subsidies for companies investing in smart well technologies that enhance energy efficiency and water conservation. Regulations such as the Environmental Management Act and the Water Act also play a role in ensuring the responsible implementation of smart well solutions. Overall, the government`s policies create a favorable environment for the growth of the smart well market in the Netherlands.
Netherlands Smart Well Market Future Outlook
The Netherlands smart well market is poised for significant growth in the coming years due to increasing adoption of advanced technologies in the oil and gas industry. Smart well systems offer operational efficiency, improved reservoir management, and real-time monitoring capabilities, driving their demand among oil and gas companies in the region. The Netherlands` strategic location as a key player in the European energy market further enhances the market potential for smart well technologies. Additionally, government initiatives promoting digitalization and sustainability in the energy sector are expected to propel the growth of the smart well market in the Netherlands. As smart well technology continues to evolve and become more cost-effective, we can anticipate a steady increase in investments and deployments of smart well systems in the country over the forecast period.
Key Highlights of the Report:
- Netherlands Smart Well Market Outlook
- Market Size of Netherlands Smart Well Market,2024
- Forecast of Netherlands Smart Well Market, 2031
- Historical Data and Forecast of Netherlands Smart Well Revenues & Volume for the Period 2021-2031
- Netherlands Smart Well Market Trend Evolution
- Netherlands Smart Well Market Drivers and Challenges
- Netherlands Smart Well Price Trends
- Netherlands Smart Well Porter's Five Forces
- Netherlands Smart Well Industry Life Cycle
- Historical Data and Forecast of Netherlands Smart Well Market Revenues & Volume By Well Type for the Period 2021-2031
- Historical Data and Forecast of Netherlands Smart Well Market Revenues & Volume By Oil & Gas Smart Wells for the Period 2021-2031
- Historical Data and Forecast of Netherlands Smart Well Market Revenues & Volume By Smart Water Wells for the Period 2021-2031
- Historical Data and Forecast of Netherlands Smart Well Market Revenues & Volume By Geothermal Smart Wells for the Period 2021-2031
- Historical Data and Forecast of Netherlands Smart Well Market Revenues & Volume By Industrial Smart Wells for the Period 2021-2031
- Historical Data and Forecast of Netherlands Smart Well Market Revenues & Volume By Smart Injection Wells for the Period 2021 - 2029
- Historical Data and Forecast of Netherlands Smart Well Market Revenues & Volume By Monitoring Features for the Period 2021-2031
- Historical Data and Forecast of Netherlands Smart Well Market Revenues & Volume By Real-Time Pressure Sensors for the Period 2021-2031
- Historical Data and Forecast of Netherlands Smart Well Market Revenues & Volume By AI Water Purification for the Period 2021-2031
- Historical Data and Forecast of Netherlands Smart Well Market Revenues & Volume By Thermal Monitoring for the Period 2021-2031
- Historical Data and Forecast of Netherlands Smart Well Market Revenues & Volume By AI Leak Detection for the Period 2021-2031
- Historical Data and Forecast of Netherlands Smart Well Market Revenues & Volume By Fluid Composition Sensors for the Period 2021 - 2029
- Historical Data and Forecast of Netherlands Smart Well Market Revenues & Volume By AI & IoT Integration for the Period 2021-2031
- Historical Data and Forecast of Netherlands Smart Well Market Revenues & Volume By Predictive Maintenance for the Period 2021-2031
- Historical Data and Forecast of Netherlands Smart Well Market Revenues & Volume By Automated Flow Control for the Period 2021-2031
- Historical Data and Forecast of Netherlands Smart Well Market Revenues & Volume By AI-Based Optimization for the Period 2021-2031
- Historical Data and Forecast of Netherlands Smart Well Market Revenues & Volume By IoT-Based Data Logging for the Period 2021-2031
- Historical Data and Forecast of Netherlands Smart Well Market Revenues & Volume By Automated Reporting for the Period 2021 - 2029
- Historical Data and Forecast of Netherlands Smart Well Market Revenues & Volume By Application Areas for the Period 2021-2031
- Historical Data and Forecast of Netherlands Smart Well Market Revenues & Volume By Energy & Power Plants for the Period 2021-2031
- Historical Data and Forecast of Netherlands Smart Well Market Revenues & Volume By Drinking Water Supply for the Period 2021-2031
- Historical Data and Forecast of Netherlands Smart Well Market Revenues & Volume By Geothermal Power Generation for the Period 2021-2031
- Historical Data and Forecast of Netherlands Smart Well Market Revenues & Volume By Manufacturing & Processing Plants for the Period 2021-2031
- Historical Data and Forecast of Netherlands Smart Well Market Revenues & Volume By Carbon Capture & Storage for the Period 2021 - 2029
- Historical Data and Forecast of Netherlands Smart Well Market Revenues & Volume By Sustainability & Efficiency for the Period 2021-2031
- Historical Data and Forecast of Netherlands Smart Well Market Revenues & Volume By Reduced Carbon Footprint for the Period 2021-2031
- Historical Data and Forecast of Netherlands Smart Well Market Revenues & Volume By Renewable Energy-Powered Wells for the Period 2021-2031
- Historical Data and Forecast of Netherlands Smart Well Market Revenues & Volume By Blockchain Data Logging for the Period 2021-2031
- Historical Data and Forecast of Netherlands Smart Well Market Revenues & Volume By IoT-Connected Infrastructure for the Period 2021 - 2029
- Historical Data and Forecast of Netherlands Smart Well Market Revenues & Volume By AI-Powered Sustainability Models for the Period 2021 - 2029
- Netherlands Smart Well Import Export Trade Statistics
- Market Opportunity Assessment By Well Type
- Market Opportunity Assessment By Monitoring Features
- Market Opportunity Assessment By AI & IoT Integration
- Market Opportunity Assessment By Application Areas
- Market Opportunity Assessment By Sustainability & Efficiency
- Netherlands Smart Well Top Companies Market Share
- Netherlands Smart Well Competitive Benchmarking By Technical and Operational Parameters
- Netherlands Smart Well Company Profiles
- Netherlands Smart Well Key Strategic Recommendations
Frequently Asked Questions About the Market Study (FAQs):
6Wresearch actively monitors the Netherlands Smart Well Market and publishes its comprehensive annual report, highlighting emerging trends, growth drivers, revenue analysis, and forecast outlook. Our insights help businesses to make data-backed strategic decisions with ongoing market dynamics. Our analysts track relevent industries related to the Netherlands Smart Well Market, allowing our clients with actionable intelligence and reliable forecasts tailored to emerging regional needs.
Yes, we provide customisation as per your requirements. To learn more, feel free to contact us on sales@6wresearch.com
1 Executive Summary |
2 Introduction |
2.1 Key Highlights of the Report |
2.2 Report Description |
2.3 Market Scope & Segmentation |
2.4 Research Methodology |
2.5 Assumptions |
3 Netherlands Smart Well Market Overview |
3.1 Netherlands Country Macro Economic Indicators |
3.2 Netherlands Smart Well Market Revenues & Volume, 2021 & 2031F |
3.3 Netherlands Smart Well Market - Industry Life Cycle |
3.4 Netherlands Smart Well Market - Porter's Five Forces |
3.5 Netherlands Smart Well Market Revenues & Volume Share, By Well Type, 2021 & 2031F |
3.6 Netherlands Smart Well Market Revenues & Volume Share, By Monitoring Features, 2021 & 2031F |
3.7 Netherlands Smart Well Market Revenues & Volume Share, By AI & IoT Integration, 2021 & 2031F |
3.8 Netherlands Smart Well Market Revenues & Volume Share, By Application Areas, 2021 & 2031F |
3.9 Netherlands Smart Well Market Revenues & Volume Share, By Sustainability & Efficiency, 2021 & 2031F |
4 Netherlands Smart Well Market Dynamics |
4.1 Impact Analysis |
4.2 Market Drivers |
4.2.1 Increasing demand for efficient oil and gas production techniques |
4.2.2 Growing focus on maximizing oil recovery rates |
4.2.3 Government initiatives to promote smart well technology adoption |
4.3 Market Restraints |
4.3.1 High initial investment costs for implementing smart well technology |
4.3.2 Lack of skilled professionals in the smart well industry |
4.3.3 Concerns regarding data security and cyber threats in smart well systems |
5 Netherlands Smart Well Market Trends |
6 Netherlands Smart Well Market, By Types |
6.1 Netherlands Smart Well Market, By Well Type |
6.1.1 Overview and Analysis |
6.1.2 Netherlands Smart Well Market Revenues & Volume, By Well Type, 2021 - 2031F |
6.1.3 Netherlands Smart Well Market Revenues & Volume, By Oil & Gas Smart Wells, 2021 - 2031F |
6.1.4 Netherlands Smart Well Market Revenues & Volume, By Smart Water Wells, 2021 - 2031F |
6.1.5 Netherlands Smart Well Market Revenues & Volume, By Geothermal Smart Wells, 2021 - 2031F |
6.1.6 Netherlands Smart Well Market Revenues & Volume, By Industrial Smart Wells, 2021 - 2031F |
6.1.7 Netherlands Smart Well Market Revenues & Volume, By Smart Injection Wells, 2021 - 2031F |
6.2 Netherlands Smart Well Market, By Monitoring Features |
6.2.1 Overview and Analysis |
6.2.2 Netherlands Smart Well Market Revenues & Volume, By Real-Time Pressure Sensors, 2021 - 2031F |
6.2.3 Netherlands Smart Well Market Revenues & Volume, By AI Water Purification, 2021 - 2031F |
6.2.4 Netherlands Smart Well Market Revenues & Volume, By Thermal Monitoring, 2021 - 2031F |
6.2.5 Netherlands Smart Well Market Revenues & Volume, By AI Leak Detection, 2021 - 2031F |
6.2.6 Netherlands Smart Well Market Revenues & Volume, By Fluid Composition Sensors, 2021 - 2031F |
6.3 Netherlands Smart Well Market, By AI & IoT Integration |
6.3.1 Overview and Analysis |
6.3.2 Netherlands Smart Well Market Revenues & Volume, By Predictive Maintenance, 2021 - 2031F |
6.3.3 Netherlands Smart Well Market Revenues & Volume, By Automated Flow Control, 2021 - 2031F |
6.3.4 Netherlands Smart Well Market Revenues & Volume, By AI-Based Optimization, 2021 - 2031F |
6.3.5 Netherlands Smart Well Market Revenues & Volume, By IoT-Based Data Logging, 2021 - 2031F |
6.3.6 Netherlands Smart Well Market Revenues & Volume, By Automated Reporting, 2021 - 2031F |
6.4 Netherlands Smart Well Market, By Application Areas |
6.4.1 Overview and Analysis |
6.4.2 Netherlands Smart Well Market Revenues & Volume, By Energy & Power Plants, 2021 - 2031F |
6.4.3 Netherlands Smart Well Market Revenues & Volume, By Drinking Water Supply, 2021 - 2031F |
6.4.4 Netherlands Smart Well Market Revenues & Volume, By Geothermal Power Generation, 2021 - 2031F |
6.4.5 Netherlands Smart Well Market Revenues & Volume, By Manufacturing & Processing Plants, 2021 - 2031F |
6.4.6 Netherlands Smart Well Market Revenues & Volume, By Carbon Capture & Storage, 2021 - 2031F |
6.5 Netherlands Smart Well Market, By Sustainability & Efficiency |
6.5.1 Overview and Analysis |
6.5.2 Netherlands Smart Well Market Revenues & Volume, By Reduced Carbon Footprint, 2021 - 2031F |
6.5.3 Netherlands Smart Well Market Revenues & Volume, By Renewable Energy-Powered Wells, 2021 - 2031F |
6.5.4 Netherlands Smart Well Market Revenues & Volume, By Blockchain Data Logging, 2021 - 2031F |
6.5.5 Netherlands Smart Well Market Revenues & Volume, By IoT-Connected Infrastructure, 2021 - 2031F |
6.5.6 Netherlands Smart Well Market Revenues & Volume, By AI-Powered Sustainability Models, 2021 - 2031F |
7 Netherlands Smart Well Market Import-Export Trade Statistics |
7.1 Netherlands Smart Well Market Export to Major Countries |
7.2 Netherlands Smart Well Market Imports from Major Countries |
8 Netherlands Smart Well Market Key Performance Indicators |
8.1 Average percentage increase in oil recovery rates achieved through smart well technology |
8.2 Number of new smart well projects initiated in the Netherlands |
8.3 Rate of adoption of smart well technology among oil and gas companies in the region |
9 Netherlands Smart Well Market - Opportunity Assessment |
9.1 Netherlands Smart Well Market Opportunity Assessment, By Well Type, 2021 & 2031F |
9.2 Netherlands Smart Well Market Opportunity Assessment, By Monitoring Features, 2021 & 2031F |
9.3 Netherlands Smart Well Market Opportunity Assessment, By AI & IoT Integration, 2021 & 2031F |
9.4 Netherlands Smart Well Market Opportunity Assessment, By Application Areas, 2021 & 2031F |
9.5 Netherlands Smart Well Market Opportunity Assessment, By Sustainability & Efficiency, 2021 & 2031F |
10 Netherlands Smart Well Market - Competitive Landscape |
10.1 Netherlands Smart Well Market Revenue Share, By Companies, 2024 |
10.2 Netherlands Smart Well Market Competitive Benchmarking, By Operating and Technical Parameters |
11 Company Profiles |
12 Recommendations |
13 Disclaimer |
Global Go To Market Strategy - 2030
Export potential enables firms to identify high-growth global markets with greater confidence by combining advanced trade intelligence with a structured quantitative methodology. The framework analyzes emerging demand trends and country-level import patterns while integrating macroeconomic and trade datasets such as GDP and population forecasts, bilateral import–export flows, tariff structures, elasticity differentials between developed and developing economies, geographic distance, and import demand projections. Using weighted trade values from 2020–2024 as the base period to project country-to-country export potential for 2030, these inputs are operationalized through calculated drivers such as gravity model parameters, tariff impact factors, and projected GDP per-capita growth. Through an analysis of hidden potentials, demand hotspots, and market conditions that are most favorable to success, this method enables firms to focus on target countries, maximize returns, and global expansion with data, backed by accuracy.
By factoring in the projected importer demand gap that is currently unmet and could be potential opportunity, it identifies the potential for the Exporter (Country) among 190 countries, against the general trade analysis, which identifies the biggest importer or exporter.
To discover high-growth global markets and optimize your business strategy:
Click Here
Pricing
- Single User License$ 1,995
- Department License$ 2,400
- Site License$ 3,120
- Global License$ 3,795

Leadership Perspectives from Industry Events
Search
Thought Leadership and Analyst Meet


Our Clients
6WResearch In News
- India Air Conditioner Market Set for Strong Rebound in 2026 After Weather-Led Correction and GST-Driven Recovery: 6Wresearch
- ADAS in India: How Automatic Emergency Braking, Blind Spot Detection & Driver Monitoring are Transforming Road Safety
- Doha a strategic location for EV manufacturing hub: IPA Qatar
- Demand for luxury TVs surging in the GCC, says Samsung
- Empowering Growth: The Thriving Journey of Bangladesh’s Cable Industry
- Demand for luxury TVs surging in the GCC, says Samsung
Latest Reports
- Poland Fire Protection Systems Market (2026-2032)
- Cape Verde Portable Hand-Thrown Extinguisher Market (2026-2032)
- Canada Portable Hand-Thrown Extinguisher Market (2026-2032)
- Cameroon Portable Hand-Thrown Extinguisher Market (2026-2032)
- Burundi Portable Hand-Thrown Extinguisher Market (2026-2032)
- Burkina Faso Portable Hand-Thrown Extinguisher Market (2026-2032)
- Bulgaria Portable Hand-Thrown Extinguisher Market (2026-2032)
- Brunei Portable Hand-Thrown Extinguisher Market (2026-2032)
- Botswana Portable Hand-Thrown Extinguisher Market (2026-2032)
- Bosnia and Herzegovina Portable Hand-Thrown Extinguisher Market (2026-2032)
Industry Events and Analyst Meet

HIMTEX 2026

India Refining Summit 2026

India EV Show 2026

EV tech India Expo 2026

Auto Tech Asia 2026
Whitepaper
- Middle East & Africa Commercial Security Market Click here to view more.
- Middle East & Africa Fire Safety Systems & Equipment Market Click here to view more.
- GCC Drone Market Click here to view more.
- Middle East Lighting Fixture Market Click here to view more.
- GCC Physical & Perimeter Security Market Click here to view more.