New Zealand Clay Market (2025-2031) | Industry, Companies, Outlook, Revenue, Segmentation, Share, Analysis, Trends, Growth, Size, Value & Forecast
Market Forecast By Application (Tableware, Sanitary ware, Medical applications), By End Use (Ceramic and, Non-ceramic) And Competitive Landscape
| Product Code: ETC5257701 | Publication Date: Nov 2023 | Updated Date: Nov 2025 | Product Type: Market Research Report | |
| Publisher: 6Wresearch | Author: Bhawna Singh | No. of Pages: 60 | No. of Figures: 30 | No. of Tables: 5 |
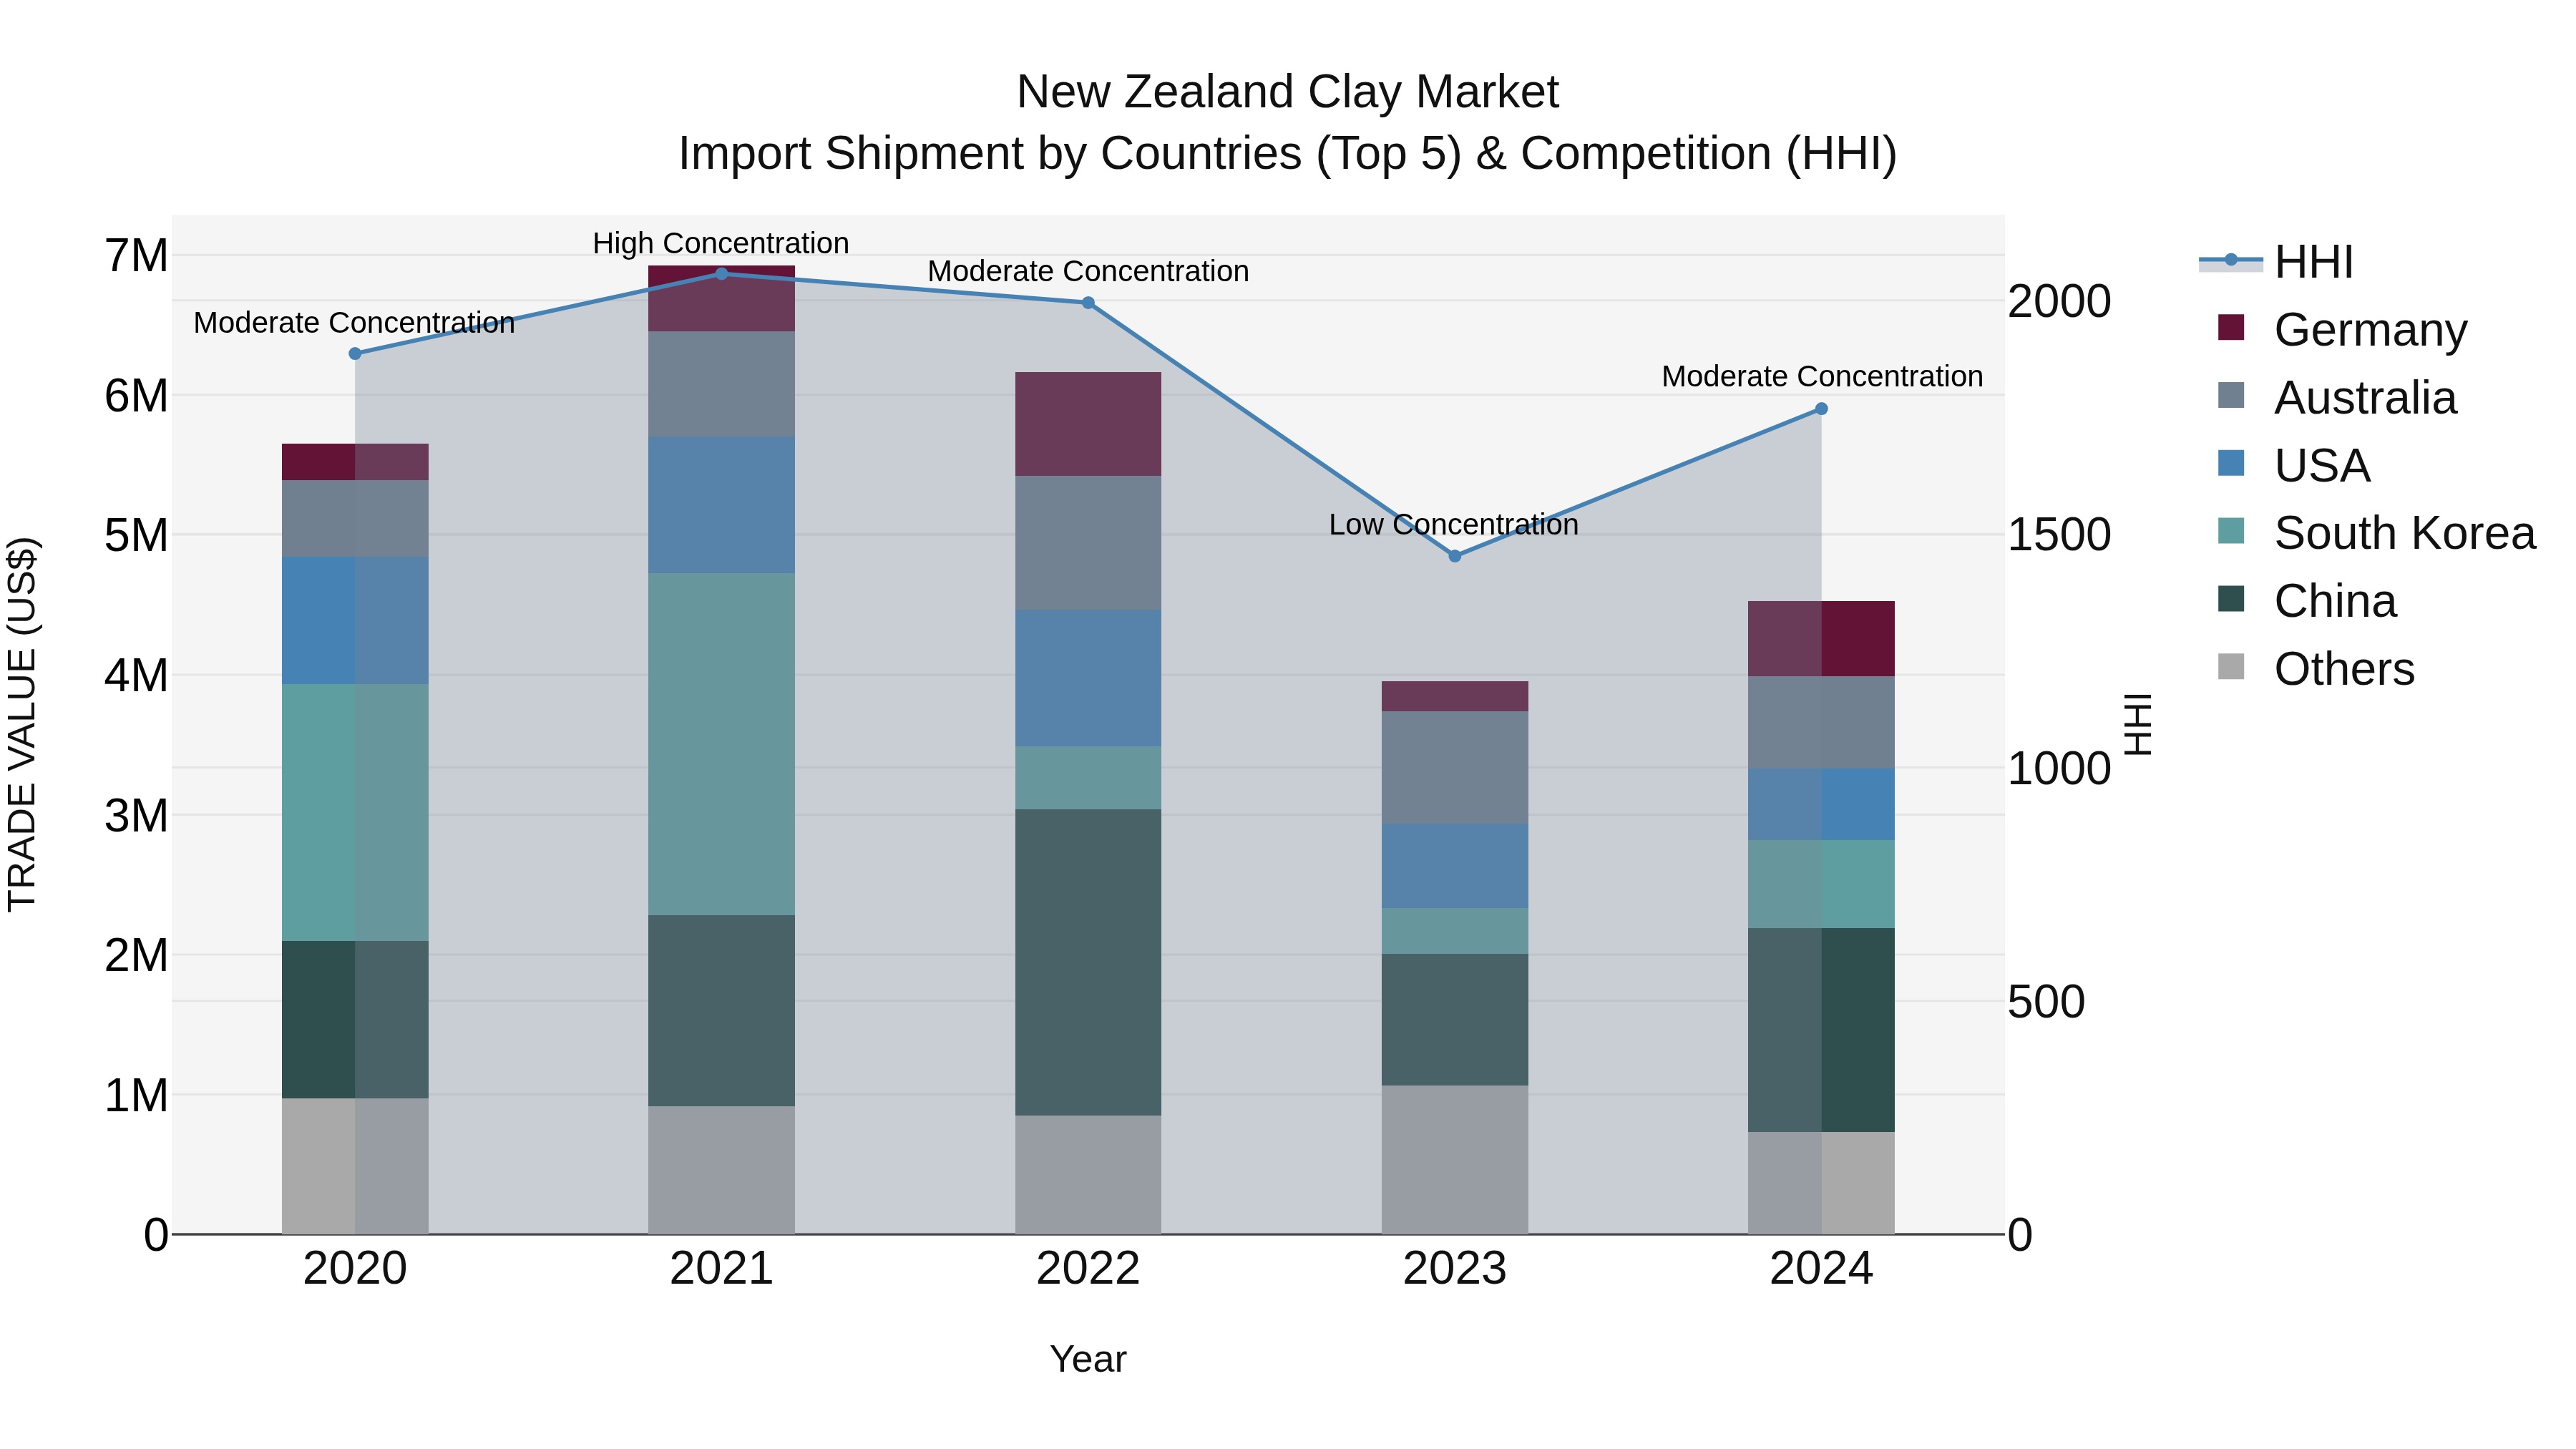
New Zealand Clay Market Top 5 Importing Countries and Market Competition (HHI) Analysis
New Zealand`s clay import market saw significant growth in 2024, with top exporting countries being China, Australia, South Korea, Germany, and the USA. The market experienced a shift from low to moderate concentration, indicating increased competition among suppliers. Despite a negative compound annual growth rate (CAGR) from 2020 to 2024, the market rebounded strongly in 2024 with a growth rate of 14.49% compared to the previous year. This suggests a promising outlook for the New Zealand clay import industry and potential opportunities for both domestic and international suppliers.
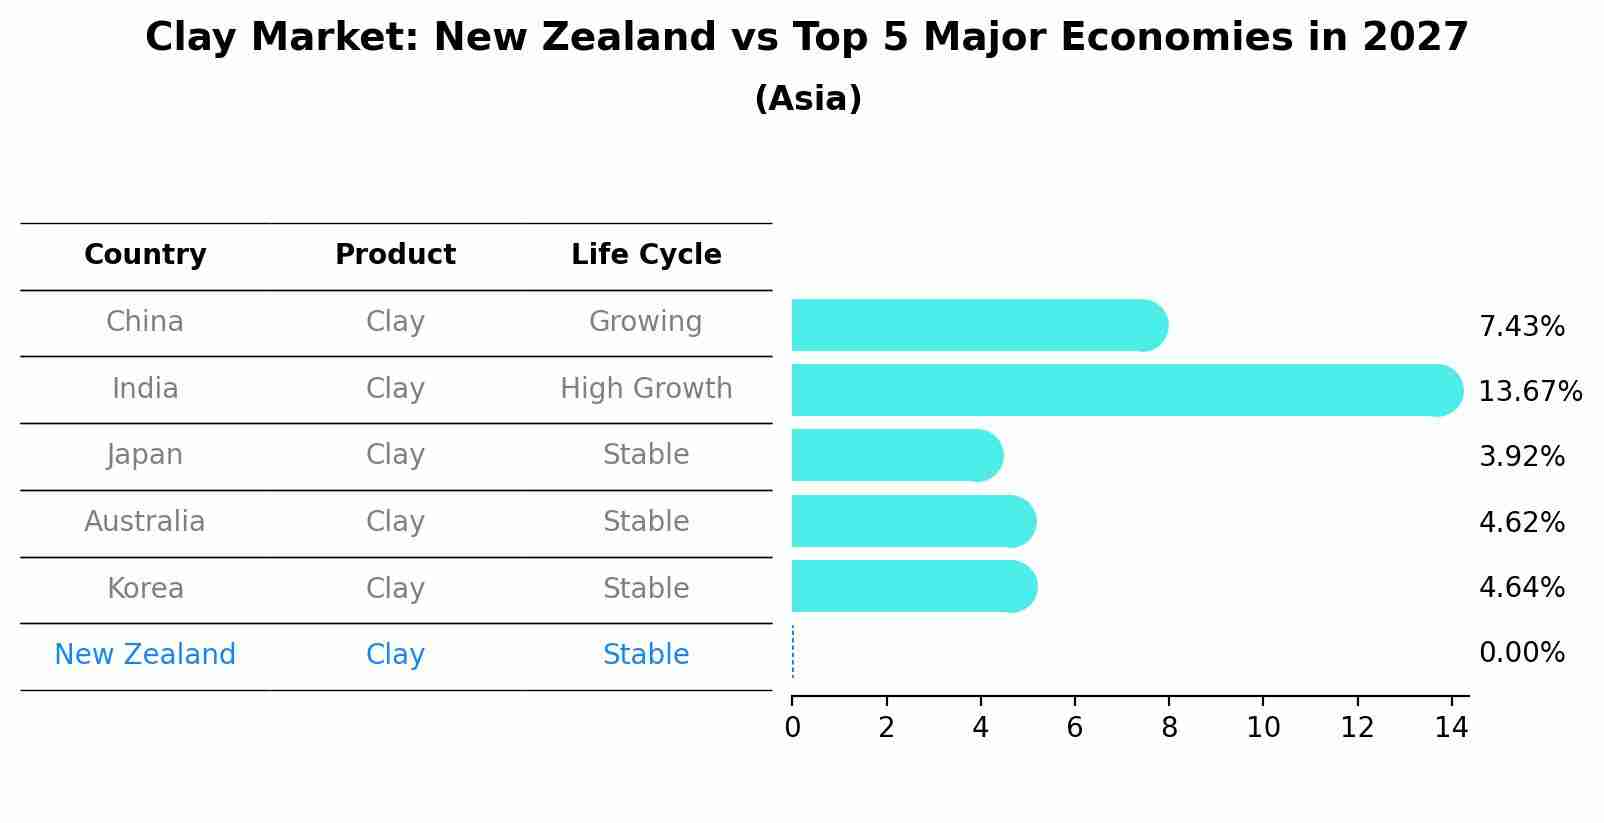
Clay Market: New Zealand vs Top 5 Major Economies in 2027 (Asia)
New Zealand's Clay market is anticipated to experience a stable growth rate of 0.00% by 2027, reflecting trends observed in the largest economy China, followed by India, Japan, Australia and South Korea.
New Zealand Clay Market Overview
New Zealand clay and refractories market plays a crucial role in supporting various industries, including construction, ceramics, and metallurgy. The demand for clay products and refractories is influenced by factors such as infrastructure development, urbanization, and industrial expansion. Manufacturers in this sector are constantly innovating to enhance product performance, durability, and sustainability to meet the evolving requirements of end-users.
Drivers of the market
Clay is a versatile material with applications ranging from construction and ceramics to cosmetics and pharmaceuticals. In New Zealand, the clay market is influenced by factors such as infrastructure development, urbanization, and the construction industry`s demand for raw materials. Additionally, the growing popularity of handmade pottery and artisanal ceramics is contributing to the growth of the clay market.
Challenges of the market
Challenges within the New Zealand clay market revolve around sourcing quality clay reserves and managing environmental impacts associated with extraction and processing. Competition from alternative materials and fluctuations in construction and manufacturing demand further contribute to market uncertainties.
Government Policy of the market
The New Zealand clay market is regulated to ensure sustainable extraction practices and environmental protection. Government agencies oversee clay mining operations to minimize environmental impact and promote rehabilitation of mining sites. Quality standards are in place to maintain the suitability of clay for various industrial and commercial applications.
Key Highlights of the Report:
- New Zealand Clay Market Outlook
- Market Size of New Zealand Clay Market, 2024
- Forecast of New Zealand Clay Market, 2031
- Historical Data and Forecast of New Zealand Clay Revenues & Volume for the Period 2021-2031
- New Zealand Clay Market Trend Evolution
- New Zealand Clay Market Drivers and Challenges
- New Zealand Clay Price Trends
- New Zealand Clay Porter`s Five Forces
- New Zealand Clay Industry Life Cycle
- Historical Data and Forecast of New Zealand Clay Market Revenues & Volume By Application for the Period 2021-2031
- Historical Data and Forecast of New Zealand Clay Market Revenues & Volume By Tableware for the Period 2021-2031
- Historical Data and Forecast of New Zealand Clay Market Revenues & Volume By Sanitary ware for the Period 2021-2031
- Historical Data and Forecast of New Zealand Clay Market Revenues & Volume By Medical applications for the Period 2021-2031
- Historical Data and Forecast of New Zealand Clay Market Revenues & Volume By End Use for the Period 2021-2031
- Historical Data and Forecast of New Zealand Clay Market Revenues & Volume By Ceramic and for the Period 2021-2031
- Historical Data and Forecast of New Zealand Clay Market Revenues & Volume By Non-ceramic for the Period 2021-2031
- New Zealand Clay Import Export Trade Statistics
- Market Opportunity Assessment By Application
- Market Opportunity Assessment By End Use
- New Zealand Clay Top Companies Market Share
- New Zealand Clay Competitive Benchmarking By Technical and Operational Parameters
- New Zealand Clay Company Profiles
- New Zealand Clay Key Strategic Recommendations
Frequently Asked Questions About the Market Study (FAQs):
6Wresearch actively monitors the New Zealand Clay Market and publishes its comprehensive annual report, highlighting emerging trends, growth drivers, revenue analysis, and forecast outlook. Our insights help businesses to make data-backed strategic decisions with ongoing market dynamics. Our analysts track relevent industries related to the New Zealand Clay Market, allowing our clients with actionable intelligence and reliable forecasts tailored to emerging regional needs.
Yes, we provide customisation as per your requirements. To learn more, feel free to contact us on sales@6wresearch.com
1 Executive Summary |
2 Introduction |
2.1 Key Highlights of the Report |
2.2 Report Description |
2.3 Market Scope & Segmentation |
2.4 Research Methodology |
2.5 Assumptions |
3 New Zealand Clay Market Overview |
3.1 New Zealand Country Macro Economic Indicators |
3.2 New Zealand Clay Market Revenues & Volume, 2021 & 2031F |
3.3 New Zealand Clay Market - Industry Life Cycle |
3.4 New Zealand Clay Market - Porter's Five Forces |
3.5 New Zealand Clay Market Revenues & Volume Share, By Application, 2021 & 2031F |
3.6 New Zealand Clay Market Revenues & Volume Share, By End Use, 2021 & 2031F |
4 New Zealand Clay Market Dynamics |
4.1 Impact Analysis |
4.2 Market Drivers |
4.2.1 Increasing demand for eco-friendly and sustainable materials in construction and manufacturing industries |
4.2.2 Growing awareness about the benefits of using New Zealand clay in pottery and ceramics |
4.2.3 Expansion of the construction sector in New Zealand leading to higher demand for clay-based products |
4.3 Market Restraints |
4.3.1 Fluctuations in raw material prices impacting the production cost of clay products |
4.3.2 Intense competition from alternative materials like synthetic polymers and composites |
4.3.3 Regulatory challenges related to environmental regulations and permits for clay extraction |
5 New Zealand Clay Market Trends |
6 New Zealand Clay Market Segmentations |
6.1 New Zealand Clay Market, By Application |
6.1.1 Overview and Analysis |
6.1.2 New Zealand Clay Market Revenues & Volume, By Tableware, 2021-2031F |
6.1.3 New Zealand Clay Market Revenues & Volume, By Sanitary ware, 2021-2031F |
6.1.4 New Zealand Clay Market Revenues & Volume, By Medical applications, 2021-2031F |
6.2 New Zealand Clay Market, By End Use |
6.2.1 Overview and Analysis |
6.2.2 New Zealand Clay Market Revenues & Volume, By Ceramic and, 2021-2031F |
6.2.3 New Zealand Clay Market Revenues & Volume, By Non-ceramic, 2021-2031F |
7 New Zealand Clay Market Import-Export Trade Statistics |
7.1 New Zealand Clay Market Export to Major Countries |
7.2 New Zealand Clay Market Imports from Major Countries |
8 New Zealand Clay Market Key Performance Indicators |
8.1 Percentage of construction projects in New Zealand utilizing clay products |
8.2 Rate of adoption of New Zealand clay in the pottery and ceramics market |
8.3 Number of new product launches or innovations using New Zealand clay |
8.4 Environmental impact assessments and compliance records for clay extraction sites |
8.5 Research and development investments in improving the quality and applications of New Zealand clay |
9 New Zealand Clay Market - Opportunity Assessment |
9.1 New Zealand Clay Market Opportunity Assessment, By Application, 2021 & 2031F |
9.2 New Zealand Clay Market Opportunity Assessment, By End Use, 2021 & 2031F |
10 New Zealand Clay Market - Competitive Landscape |
10.1 New Zealand Clay Market Revenue Share, By Companies, 2024 |
10.2 New Zealand Clay Market Competitive Benchmarking, By Operating and Technical Parameters |
11 Company Profiles |
12 Recommendations | 13 Disclaimer |
Global Go To Market Strategy - 2030
Export potential enables firms to identify high-growth global markets with greater confidence by combining advanced trade intelligence with a structured quantitative methodology. The framework analyzes emerging demand trends and country-level import patterns while integrating macroeconomic and trade datasets such as GDP and population forecasts, bilateral import–export flows, tariff structures, elasticity differentials between developed and developing economies, geographic distance, and import demand projections. Using weighted trade values from 2020–2024 as the base period to project country-to-country export potential for 2030, these inputs are operationalized through calculated drivers such as gravity model parameters, tariff impact factors, and projected GDP per-capita growth. Through an analysis of hidden potentials, demand hotspots, and market conditions that are most favorable to success, this method enables firms to focus on target countries, maximize returns, and global expansion with data, backed by accuracy.
By factoring in the projected importer demand gap that is currently unmet and could be potential opportunity, it identifies the potential for the Exporter (Country) among 190 countries, against the general trade analysis, which identifies the biggest importer or exporter.
To discover high-growth global markets and optimize your business strategy:
Click Here
Pricing
- Single User License$ 1,995
- Department License$ 2,400
- Site License$ 3,120
- Global License$ 3,795

Leadership Perspectives from Industry Events
Search
Thought Leadership and Analyst Meet


Our Clients
6WResearch In News
- India Export Attractiveness Tracker 2026
- India Air Conditioner Market Set for Strong Rebound in 2026 After Weather-Led Correction and GST-Driven Recovery: 6Wresearch
- ADAS in India: How Automatic Emergency Braking, Blind Spot Detection & Driver Monitoring are Transforming Road Safety
- Doha a strategic location for EV manufacturing hub: IPA Qatar
- Demand for luxury TVs surging in the GCC, says Samsung
- Empowering Growth: The Thriving Journey of Bangladesh’s Cable Industry
Latest Reports
- Nicaragua RPG Gaming Market (2026-2032)
- New Zealand RPG Gaming Market (2026-2032)
- Netherlands RPG Gaming Market (2026-2032)
- Nauru RPG Gaming Market (2026-2032)
- Namibia RPG Gaming Market (2026-2032)
- Mozambique RPG Gaming Market (2026-2032)
- Montenegro RPG Gaming Market (2026-2032)
- Mongolia RPG Gaming Market (2026-2032)
- Monaco RPG Gaming Market (2026-2032)
- Micronesia RPG Gaming Market (2026-2032)
Industry Events and Analyst Meet

EV India Expo 2026

HIMTEX 2026

India Refining Summit 2026

India EV Show 2026

EV tech India Expo 2026
Whitepaper
- Middle East & Africa Commercial Security Market Click here to view more.
- Middle East & Africa Fire Safety Systems & Equipment Market Click here to view more.
- GCC Drone Market Click here to view more.
- Middle East Lighting Fixture Market Click here to view more.
- GCC Physical & Perimeter Security Market Click here to view more.