New Zealand Feed Y Market (2026-2032) | Size, Pricing Analysis, Competition, Competitive, Drivers, Trends, Value, Outlook, Share, Revenue, Industry, Strategic Insights, Restraints, Strategy, Analysis, Opportunities, Consumer Insights, Challenges, Segmentation, Investment Trends, Growth, Companies, Forecast, Segments, Demand, Supply
Market Forecast By Product Type (Animal Feed, Poultry Feed, Aquaculture Feed, Swine Feed, Specialty Pet Feed), By Technology Type (Conventional Technology, Specialized Technology, Marine-based Technology, Nutritional Technology, Premium Feed Technology), By End User (Livestock Feed Producers, Poultry Farmers, Aquaculture Industry, Swine Farmers, Pet Food Manufacturers), By Application (Providing Nutritional Feed for Livestock, Optimizing Growth and Health of Poultry, Supporting Growth of Aquatic Species, Improving Swine Health and Growth, Nutritional Support for Pets) And Competitive Landscape
| Product Code: ETC12160909 | Publication Date: Apr 2025 | Updated Date: Apr 2026 | Product Type: Market Research Report | |
| Publisher: 6Wresearch | Author: Bhawna Singh | No. of Pages: 65 | No. of Figures: 34 | No. of Tables: 19 |
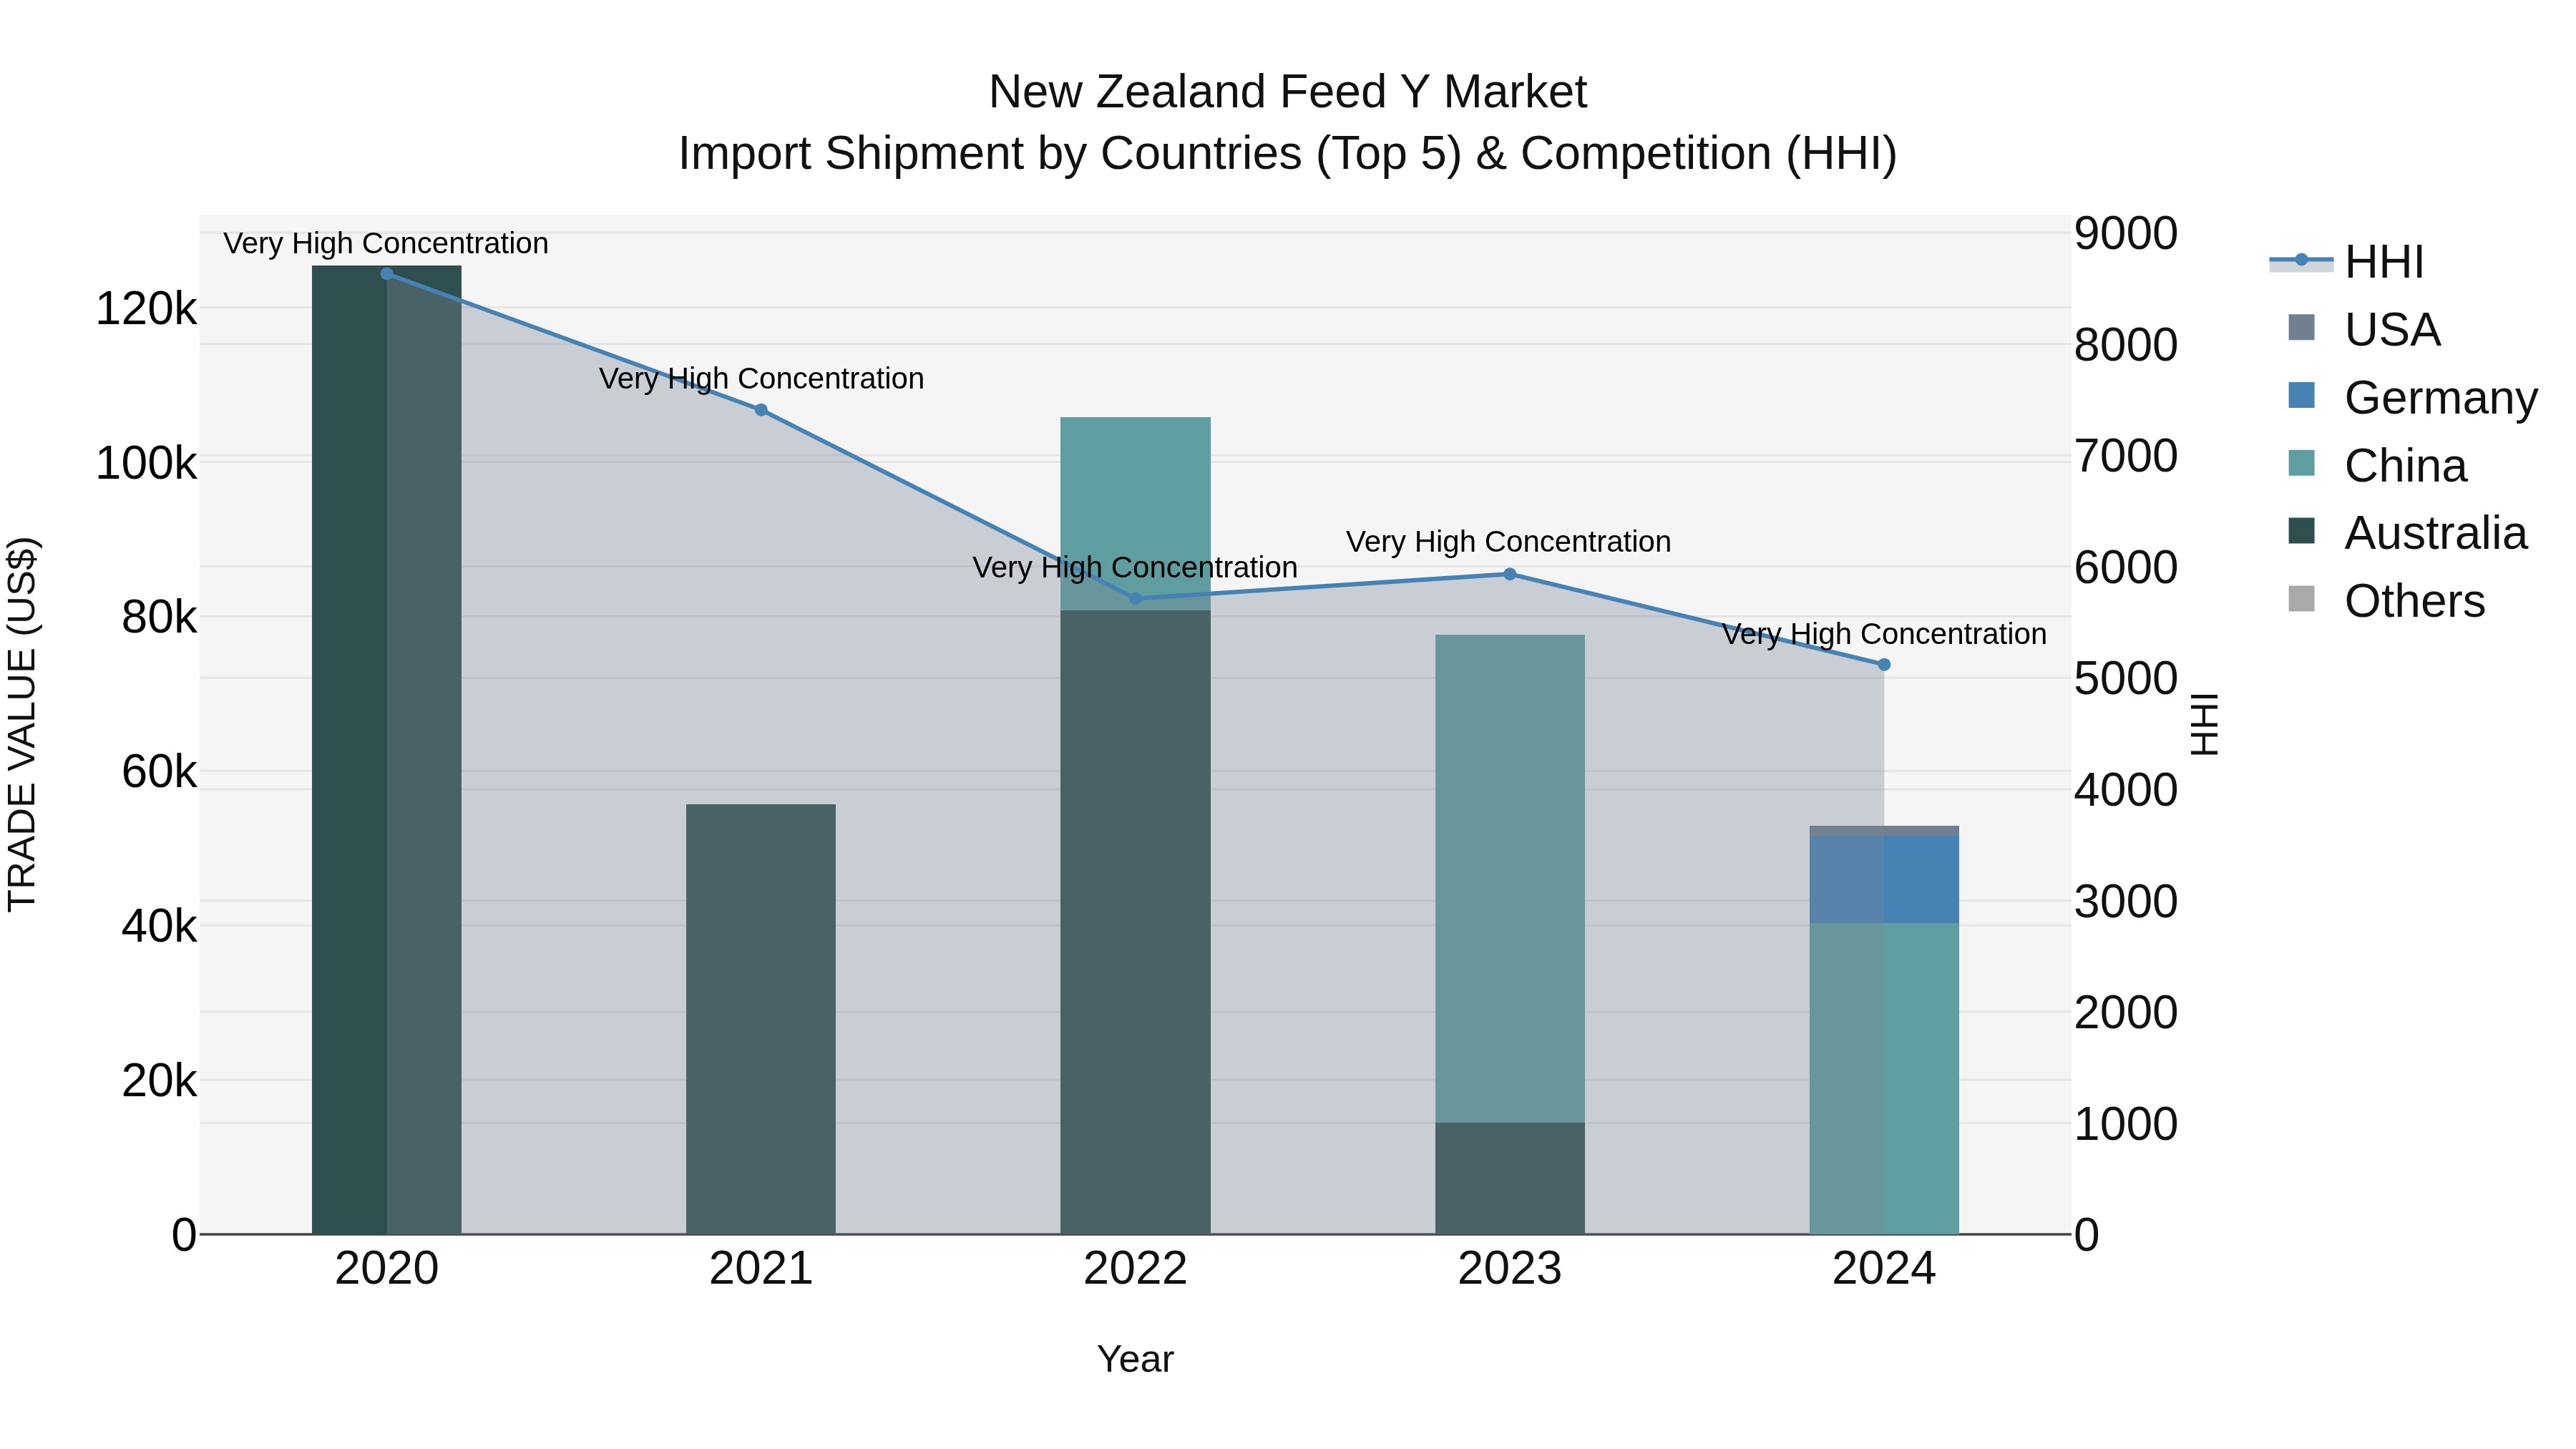
New Zealand Feed Y Market Top 5 Importing Countries and Market Competition (HHI) Analysis
In 2024, New Zealand`s feed import market continued to be dominated by key exporters such as China, Germany, USA, and Australia. Despite the high concentration levels indicated by the Herfindahl-Hirschman Index (HHI), the market experienced a significant decline in both the compound annual growth rate (CAGR) and the growth rate from 2023 to 2024. The negative CAGR of -19.4% suggests a challenging environment for feed imports, further exacerbated by a steep decline of -31.78% in growth rate. This trend highlights the need for strategic insights and adaptations in response to evolving market dynamics.
Key Highlights of the Report:
- New Zealand Feed Y Market Outlook
- Market Size of New Zealand Feed Y Market, 2025
- Forecast of New Zealand Feed Y Market, 2032
- Historical Data and Forecast of New Zealand Feed Y Revenues & Volume for the Period 2022 - 2032F
- New Zealand Feed Y Market Trend Evolution
- New Zealand Feed Y Market Drivers and Challenges
- New Zealand Feed Y Price Trends
- New Zealand Feed Y Porter's Five Forces
- New Zealand Feed Y Industry Life Cycle
- Historical Data and Forecast of New Zealand Feed Y Market Revenues & Volume By Product Type for the Period 2022 - 2032F
- Historical Data and Forecast of New Zealand Feed Y Market Revenues & Volume By Animal Feed for the Period 2022 - 2032F
- Historical Data and Forecast of New Zealand Feed Y Market Revenues & Volume By Poultry Feed for the Period 2022 - 2032F
- Historical Data and Forecast of New Zealand Feed Y Market Revenues & Volume By Aquaculture Feed for the Period 2022 - 2032F
- Historical Data and Forecast of New Zealand Feed Y Market Revenues & Volume By Swine Feed for the Period 2022 - 2032F
- Historical Data and Forecast of New Zealand Feed Y Market Revenues & Volume By Specialty Pet Feed for the Period 2022 - 2032F
- Historical Data and Forecast of New Zealand Feed Y Market Revenues & Volume By Technology Type for the Period 2022 - 2032F
- Historical Data and Forecast of New Zealand Feed Y Market Revenues & Volume By Conventional Technology for the Period 2022 - 2032F
- Historical Data and Forecast of New Zealand Feed Y Market Revenues & Volume By Specialized Technology for the Period 2022 - 2032F
- Historical Data and Forecast of New Zealand Feed Y Market Revenues & Volume By Marine-based Technology for the Period 2022 - 2032F
- Historical Data and Forecast of New Zealand Feed Y Market Revenues & Volume By Nutritional Technology for the Period 2022 - 2032F
- Historical Data and Forecast of New Zealand Feed Y Market Revenues & Volume By Premium Feed Technology for the Period 2022 - 2032F
- Historical Data and Forecast of New Zealand Feed Y Market Revenues & Volume By End User for the Period 2022 - 2032F
- Historical Data and Forecast of New Zealand Feed Y Market Revenues & Volume By Livestock Feed Producers for the Period 2022 - 2032F
- Historical Data and Forecast of New Zealand Feed Y Market Revenues & Volume By Poultry Farmers for the Period 2022 - 2032F
- Historical Data and Forecast of New Zealand Feed Y Market Revenues & Volume By Aquaculture Industry for the Period 2022 - 2032F
- Historical Data and Forecast of New Zealand Feed Y Market Revenues & Volume By Swine Farmers for the Period 2022 - 2032F
- Historical Data and Forecast of New Zealand Feed Y Market Revenues & Volume By Pet Food Manufacturers for the Period 2022 - 2032F
- Historical Data and Forecast of New Zealand Feed Y Market Revenues & Volume By Application for the Period 2022 - 2032F
- Historical Data and Forecast of New Zealand Feed Y Market Revenues & Volume By Providing Nutritional Feed for Livestock for the Period 2022 - 2032F
- Historical Data and Forecast of New Zealand Feed Y Market Revenues & Volume By Optimizing Growth and Health of Poultry for the Period 2022 - 2032F
- Historical Data and Forecast of New Zealand Feed Y Market Revenues & Volume By Supporting Growth of Aquatic Species for the Period 2022 - 2032F
- Historical Data and Forecast of New Zealand Feed Y Market Revenues & Volume By Improving Swine Health and Growth for the Period 2022 - 2032F
- Historical Data and Forecast of New Zealand Feed Y Market Revenues & Volume By Nutritional Support for Pets for the Period 2022 - 2032F
- New Zealand Feed Y Import Export Trade Statistics
- Market Opportunity Assessment By Product Type
- Market Opportunity Assessment By Technology Type
- Market Opportunity Assessment By End User
- Market Opportunity Assessment By Application
- New Zealand Feed Y Top Companies Market Share
- New Zealand Feed Y Competitive Benchmarking By Technical and Operational Parameters
- New Zealand Feed Y Company Profiles
- New Zealand Feed Y Key Strategic Recommendations
Frequently Asked Questions About the Market Study (FAQs):
6Wresearch actively monitors the New Zealand Feed Y Market and publishes its comprehensive annual report, highlighting emerging trends, growth drivers, revenue analysis, and forecast outlook. Our insights help businesses to make data-backed strategic decisions with ongoing market dynamics. Our analysts track relevent industries related to the New Zealand Feed Y Market, allowing our clients with actionable intelligence and reliable forecasts tailored to emerging regional needs.
Yes, we provide customisation as per your requirements. To learn more, feel free to contact us on sales@6wresearch.com
1 Executive Summary |
2 Introduction |
2.1 Key Highlights of the Report |
2.2 Report Description |
2.3 Market Scope & Segmentation |
2.4 Research Methodology |
2.5 Assumptions |
3 New Zealand Feed Y Market Overview |
3.1 New Zealand Country Macro Economic Indicators |
3.2 New Zealand Feed Y Market Revenues & Volume, 2022 & 2032F |
3.3 New Zealand Feed Y Market - Industry Life Cycle |
3.4 New Zealand Feed Y Market - Porter's Five Forces |
3.5 New Zealand Feed Y Market Revenues & Volume Share, By Product Type, 2022 & 2032F |
3.6 New Zealand Feed Y Market Revenues & Volume Share, By Technology Type, 2022 & 2032F |
3.7 New Zealand Feed Y Market Revenues & Volume Share, By End User, 2022 & 2032F |
3.8 New Zealand Feed Y Market Revenues & Volume Share, By Application, 2022 & 2032F |
4 New Zealand Feed Y Market Dynamics |
4.1 Impact Analysis |
4.2 Market Drivers |
4.2.1 Increasing demand for high-quality animal feed due to rising awareness about animal nutrition and health. |
4.2.2 Growth in the livestock industry in New Zealand leading to higher demand for feed products. |
4.2.3 Innovation and technological advancements in feed manufacturing processes improving product quality and efficiency. |
4.3 Market Restraints |
4.3.1 Fluctuating prices of raw materials impacting the cost of feed production. |
4.3.2 Stringent government regulations related to feed ingredients and additives affecting the market dynamics. |
4.3.3 Competition from imported feed products affecting the market share of local manufacturers. |
5 New Zealand Feed Y Market Trends |
6 New Zealand Feed Y Market, By Types |
6.1 New Zealand Feed Y Market, By Product Type |
6.1.1 Overview and Analysis |
6.1.2 New Zealand Feed Y Market Revenues & Volume, By Product Type, 2022 - 2032F |
6.1.3 New Zealand Feed Y Market Revenues & Volume, By Animal Feed, 2022 - 2032F |
6.1.4 New Zealand Feed Y Market Revenues & Volume, By Poultry Feed, 2022 - 2032F |
6.1.5 New Zealand Feed Y Market Revenues & Volume, By Aquaculture Feed, 2022 - 2032F |
6.1.6 New Zealand Feed Y Market Revenues & Volume, By Swine Feed, 2022 - 2032F |
6.1.7 New Zealand Feed Y Market Revenues & Volume, By Specialty Pet Feed, 2022 - 2032F |
6.2 New Zealand Feed Y Market, By Technology Type |
6.2.1 Overview and Analysis |
6.2.2 New Zealand Feed Y Market Revenues & Volume, By Conventional Technology, 2022 - 2032F |
6.2.3 New Zealand Feed Y Market Revenues & Volume, By Specialized Technology, 2022 - 2032F |
6.2.4 New Zealand Feed Y Market Revenues & Volume, By Marine-based Technology, 2022 - 2032F |
6.2.5 New Zealand Feed Y Market Revenues & Volume, By Nutritional Technology, 2022 - 2032F |
6.2.6 New Zealand Feed Y Market Revenues & Volume, By Premium Feed Technology, 2022 - 2032F |
6.3 New Zealand Feed Y Market, By End User |
6.3.1 Overview and Analysis |
6.3.2 New Zealand Feed Y Market Revenues & Volume, By Livestock Feed Producers, 2022 - 2032F |
6.3.3 New Zealand Feed Y Market Revenues & Volume, By Poultry Farmers, 2022 - 2032F |
6.3.4 New Zealand Feed Y Market Revenues & Volume, By Aquaculture Industry, 2022 - 2032F |
6.3.5 New Zealand Feed Y Market Revenues & Volume, By Swine Farmers, 2022 - 2032F |
6.3.6 New Zealand Feed Y Market Revenues & Volume, By Pet Food Manufacturers, 2022 - 2032F |
6.4 New Zealand Feed Y Market, By Application |
6.4.1 Overview and Analysis |
6.4.2 New Zealand Feed Y Market Revenues & Volume, By Providing Nutritional Feed for Livestock, 2022 - 2032F |
6.4.3 New Zealand Feed Y Market Revenues & Volume, By Optimizing Growth and Health of Poultry, 2022 - 2032F |
6.4.4 New Zealand Feed Y Market Revenues & Volume, By Supporting Growth of Aquatic Species, 2022 - 2032F |
6.4.5 New Zealand Feed Y Market Revenues & Volume, By Improving Swine Health and Growth, 2022 - 2032F |
6.4.6 New Zealand Feed Y Market Revenues & Volume, By Nutritional Support for Pets, 2022 - 2032F |
7 New Zealand Feed Y Market Import-Export Trade Statistics |
7.1 New Zealand Feed Y Market Export to Major Countries |
7.2 New Zealand Feed Y Market Imports from Major Countries |
8 New Zealand Feed Y Market Key Performance Indicators |
8.1 Average feed conversion ratio (FCR) indicating the efficiency of feed utilization by animals. |
8.2 Nutrient retention rate in feed products showing the nutritional value for animals. |
8.3 Adoption rate of sustainable feed practices promoting environmental conservation. |
8.4 Research and development investment in feed technology leading to product innovation. |
8.5 Customer satisfaction index reflecting the level of satisfaction with feed products and services. |
9 New Zealand Feed Y Market - Opportunity Assessment |
9.1 New Zealand Feed Y Market Opportunity Assessment, By Product Type, 2022 & 2032F |
9.2 New Zealand Feed Y Market Opportunity Assessment, By Technology Type, 2022 & 2032F |
9.3 New Zealand Feed Y Market Opportunity Assessment, By End User, 2022 & 2032F |
9.4 New Zealand Feed Y Market Opportunity Assessment, By Application, 2022 & 2032F |
10 New Zealand Feed Y Market - Competitive Landscape |
10.1 New Zealand Feed Y Market Revenue Share, By Companies, 2025 |
10.2 New Zealand Feed Y Market Competitive Benchmarking, By Operating and Technical Parameters |
11 Company Profiles |
12 Recommendations |
13 Disclaimer |
Export potential assessment - trade Analytics for 2030
Export potential enables firms to identify high-growth global markets with greater confidence by combining advanced trade intelligence with a structured quantitative methodology. The framework analyzes emerging demand trends and country-level import patterns while integrating macroeconomic and trade datasets such as GDP and population forecasts, bilateral import–export flows, tariff structures, elasticity differentials between developed and developing economies, geographic distance, and import demand projections. Using weighted trade values from 2020–2024 as the base period to project country-to-country export potential for 2030, these inputs are operationalized through calculated drivers such as gravity model parameters, tariff impact factors, and projected GDP per-capita growth. Through an analysis of hidden potentials, demand hotspots, and market conditions that are most favorable to success, this method enables firms to focus on target countries, maximize returns, and global expansion with data, backed by accuracy.
By factoring in the projected importer demand gap that is currently unmet and could be potential opportunity, it identifies the potential for the Exporter (Country) among 190 countries, against the general trade analysis, which identifies the biggest importer or exporter.
To discover high-growth global markets and optimize your business strategy:
Click Here
Pricing
- Single User License$ 1,995
- Department License$ 2,400
- Site License$ 3,120
- Global License$ 3,795

Search
Thought Leadership and Analyst Meet


Our Clients
Latest Reports
- Syria Air Conditioner Market (2026-2032) | Outlook, Competition, Drivers, Trends, Demand, Competitive, Strategic Insights, Companies, Challenges, Strategy, Consumer Insights, Analysis, Opportunities, Growth, Size, Share, Industry, Revenue, Segments, Value, Segmentation, Supply, Forecast, Restraints,
- Philippines Polyhydroxybutyrate-co-Hydroxyvalerate Market (2026-2032) | Trends, Insights, Challenges, Restraints, Competition, Size, Value, Forecast, Pricing, Share, Outlook, Revenue, Investment Opportunities, Strategy, Drivers, Demand, Growth, segmentation, Analysis, Companies
- Peru Polyhydroxybutyrate-co-Hydroxyvalerate Market (2026-2032) | Growth, Demand, Challenges, Share, Trends, Analysis, Pricing, Investment Opportunities, Drivers, Value, Forecast, Competition, Size, Companies, Insights, Outlook, Restraints, segmentation, Revenue, Strategy
- Pakistan Polyhydroxybutyrate-co-Hydroxyvalerate Market (2026-2032) | Restraints, segmentation, Pricing, Forecast, Share, Strategy, Competition, Trends, Insights, Drivers, Challenges, Growth, Revenue, Outlook, Value, Investment Opportunities, Companies, Size, Analysis, Demand
- Oman Polyhydroxybutyrate-co-Hydroxyvalerate Market (2026-2032) | Drivers, segmentation, Insights, Competition, Pricing, Outlook, Size, Revenue, Challenges, Forecast, Analysis, Growth, Value, Share, Trends, Investment Opportunities, Strategy, Restraints, Companies, Demand
- Nigeria Polyhydroxybutyrate-co-Hydroxyvalerate Market (2026-2032) | Value, Investment Opportunities, Analysis, Revenue, Restraints, Pricing, Outlook, Competition, Demand, Growth, Forecast, Companies, Trends, Challenges, segmentation, Drivers, Insights, Share, Size, Strategy
- Nepal Polyhydroxybutyrate-co-Hydroxyvalerate Market (2026-2032) | Insights, Analysis, Drivers, Share, Revenue, Demand, segmentation, Investment Opportunities, Competition, Forecast, Growth, Pricing, Companies, Strategy, Trends, Restraints, Challenges, Outlook, Size, Value
- Myanmar Polyhydroxybutyrate-co-Hydroxyvalerate Market (2026-2032) | Outlook, Revenue, Strategy, Restraints, Drivers, segmentation, Share, Forecast, Competition, Insights, Growth, Pricing, Size, Demand, Value, Companies, Trends, Challenges, Investment Opportunities, Analysis
- Morocco Polyhydroxybutyrate-co-Hydroxyvalerate Market (2026-2032) | Outlook, Investment Opportunities, Restraints, Strategy, Forecast, Challenges, Drivers, Growth, Companies, segmentation, Trends, Size, Competition, Revenue, Demand, Insights, Share, Analysis, Value, Pricing
- Mexico Polyhydroxybutyrate-co-Hydroxyvalerate Market (2026-2032) | Size, Drivers, Outlook, Share, Strategy, Growth, Pricing, Challenges, Companies, Demand, Value, Investment Opportunities, Restraints, Trends, Forecast, segmentation, Analysis, Insights, Competition, Revenue
Industry Events and Analyst Meet

HIMTEX 2026

India Refining Summit 2026

India EV Show 2026

EV tech India Expo 2026

Auto Tech Asia 2026
Whitepaper
- Middle East & Africa Commercial Security Market Click here to view more.
- Middle East & Africa Fire Safety Systems & Equipment Market Click here to view more.
- GCC Drone Market Click here to view more.
- Middle East Lighting Fixture Market Click here to view more.
- GCC Physical & Perimeter Security Market Click here to view more.
6WResearch In News
- Doha a strategic location for EV manufacturing hub: IPA Qatar
- Demand for luxury TVs surging in the GCC, says Samsung
- Empowering Growth: The Thriving Journey of Bangladesh’s Cable Industry
- Demand for luxury TVs surging in the GCC, says Samsung
- Video call with a traditional healer? Once unthinkable, it’s now common in South Africa
- Intelligent Buildings To Smooth GCC’s Path To Net Zero