Nigeria Pressure Labels Market (2025-2031) Outlook | Size, Share, Companies, Analysis, Industry, Revenue, Trends, Forecast, Growth & Value
Market Forecast By Type (Release Liner, Linerless), By Composition (Facestock, Adhesives, Others), By Printing technology (Digital Printing, Flexography, Others) And Competitive Landscape
| Product Code: ETC4601510 | Publication Date: Jul 2023 | Updated Date: Nov 2025 | Product Type: Report | |
| Publisher: 6Wresearch | Author: Summon Dutta | No. of Pages: 85 | No. of Figures: 45 | No. of Tables: 25 |
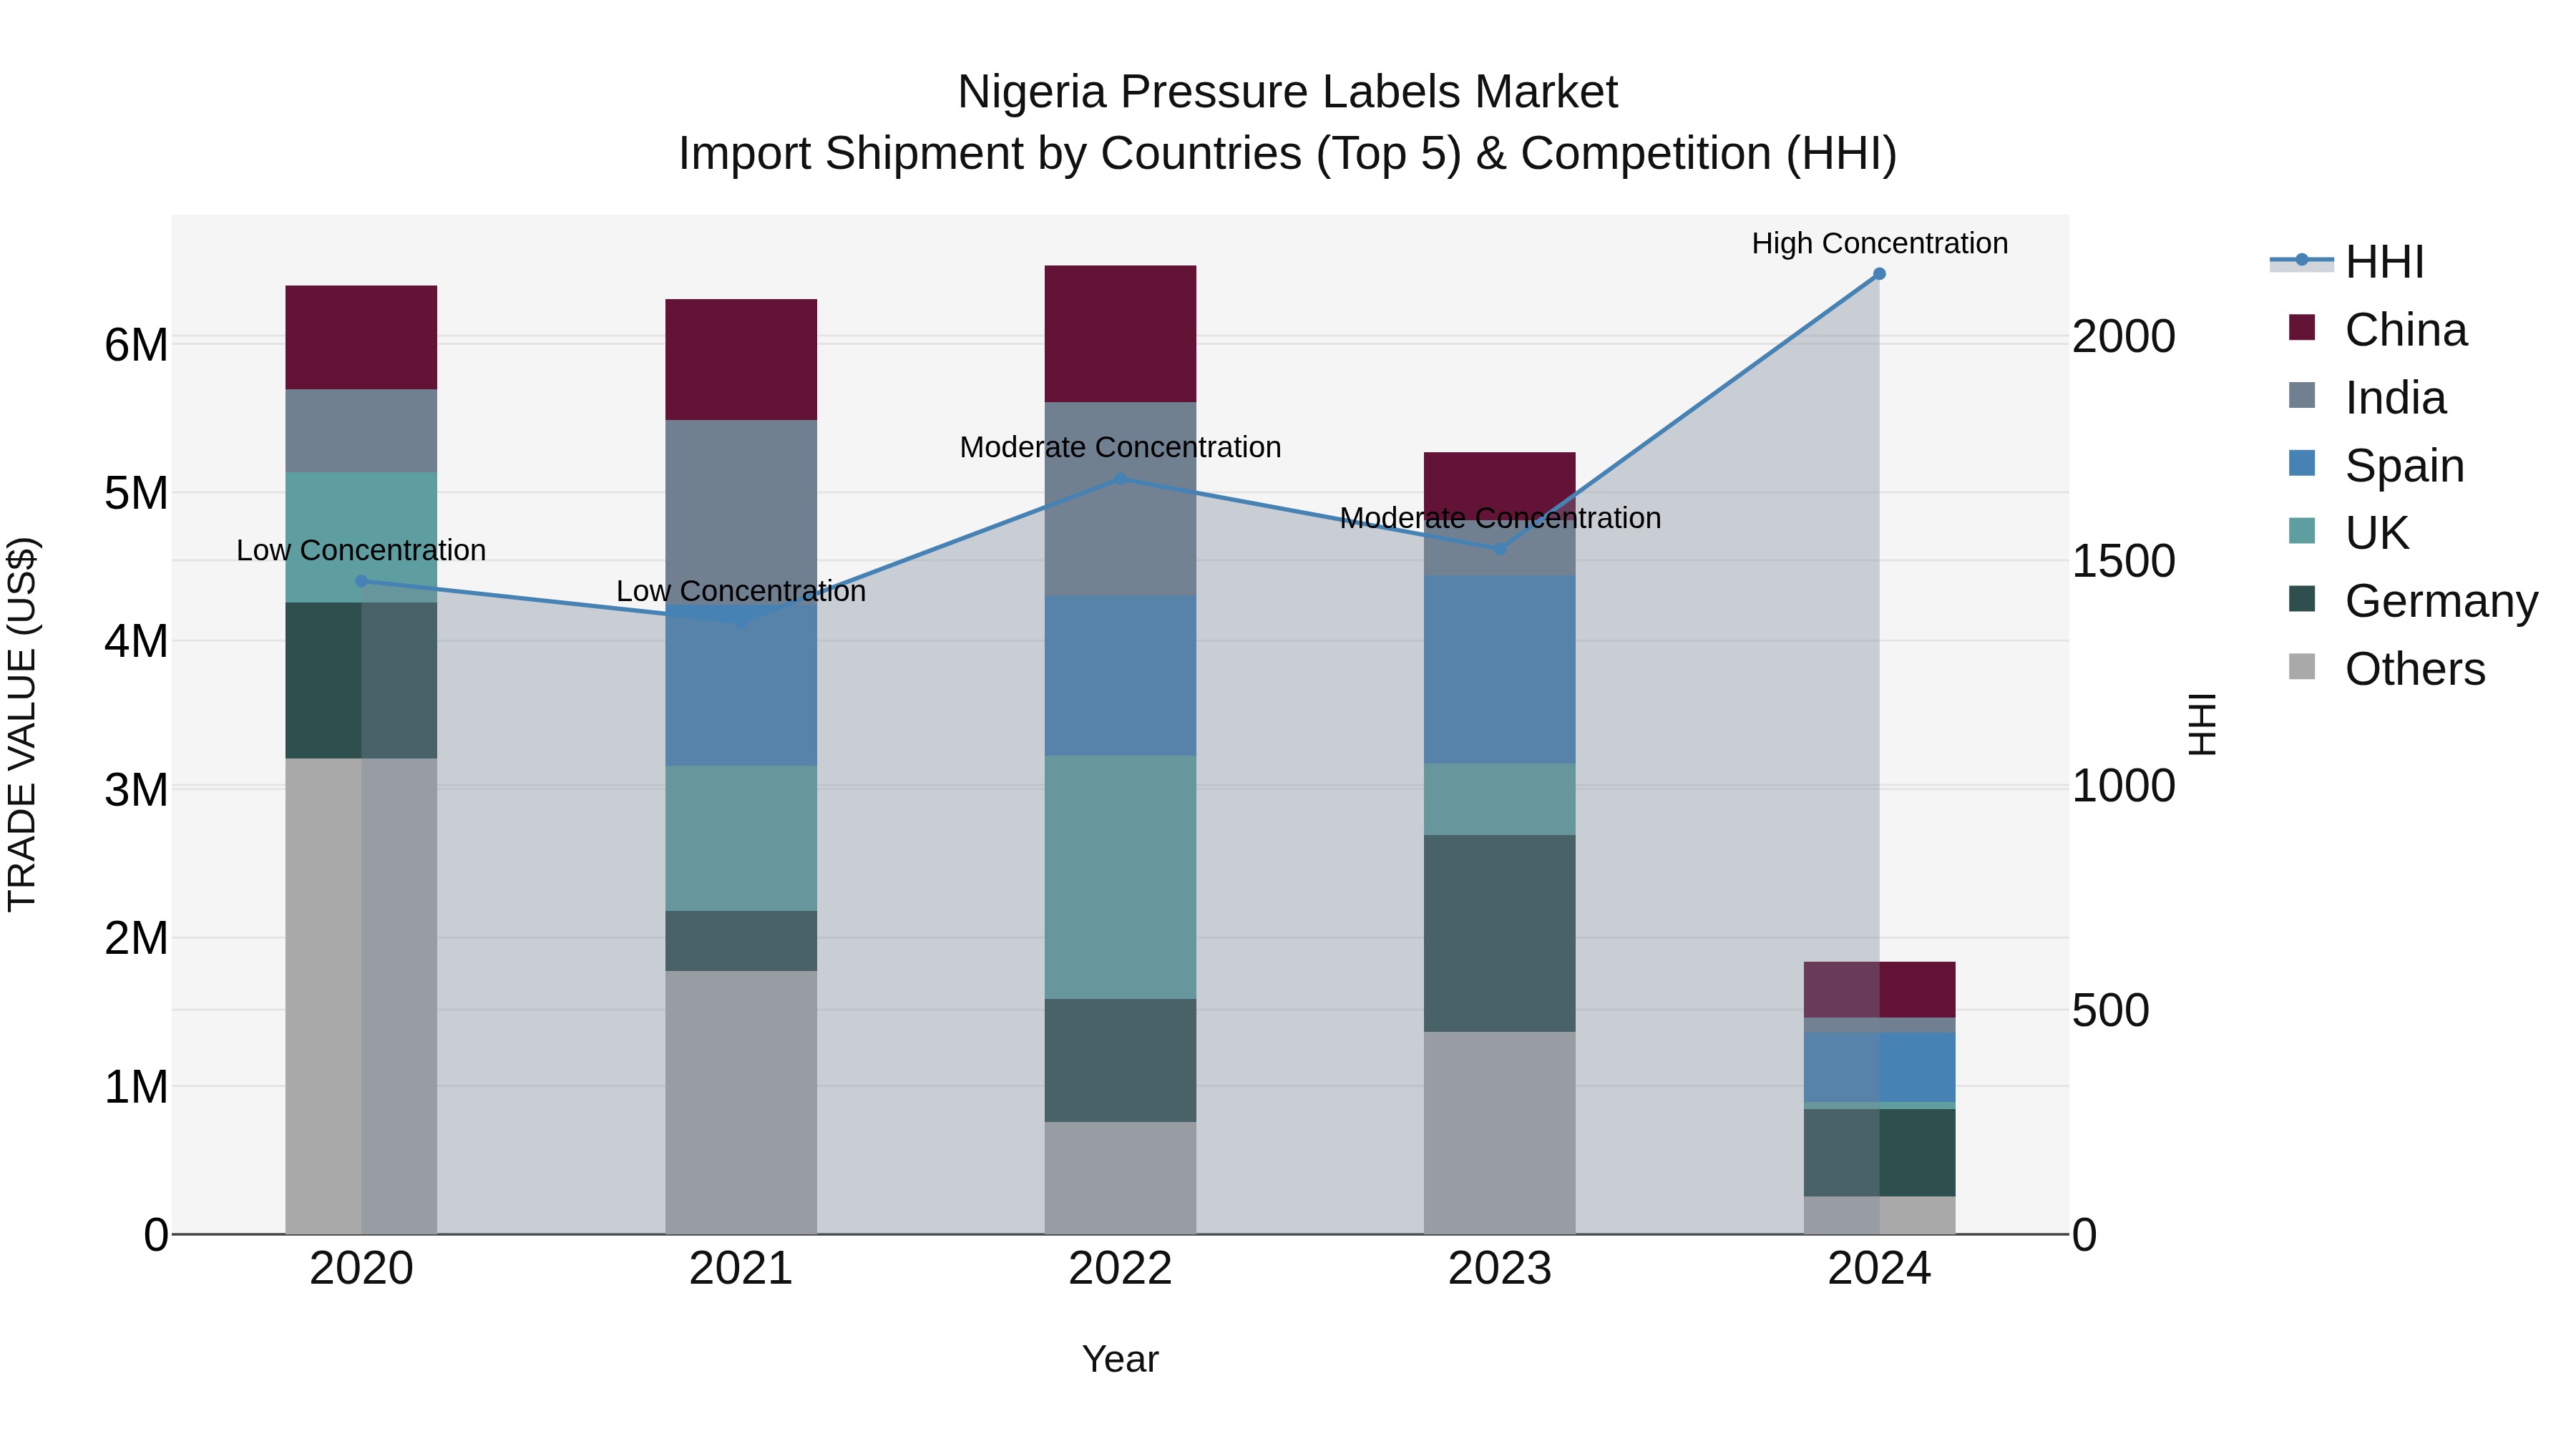
Nigeria Pressure Labels Market Top 5 Importing Countries and Market Competition (HHI) Analysis
The pressure labels import market in Nigeria experienced a significant shift in 2024, with top exporting countries including Germany, Spain, China, India, and South Korea. The market concentration, as measured by the HHI, increased from moderate to high in just one year. The industry saw a sharp decline in the CAGR from 2020 to 2024 at -26.76%, with a particularly steep drop in growth rate from 2023 to 2024 at -65.09%. These trends indicate a challenging landscape for pressure label importers in Nigeria, highlighting the need for strategic adaptation and market intelligence.
Nigeria Pressure Labels Market Overview
The pressure labels market in Nigeria is expanding due to the increasing demand for high-quality labeling solutions across various industries, including food and beverage, pharmaceuticals, and consumer goods. Pressure-sensitive labels offer durability, versatility, and ease of application. The market growth is driven by the need for effective branding and regulatory compliance.
Drivers of the market
The Nigeria pressure labels market is propelled by the increasing demand for product labeling and packaging solutions across various industries. Pressure-sensitive labels offer advantages such as ease of application, versatility, and durability, driving their adoption in sectors such as food and beverage, pharmaceuticals, and consumer goods. Factors such as growing consumer awareness, stringent labeling regulations, and the need for product differentiation contribute to market growth. Moreover, advancements in label printing technologies and materials further stimulate market expansion.
Challenges of the market
The pressure labels market in Nigeria is confronted with issues such as high production costs and limited access to quality raw materials. Additionally, the market suffers from inadequate technological advancements and competition from imported labels. There is also a lack of standardization and quality control within the industry, affecting product reliability.
Government Policy of the market
The government`s industrial policies support the manufacturing sector, including the production of pressure labels. Incentives such as tax breaks and grants for technology upgrades are provided to local manufacturers to improve their competitiveness and quality of products.
Key Highlights of the Report:
- Nigeria Pressure Labels Market Outlook
- Market Size of Nigeria Pressure Labels Market, 2024
- Forecast of Nigeria Pressure Labels Market, 2031
- Historical Data and Forecast of Nigeria Pressure Labels Revenues & Volume for the Period 2021-2031
- Nigeria Pressure Labels Market Trend Evolution
- Nigeria Pressure Labels Market Drivers and Challenges
- Nigeria Pressure Labels Price Trends
- Nigeria Pressure Labels Porter's Five Forces
- Nigeria Pressure Labels Industry Life Cycle
- Historical Data and Forecast of Nigeria Pressure Labels Market Revenues & Volume By Type for the Period 2021-2031
- Historical Data and Forecast of Nigeria Pressure Labels Market Revenues & Volume By Release Liner for the Period 2021-2031
- Historical Data and Forecast of Nigeria Pressure Labels Market Revenues & Volume By Linerless for the Period 2021-2031
- Historical Data and Forecast of Nigeria Pressure Labels Market Revenues & Volume By Composition for the Period 2021-2031
- Historical Data and Forecast of Nigeria Pressure Labels Market Revenues & Volume By Facestock for the Period 2021-2031
- Historical Data and Forecast of Nigeria Pressure Labels Market Revenues & Volume By Adhesives for the Period 2021-2031
- Historical Data and Forecast of Nigeria Pressure Labels Market Revenues & Volume By Others for the Period 2021-2031
- Historical Data and Forecast of Nigeria Pressure Labels Market Revenues & Volume By Printing technology for the Period 2021-2031
- Historical Data and Forecast of Nigeria Pressure Labels Market Revenues & Volume By Digital Printing for the Period 2021-2031
- Historical Data and Forecast of Nigeria Pressure Labels Market Revenues & Volume By Flexography for the Period 2021-2031
- Historical Data and Forecast of Nigeria Pressure Labels Market Revenues & Volume By Others for the Period 2021-2031
- Nigeria Pressure Labels Import Export Trade Statistics
- Market Opportunity Assessment By Type
- Market Opportunity Assessment By Composition
- Market Opportunity Assessment By Printing technology
- Nigeria Pressure Labels Top Companies Market Share
- Nigeria Pressure Labels Competitive Benchmarking By Technical and Operational Parameters
- Nigeria Pressure Labels Company Profiles
- Nigeria Pressure Labels Key Strategic Recommendations
What are the new business and investment opportunities in the Nigeria pressure labels market?
With the rising demand for customized packaging solutions in Nigeria, companies like Label Solutions Nigeria and Multi-Color Corporation are capitalizing on opportunities to offer innovative pressure labels for various industries such as food and beverage, pharmaceuticals, and cosmetics. Investing in state-of-the-art printing technologies and sustainable label materials can position businesses for growth in this dynamic market.
Key competitors in the Nigeria pressure labels market include companies such as Coscharis Group, Skanem Nigeria, and Label House Group. Coscharis Group focuses on providing high-quality labels for various industries, while Skanem Nigeria emphasizes its environmentally friendly labeling solutions. Label House Group positions itself as a provider of innovative and customized label solutions to meet the unique needs of its customers in Nigeria.
Customer preferences in the Nigeria pressure labels market are increasingly shifting towards sustainable and eco-friendly options. Companies like LabelCraft Nigeria are responding to this trend by offering labeling solutions made from recyclable materials. Additionally, there is a growing demand for custom-designed labels to enhance product appeal and visibility, as seen in the collaboration between Nigerian Breweries and Label Solutions Limited to create unique and innovative labels for their beverages.
The Nigeria pressure labels market is primarily driven by the increasing demand for packaged goods from industries such as food and beverage, pharmaceuticals, and cosmetics. However, challenges such as the high cost of raw materials and fluctuating currency exchange rates can impact market growth. Additionally, the dynamics in this market are influenced by the rising adoption of advanced labeling technologies by key players like Nigerian Breweries and Dangote Group, as well as the growing focus on sustainable and eco-friendly labeling solutions to meet consumer preferences.
The key factors driving growth in the Nigeria pressure labels market include the increasing adoption of advanced labeling technologies by major companies such as Nigerian Breweries Plc and Unilever Nigeria. These companies are leveraging innovative labeling solutions to enhance brand visibility, improve product differentiation, and ensure regulatory compliance, thereby fueling the demand for pressure-sensitive labels in the country. Additionally, the growing e-commerce sector in Nigeria, supported by players like Jumia and Konga, is driving the need for high-quality labeling solutions to meet the packaging requirements of online retail, further boosting market growth.
6Wresearch actively monitors the Nigeria Pressure Labels Market and publishes its comprehensive annual report, highlighting emerging trends, growth drivers, revenue analysis, and forecast outlook. Our insights help businesses to make data-backed strategic decisions with ongoing market dynamics. Our analysts track relevent industries related to the Nigeria Pressure Labels Market, allowing our clients with actionable intelligence and reliable forecasts tailored to emerging regional needs.
Yes, we provide customisation as per your requirements. To learn more, feel free to contact us on sales@6wresearch.com
1 Executive Summary |
2 Introduction |
2.1 Key Highlights of the Report |
2.2 Report Description |
2.3 Market Scope & Segmentation |
2.4 Research Methodology |
2.5 Assumptions |
3 Nigeria Pressure Labels Market Overview |
3.1 Nigeria Country Macro Economic Indicators |
3.2 Nigeria Pressure Labels Market Revenues & Volume, 2021 & 2031F |
3.3 Nigeria Pressure Labels Market - Industry Life Cycle |
3.4 Nigeria Pressure Labels Market - Porter's Five Forces |
3.5 Nigeria Pressure Labels Market Revenues & Volume Share, By Type, 2021 & 2031F |
3.6 Nigeria Pressure Labels Market Revenues & Volume Share, By Composition, 2021 & 2031F |
3.7 Nigeria Pressure Labels Market Revenues & Volume Share, By Printing technology, 2021 & 2031F |
4 Nigeria Pressure Labels Market Dynamics |
4.1 Impact Analysis |
4.2 Market Drivers |
4.2.1 Increasing demand for packaged goods in Nigeria |
4.2.2 Growing awareness about labeling regulations and standards |
4.2.3 Rise in the adoption of pressure-sensitive labels by various industries |
4.3 Market Restraints |
4.3.1 High competition from alternative labeling methods |
4.3.2 Fluctuating raw material prices impacting production costs |
4.3.3 Lack of skilled labor and expertise in the pressure labels industry |
5 Nigeria Pressure Labels Market Trends |
6 Nigeria Pressure Labels Market, By Types |
6.1 Nigeria Pressure Labels Market, By Type |
6.1.1 Overview and Analysis |
6.1.2 Nigeria Pressure Labels Market Revenues & Volume, By Type, 2021-2031F |
6.1.3 Nigeria Pressure Labels Market Revenues & Volume, By Release Liner, 2021-2031F |
6.1.4 Nigeria Pressure Labels Market Revenues & Volume, By Linerless, 2021-2031F |
6.2 Nigeria Pressure Labels Market, By Composition |
6.2.1 Overview and Analysis |
6.2.2 Nigeria Pressure Labels Market Revenues & Volume, By Facestock, 2021-2031F |
6.2.3 Nigeria Pressure Labels Market Revenues & Volume, By Adhesives, 2021-2031F |
6.2.4 Nigeria Pressure Labels Market Revenues & Volume, By Others, 2021-2031F |
6.3 Nigeria Pressure Labels Market, By Printing technology |
6.3.1 Overview and Analysis |
6.3.2 Nigeria Pressure Labels Market Revenues & Volume, By Digital Printing, 2021-2031F |
6.3.3 Nigeria Pressure Labels Market Revenues & Volume, By Flexography, 2021-2031F |
6.3.4 Nigeria Pressure Labels Market Revenues & Volume, By Others, 2021-2031F |
7 Nigeria Pressure Labels Market Import-Export Trade Statistics |
7.1 Nigeria Pressure Labels Market Export to Major Countries |
7.2 Nigeria Pressure Labels Market Imports from Major Countries |
8 Nigeria Pressure Labels Market Key Performance Indicators |
8.1 Percentage increase in the number of labeling equipment installations |
8.2 Rate of adoption of sustainable and eco-friendly labeling materials |
8.3 Number of collaborations or partnerships between label manufacturers and packaging companies |
9 Nigeria Pressure Labels Market - Opportunity Assessment |
9.1 Nigeria Pressure Labels Market Opportunity Assessment, By Type, 2021 & 2031F |
9.2 Nigeria Pressure Labels Market Opportunity Assessment, By Composition, 2021 & 2031F |
9.3 Nigeria Pressure Labels Market Opportunity Assessment, By Printing technology, 2021 & 2031F |
10 Nigeria Pressure Labels Market - Competitive Landscape |
10.1 Nigeria Pressure Labels Market Revenue Share, By Companies, 2024 |
10.2 Nigeria Pressure Labels Market Competitive Benchmarking, By Operating and Technical Parameters |
11 Company Profiles |
12 Recommendations |
13 Disclaimer |
Export potential assessment - trade Analytics for 2030
Export potential enables firms to identify high-growth global markets with greater confidence by combining advanced trade intelligence with a structured quantitative methodology. The framework analyzes emerging demand trends and country-level import patterns while integrating macroeconomic and trade datasets such as GDP and population forecasts, bilateral import–export flows, tariff structures, elasticity differentials between developed and developing economies, geographic distance, and import demand projections. Using weighted trade values from 2020–2024 as the base period to project country-to-country export potential for 2030, these inputs are operationalized through calculated drivers such as gravity model parameters, tariff impact factors, and projected GDP per-capita growth. Through an analysis of hidden potentials, demand hotspots, and market conditions that are most favorable to success, this method enables firms to focus on target countries, maximize returns, and global expansion with data, backed by accuracy.
By factoring in the projected importer demand gap that is currently unmet and could be potential opportunity, it identifies the potential for the Exporter (Country) among 190 countries, against the general trade analysis, which identifies the biggest importer or exporter.
To discover high-growth global markets and optimize your business strategy:
Click Here
Pricing
- Single User License$ 1,995
- Department License$ 2,400
- Site License$ 3,120
- Global License$ 3,795

Search
Thought Leadership and Analyst Meet


Our Clients
Latest Reports
- Canada Cloud CFD Market (2026-2032) | Size & Revenue, Industry, Growth, Competitive Landscape, Forecast, Segmentation, Value, Outlook, Trends, Share, Analysis, Companies
- Taiwan Food Delivery Platform Market (2026-2032) | Companies, Outlook, Analysis, Trends, Value, Revenue, Segmentation, Share, Forecast, Competitive Landscape, Growth, Size & Forecast
- United Kingdom (UK) Long-term Care Insurance Market (2026-2032) | Growth, Share, Consumer Insights, Drivers, Opportunities, Competition, Pricing Analysis, Segments, Restraints, Companies, Competitive, Value, Outlook, Size, Demand, Analysis, Challenges, Strategic Insights, Investment Trends, Revenue, Trends, Supply, Forecast
- United Kingdom (UK) Long Term Care Market (2026-2032) | Companies, Outlook, Analysis, Trends, Value, Revenue, Segmentation, Share, Forecast, Competitive Landscape, Growth, Size & Forecast
- Iraq Insulation and Waterproofing Market (2026-2032) | Outlook, Drivers, Growth, Size, Share, Industry, Revenue, Trends, Demand, Competitive, Strategic Insights, Opportunities, Segments, Companies, Challenges, Strategy, Consumer Insights, Analysis, Investment Trends, Value, Segmentation, Forecast, Restraints
- India Switchgear Market Outlook (2026-2032) | Size, Share, Trends, Growth, Revenue, Forecast, Analysis, Value, Outlook
- Pakistan Contraceptive Implants Market (2025-2031) | Demand, Growth, Size, Share, Industry, Pricing Analysis, Competitive, Strategic Insights, Strategy, Consumer Insights, Analysis, Investment Trends, Opportunities, Revenue, Segments, Value, Segmentation, Supply, Forecast, Restraints, Outlook, Competition, Drivers, Trends, Companies, Challenges
- Sri Lanka Packaging Market (2026-2032) | Outlook, Competition, Drivers, Trends, Demand, Pricing Analysis, Competitive, Strategic Insights, Companies, Challenges, Strategy, Consumer Insights, Analysis, Investment Trends, Opportunities, Growth, Size, Share, Industry, Revenue, Segments, Value, Segmentation, Supply, Forecast, Restraints
- India Kids Watches Market (2026-2032) | Strategy, Consumer Insights, Analysis, Investment Trends, Opportunities, Growth, Size, Share, Industry, Revenue, Segments, Value, Segmentation, Supply, Forecast, Restraints, Outlook, Competition, Drivers, Trends, Demand, Pricing Analysis, Competitive, Strategic Insights, Companies, Challenges
- Saudi Arabia Core Assurance Service Market (2025-2031) | Strategy, Consumer Insights, Analysis, Investment Trends, Opportunities, Growth, Size, Share, Industry, Revenue, Segments, Value, Segmentation, Supply, Forecast, Restraints, Outlook, Competition, Drivers, Trends, Demand, Pricing Analysis, Competitive, Strategic Insights, Companies, Challenges
Industry Events and Analyst Meet

India EV Show 2026

EV tech India Expo 2026

Auto Tech Asia 2026

Battery Tech India 2026

Smart Production Solutions Guangzhou 2026
Whitepaper
- Middle East & Africa Commercial Security Market Click here to view more.
- Middle East & Africa Fire Safety Systems & Equipment Market Click here to view more.
- GCC Drone Market Click here to view more.
- Middle East Lighting Fixture Market Click here to view more.
- GCC Physical & Perimeter Security Market Click here to view more.
6WResearch In News
- Doha a strategic location for EV manufacturing hub: IPA Qatar
- Demand for luxury TVs surging in the GCC, says Samsung
- Empowering Growth: The Thriving Journey of Bangladesh’s Cable Industry
- Demand for luxury TVs surging in the GCC, says Samsung
- Video call with a traditional healer? Once unthinkable, it’s now common in South Africa
- Intelligent Buildings To Smooth GCC’s Path To Net Zero