Norway Clay Market (2025-2031) | Forecast, Share, Analysis, Outlook, Revenue, Segmentation, Growth, Industry, Size, Trends, Companies & Value
Market Forecast By Application (Tableware, Sanitary ware, Medical applications), By End Use (Ceramic and, Non-ceramic) And Competitive Landscape
| Product Code: ETC5257705 | Publication Date: Nov 2023 | Updated Date: Nov 2025 | Product Type: Market Research Report | |
| Publisher: 6Wresearch | Author: Bhawna Singh | No. of Pages: 60 | No. of Figures: 30 | No. of Tables: 5 |
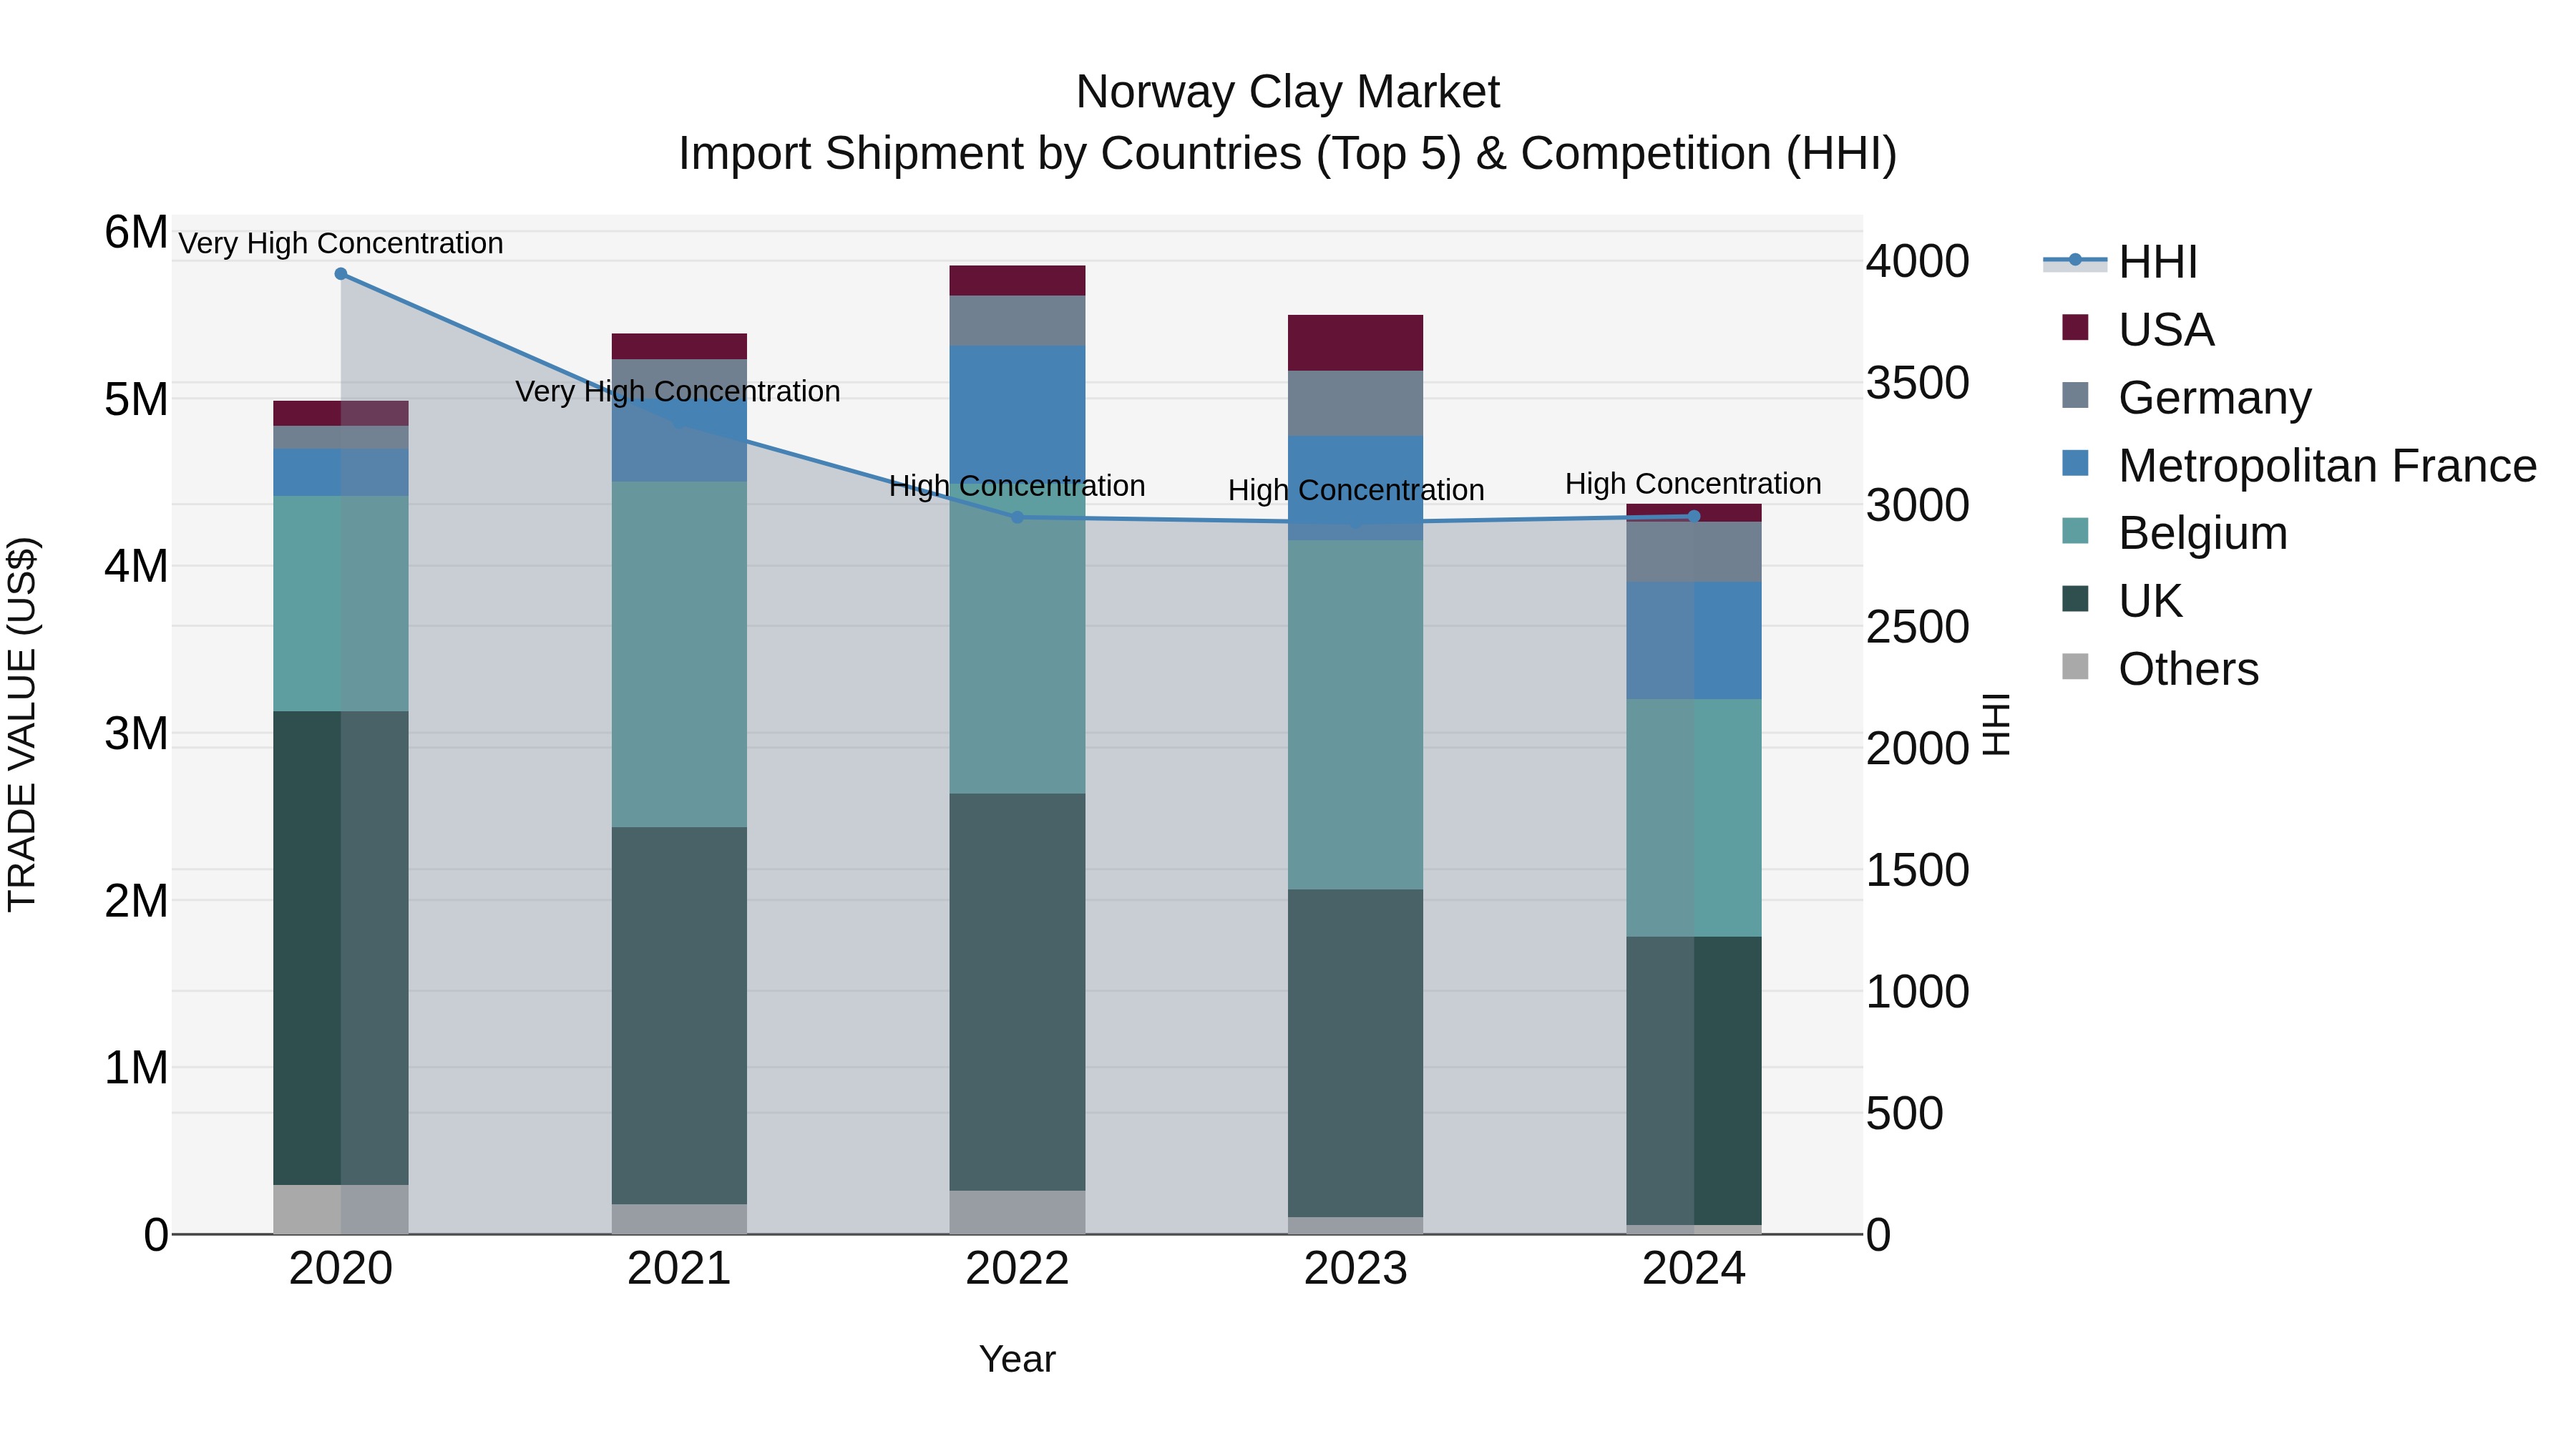
Norway Clay Market Top 5 Importing Countries and Market Competition (HHI) Analysis
Norway`s clay import market in 2024 continued to be dominated by a few key countries, including the UK, Belgium, Metropolitan France, Germany, and the USA. The high Herfindahl-Hirschman Index (HHI) indicates a concentrated market landscape. Despite a negative compound annual growth rate (CAGR) of -3.26% from 2020 to 2024, the steep decline in growth rate from 2023 to 2024 at -20.58% suggests a challenging year for the industry. Monitoring shifts in trade dynamics and exploring strategies to stimulate demand will be crucial for stakeholders in the Norwegian clay import market.
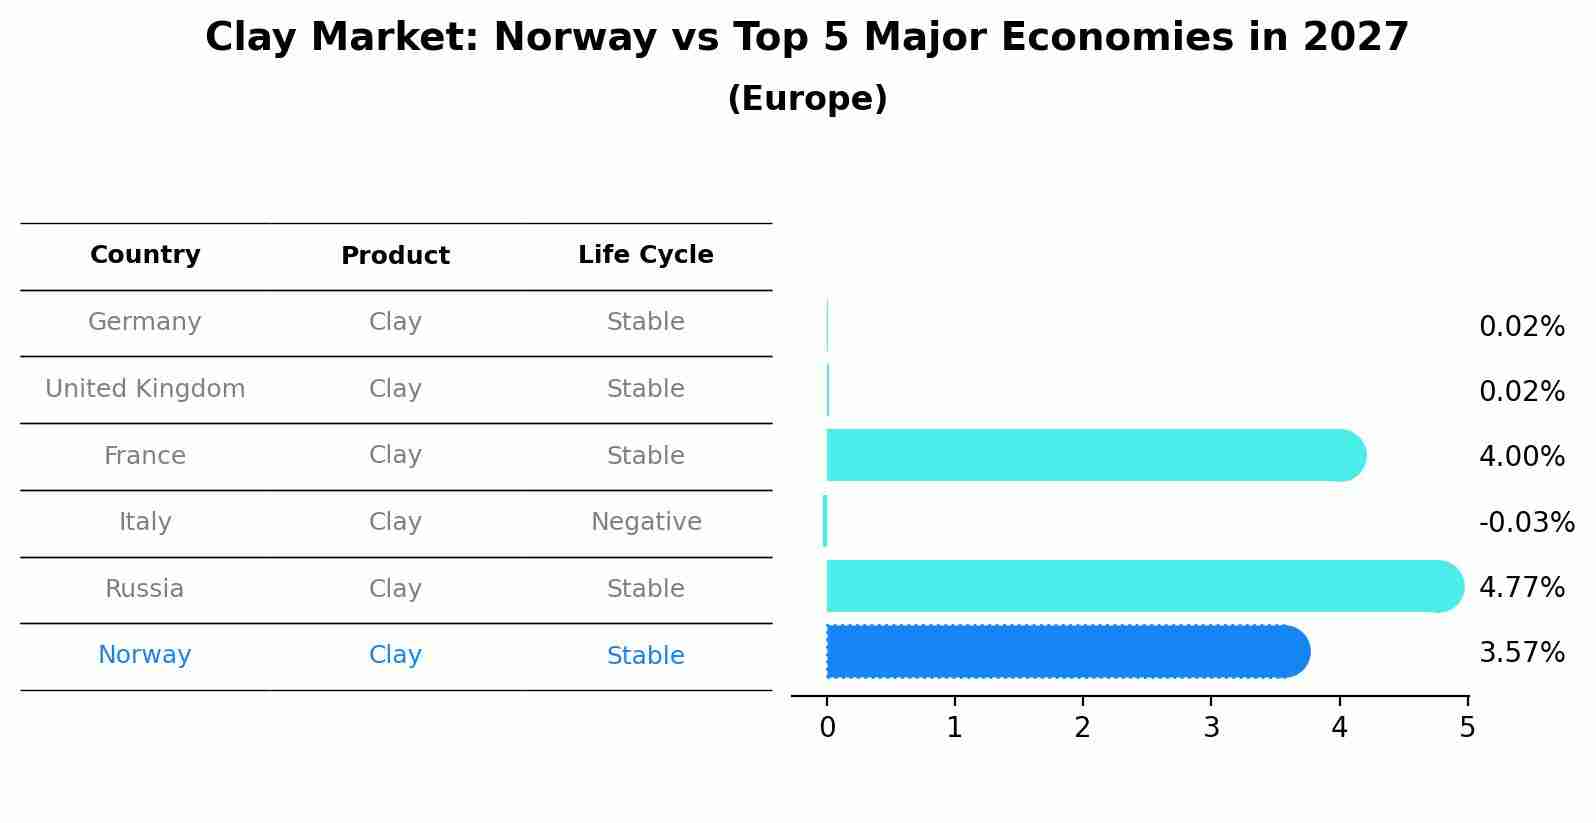
Clay Market: Norway vs Top 5 Major Economies in 2027 (Europe)
By 2027, Norway's Clay market is forecasted to achieve a stable growth rate of 3.57%, with Germany leading the Europe region, followed by United Kingdom, France, Italy and Russia.
Norway Clay Market Overview
The clay market in Norway is primarily influenced by its use in construction, ceramics, and industrial applications. Norways construction industry relies on clay products for bricks, tiles, and insulation materials. Additionally, the demand for high-quality ceramics for both domestic and industrial use continues to support the market for clay products.
Drivers of the market
The Norway Clay Market is driven by its use in the construction, ceramics, and manufacturing industries. The rising demand for clay in producing bricks, tiles, and sanitary ware, along with increased construction activities, supports market expansion.
Challenges of the market
The clay market in Norway encounters environmental challenges, particularly regarding the sustainability of clay extraction and its impact on local ecosystems. Additionally, the market is impacted by competition from alternative construction and ceramic materials that offer similar properties at lower costs.
Government Policy of the market
Norways clay market is regulated by government policies that oversee mining operations and promote environmental protection. The extraction of clay, used in construction, ceramics, and other industries, is subject to strict environmental regulations aimed at minimizing land degradation and protecting natural habitats. The government also encourages the recycling of clay products and supports the use of sustainable mining practices to ensure the long-term availability of this natural resource.
Key Highlights of the Report:
- Norway Clay Market Outlook
- Market Size of Norway Clay Market, 2024
- Forecast of Norway Clay Market, 2031
- Historical Data and Forecast of Norway Clay Revenues & Volume for the Period 2021-2031
- Norway Clay Market Trend Evolution
- Norway Clay Market Drivers and Challenges
- Norway Clay Price Trends
- Norway Clay Porter`s Five Forces
- Norway Clay Industry Life Cycle
- Historical Data and Forecast of Norway Clay Market Revenues & Volume By Application for the Period 2021-2031
- Historical Data and Forecast of Norway Clay Market Revenues & Volume By Tableware for the Period 2021-2031
- Historical Data and Forecast of Norway Clay Market Revenues & Volume By Sanitary ware for the Period 2021-2031
- Historical Data and Forecast of Norway Clay Market Revenues & Volume By Medical applications for the Period 2021-2031
- Historical Data and Forecast of Norway Clay Market Revenues & Volume By End Use for the Period 2021-2031
- Historical Data and Forecast of Norway Clay Market Revenues & Volume By Ceramic and for the Period 2021-2031
- Historical Data and Forecast of Norway Clay Market Revenues & Volume By Non-ceramic for the Period 2021-2031
- Norway Clay Import Export Trade Statistics
- Market Opportunity Assessment By Application
- Market Opportunity Assessment By End Use
- Norway Clay Top Companies Market Share
- Norway Clay Competitive Benchmarking By Technical and Operational Parameters
- Norway Clay Company Profiles
- Norway Clay Key Strategic Recommendations
Frequently Asked Questions About the Market Study (FAQs):
6Wresearch actively monitors the Norway Clay Market and publishes its comprehensive annual report, highlighting emerging trends, growth drivers, revenue analysis, and forecast outlook. Our insights help businesses to make data-backed strategic decisions with ongoing market dynamics. Our analysts track relevent industries related to the Norway Clay Market, allowing our clients with actionable intelligence and reliable forecasts tailored to emerging regional needs.
Yes, we provide customisation as per your requirements. To learn more, feel free to contact us on sales@6wresearch.com
1 Executive Summary |
2 Introduction |
2.1 Key Highlights of the Report |
2.2 Report Description |
2.3 Market Scope & Segmentation |
2.4 Research Methodology |
2.5 Assumptions |
3 Norway Clay Market Overview |
3.1 Norway Country Macro Economic Indicators |
3.2 Norway Clay Market Revenues & Volume, 2021 & 2031F |
3.3 Norway Clay Market - Industry Life Cycle |
3.4 Norway Clay Market - Porter's Five Forces |
3.5 Norway Clay Market Revenues & Volume Share, By Application, 2021 & 2031F |
3.6 Norway Clay Market Revenues & Volume Share, By End Use, 2021 & 2031F |
4 Norway Clay Market Dynamics |
4.1 Impact Analysis |
4.2 Market Drivers |
4.2.1 Increasing demand for sustainable and eco-friendly construction materials |
4.2.2 Growth in construction activities and infrastructure development in Norway |
4.2.3 Rising focus on energy-efficient buildings and insulation solutions |
4.3 Market Restraints |
4.3.1 Fluctuating raw material prices affecting production costs |
4.3.2 Regulatory challenges related to environmental standards and permits |
4.3.3 Competition from alternative construction materials such as concrete and steel |
5 Norway Clay Market Trends |
6 Norway Clay Market Segmentations |
6.1 Norway Clay Market, By Application |
6.1.1 Overview and Analysis |
6.1.2 Norway Clay Market Revenues & Volume, By Tableware, 2021-2031F |
6.1.3 Norway Clay Market Revenues & Volume, By Sanitary ware, 2021-2031F |
6.1.4 Norway Clay Market Revenues & Volume, By Medical applications, 2021-2031F |
6.2 Norway Clay Market, By End Use |
6.2.1 Overview and Analysis |
6.2.2 Norway Clay Market Revenues & Volume, By Ceramic and, 2021-2031F |
6.2.3 Norway Clay Market Revenues & Volume, By Non-ceramic, 2021-2031F |
7 Norway Clay Market Import-Export Trade Statistics |
7.1 Norway Clay Market Export to Major Countries |
7.2 Norway Clay Market Imports from Major Countries |
8 Norway Clay Market Key Performance Indicators |
8.1 Percentage increase in adoption of green building certifications |
8.2 Number of new construction projects initiated in Norway |
8.3 Growth in demand for energy-efficient building solutions |
8.4 Average selling price of clay products in the market |
8.5 Number of research and development initiatives focused on improving clay products' performance and sustainability |
9 Norway Clay Market - Opportunity Assessment |
9.1 Norway Clay Market Opportunity Assessment, By Application, 2021 & 2031F |
9.2 Norway Clay Market Opportunity Assessment, By End Use, 2021 & 2031F |
10 Norway Clay Market - Competitive Landscape |
10.1 Norway Clay Market Revenue Share, By Companies, 2024 |
10.2 Norway Clay Market Competitive Benchmarking, By Operating and Technical Parameters |
11 Company Profiles |
12 Recommendations | 13 Disclaimer |
Export potential assessment - trade Analytics for 2030
Export potential enables firms to identify high-growth global markets with greater confidence by combining advanced trade intelligence with a structured quantitative methodology. The framework analyzes emerging demand trends and country-level import patterns while integrating macroeconomic and trade datasets such as GDP and population forecasts, bilateral import–export flows, tariff structures, elasticity differentials between developed and developing economies, geographic distance, and import demand projections. Using weighted trade values from 2020–2024 as the base period to project country-to-country export potential for 2030, these inputs are operationalized through calculated drivers such as gravity model parameters, tariff impact factors, and projected GDP per-capita growth. Through an analysis of hidden potentials, demand hotspots, and market conditions that are most favorable to success, this method enables firms to focus on target countries, maximize returns, and global expansion with data, backed by accuracy.
By factoring in the projected importer demand gap that is currently unmet and could be potential opportunity, it identifies the potential for the Exporter (Country) among 190 countries, against the general trade analysis, which identifies the biggest importer or exporter.
To discover high-growth global markets and optimize your business strategy:
Click Here
Pricing
- Single User License$ 1,995
- Department License$ 2,400
- Site License$ 3,120
- Global License$ 3,795

Search
Thought Leadership and Analyst Meet


Our Clients
Latest Reports
- India Ultrasonic Smart Water Meter Market (2026-2032) | Outlook, Competition, Drivers, Trends, Demand, Competitive, Strategic Insights, Companies, Challenges, Strategy, Consumer Insights, Analysis, Opportunities, Growth, Size, Share, Industry, Revenue, Segments, Value, Segmentation, Supply, Forecast, Restraints,
- India Electromagnetic Bulk Flow Meter Market (2026-2032) | Analysis, Challenges, Strategic Insights, Supply, Forecast, Growth, Share, Consumer Insights, Competitive, Value, Outlook, Size & Demand,
- India Battery Powered Bulk Flow Meter Market (2026-2032) | Outlook, Analysis, Competitive Landscape, Growth, Size, Trends, Value, Revenue, Companies, Segmentation, Share & Forecast
- Bosnia and Herzegovina Fuel-Efficient Winglets Market (2026-2032) | Growth, Competition, Strategy, Restraints, Trends, Challenges, segmentation, Value, Outlook, Investment Opportunities, Analysis, Revenue, Companies, Insights, Pricing, Size, Drivers, Demand, Share, Forecast
- Canada Cloud CFD Market (2026-2032) | Size & Revenue, Industry, Growth, Competitive Landscape, Forecast, Segmentation, Value, Outlook, Trends, Share, Analysis, Companies
- Taiwan Food Delivery Platform Market (2026-2032) | Companies, Outlook, Analysis, Trends, Value, Revenue, Segmentation, Share, Forecast, Competitive Landscape, Growth, Size & Forecast
- United Kingdom (UK) Long-term Care Insurance Market (2026-2032) | Growth, Share, Consumer Insights, Drivers, Opportunities, Competition, Pricing Analysis, Segments, Restraints, Companies, Competitive, Value, Outlook, Size, Demand, Analysis, Challenges, Strategic Insights, Investment Trends, Revenue, Trends, Supply, Forecast
- United Kingdom (UK) Long Term Care Market (2026-2032) | Companies, Outlook, Analysis, Trends, Value, Revenue, Segmentation, Share, Forecast, Competitive Landscape, Growth, Size & Forecast
- Iraq Insulation and Waterproofing Market (2026-2032) | Outlook, Drivers, Growth, Size, Share, Industry, Revenue, Trends, Demand, Competitive, Strategic Insights, Opportunities, Segments, Companies, Challenges, Strategy, Consumer Insights, Analysis, Investment Trends, Value, Segmentation, Forecast, Restraints
- India Switchgear Market Outlook (2026-2032) | Size, Share, Trends, Growth, Revenue, Forecast, Analysis, Value, Outlook
Industry Events and Analyst Meet

India EV Show 2026

EV tech India Expo 2026

Auto Tech Asia 2026

Battery Tech India 2026

Smart Production Solutions Guangzhou 2026
Whitepaper
- Middle East & Africa Commercial Security Market Click here to view more.
- Middle East & Africa Fire Safety Systems & Equipment Market Click here to view more.
- GCC Drone Market Click here to view more.
- Middle East Lighting Fixture Market Click here to view more.
- GCC Physical & Perimeter Security Market Click here to view more.
6WResearch In News
- Doha a strategic location for EV manufacturing hub: IPA Qatar
- Demand for luxury TVs surging in the GCC, says Samsung
- Empowering Growth: The Thriving Journey of Bangladesh’s Cable Industry
- Demand for luxury TVs surging in the GCC, says Samsung
- Video call with a traditional healer? Once unthinkable, it’s now common in South Africa
- Intelligent Buildings To Smooth GCC’s Path To Net Zero