Norway Industrial Hemp Market (2025-2031) | Forecast, Trends, Analysis, Share, Growth, Industry, Value, Outlook, Size, Companies, Revenue & Segmentation
Market Forecast By Product (Seeds, Fiber, Shives), By Application (Animal Care, Textiles, Automotive, Furniture, Food & Beverages, Paper, Construction Materials, Other) And Competitive Landscape
| Product Code: ETC4766137 | Publication Date: Nov 2023 | Updated Date: Nov 2025 | Product Type: Market Research Report | |
| Publisher: 6Wresearch | Author: Sachin Kumar Rai | No. of Pages: 60 | No. of Figures: 30 | No. of Tables: 5 |
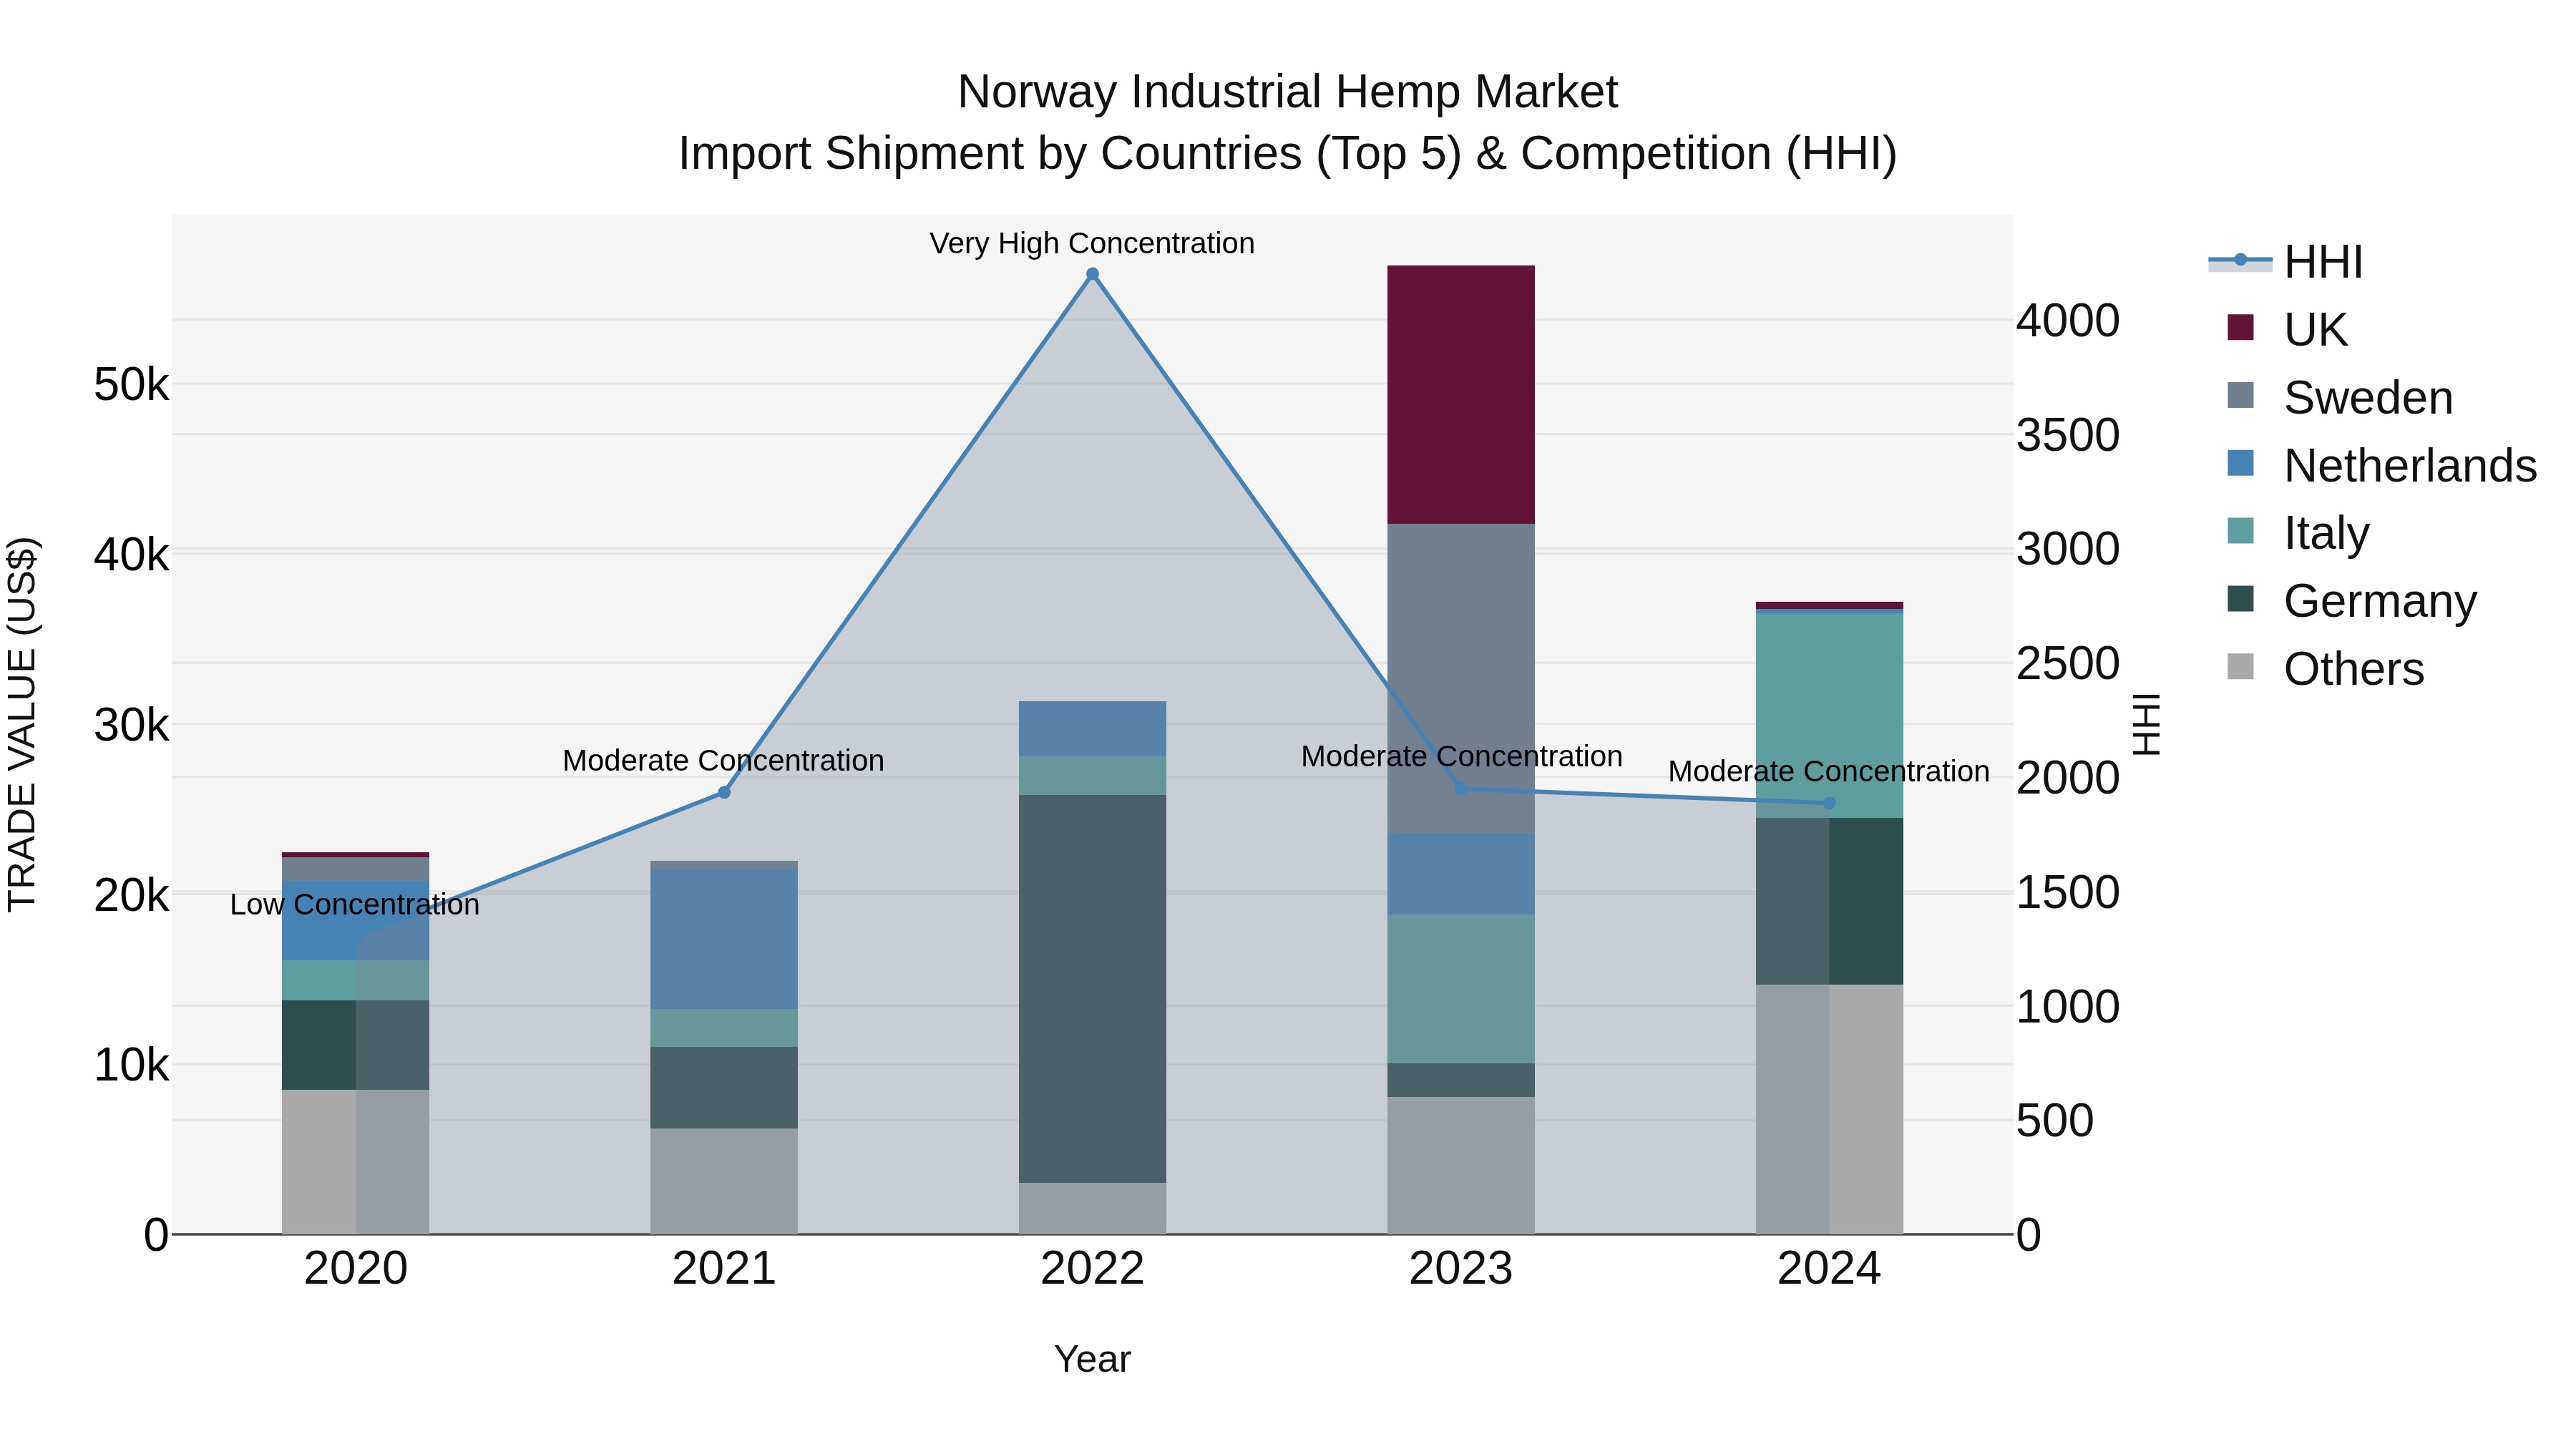
Norway Industrial Hemp Market Top 5 Importing Countries and Market Competition (HHI) Analysis
Norway`s industrial hemp import market saw significant concentration in 2024, with Italy, Germany, Denmark, Metropolitan France, and Spain emerging as top exporters. Despite a notable CAGR of 13.44% from 2020 to 2024, there was a sharp decline in growth rate by -34.69% in 2024 compared to the previous year. This indicates a dynamic market landscape that may warrant further analysis to understand the factors influencing these fluctuations in import trends.
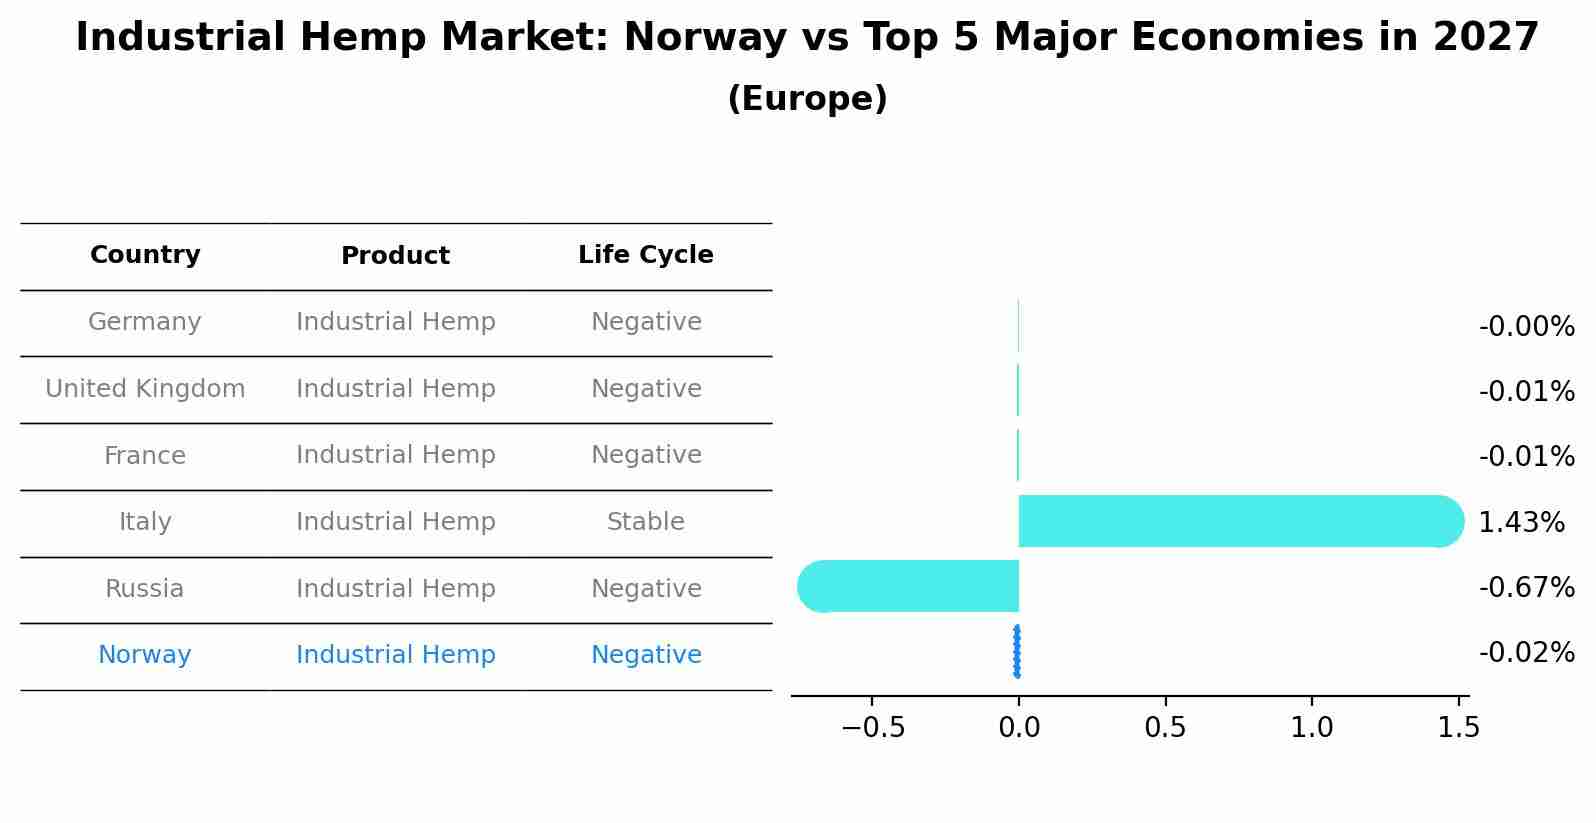
Industrial Hemp Market: Norway vs Top 5 Major Economies in 2027 (Europe)
By 2027, Norway's Industrial Hemp market is forecasted to achieve a negative growth rate of -0.02%, with Germany leading the Europe region, followed by United Kingdom, France, Italy and Russia.
Norway Industrial Hemp Market Overview
The industrial hemp market in Norway is growing due to increasing interest in hemp-based products for various applications, including textiles, construction materials, and health supplements. Industrial hemp offers sustainable and eco-friendly alternatives to traditional materials. The market is driven by growing awareness of hemp`s benefits, advancements in processing technologies, and rising demand for sustainable and natural products.
Drivers of the market
The industrial hemp market in Norway is influenced by the growing use of hemp in various industrial applications, including textiles, construction, and biocomposites. Industrial hemp offers benefits such as sustainability and versatility. The market benefits from increasing awareness of hemp`s environmental benefits, advancements in hemp processing technologies, and growing demand for sustainable and eco-friendly materials.
Challenges of the market
The industrial hemp market in Norway is impacted by regulatory challenges and fluctuating market demand. Additionally, high production costs and competition from other natural fibers pose significant market pressures.
Government Policy of the market
Government policies in Norways industrial hemp market emphasize sustainability, safety, and quality. Regulations ensure that industrial hemp products meet standards for safety and effectiveness in various applications. The government supports the development of hemp-based technologies and products that adhere to regulatory requirements.
Key Highlights of the Report:
- Norway Industrial Hemp Market Outlook
- Market Size of Norway Industrial Hemp Market, 2024
- Forecast of Norway Industrial Hemp Market, 2031
- Historical Data and Forecast of Norway Industrial Hemp Revenues & Volume for the Period 2021-2031
- Norway Industrial Hemp Market Trend Evolution
- Norway Industrial Hemp Market Drivers and Challenges
- Norway Industrial Hemp Price Trends
- Norway Industrial Hemp Porter`s Five Forces
- Norway Industrial Hemp Industry Life Cycle
- Historical Data and Forecast of Norway Industrial Hemp Market Revenues & Volume By Product for the Period 2021-2031
- Historical Data and Forecast of Norway Industrial Hemp Market Revenues & Volume By Seeds for the Period 2021-2031
- Historical Data and Forecast of Norway Industrial Hemp Market Revenues & Volume By Fiber for the Period 2021-2031
- Historical Data and Forecast of Norway Industrial Hemp Market Revenues & Volume By Shives for the Period 2021-2031
- Historical Data and Forecast of Norway Industrial Hemp Market Revenues & Volume By Application for the Period 2021-2031
- Historical Data and Forecast of Norway Industrial Hemp Market Revenues & Volume By Animal Care for the Period 2021-2031
- Historical Data and Forecast of Norway Industrial Hemp Market Revenues & Volume By Textiles for the Period 2021-2031
- Historical Data and Forecast of Norway Industrial Hemp Market Revenues & Volume By Automotive for the Period 2021-2031
- Historical Data and Forecast of Norway Industrial Hemp Market Revenues & Volume By Furniture for the Period 2021-2031
- Historical Data and Forecast of Norway Industrial Hemp Market Revenues & Volume By Food & Beverages for the Period 2021-2031
- Historical Data and Forecast of Norway Industrial Hemp Market Revenues & Volume By Paper for the Period 2021-2031
- Historical Data and Forecast of Norway Industrial Hemp Market Revenues & Volume By Construction Materials for the Period 2021-2031
- Historical Data and Forecast of Norway Industrial Hemp Market Revenues & Volume By Other for the Period 2021-2031
- Norway Industrial Hemp Import Export Trade Statistics
- Market Opportunity Assessment By Product
- Market Opportunity Assessment By Application
- Norway Industrial Hemp Top Companies Market Share
- Norway Industrial Hemp Competitive Benchmarking By Technical and Operational Parameters
- Norway Industrial Hemp Company Profiles
- Norway Industrial Hemp Key Strategic Recommendations
Frequently Asked Questions About the Market Study (FAQs):
6Wresearch actively monitors the Norway Industrial Hemp Market and publishes its comprehensive annual report, highlighting emerging trends, growth drivers, revenue analysis, and forecast outlook. Our insights help businesses to make data-backed strategic decisions with ongoing market dynamics. Our analysts track relevent industries related to the Norway Industrial Hemp Market, allowing our clients with actionable intelligence and reliable forecasts tailored to emerging regional needs.
Yes, we provide customisation as per your requirements. To learn more, feel free to contact us on sales@6wresearch.com
1 Executive Summary |
2 Introduction |
2.1 Key Highlights of the Report |
2.2 Report Description |
2.3 Market Scope & Segmentation |
2.4 Research Methodology |
2.5 Assumptions |
3 Norway Industrial Hemp Market Overview |
3.1 Norway Country Macro Economic Indicators |
3.2 Norway Industrial Hemp Market Revenues & Volume, 2021 & 2031F |
3.3 Norway Industrial Hemp Market - Industry Life Cycle |
3.4 Norway Industrial Hemp Market - Porter's Five Forces |
3.5 Norway Industrial Hemp Market Revenues & Volume Share, By Product, 2021 & 2031F |
3.6 Norway Industrial Hemp Market Revenues & Volume Share, By Application, 2021 & 2031F |
4 Norway Industrial Hemp Market Dynamics |
4.1 Impact Analysis |
4.2 Market Drivers |
4.2.1 Increasing demand for sustainable and eco-friendly products |
4.2.2 Growing awareness about the benefits of industrial hemp in various industries |
4.2.3 Favorable government regulations supporting the industrial hemp industry in Norway |
4.3 Market Restraints |
4.3.1 Limited awareness and understanding of industrial hemp products among consumers |
4.3.2 High initial investment costs for setting up industrial hemp cultivation and processing facilities |
4.3.3 Stringent regulations on THC content in industrial hemp products |
5 Norway Industrial Hemp Market Trends |
6 Norway Industrial Hemp Market Segmentations |
6.1 Norway Industrial Hemp Market, By Product |
6.1.1 Overview and Analysis |
6.1.2 Norway Industrial Hemp Market Revenues & Volume, By Seeds, 2021-2031F |
6.1.3 Norway Industrial Hemp Market Revenues & Volume, By Fiber, 2021-2031F |
6.1.4 Norway Industrial Hemp Market Revenues & Volume, By Shives, 2021-2031F |
6.2 Norway Industrial Hemp Market, By Application |
6.2.1 Overview and Analysis |
6.2.2 Norway Industrial Hemp Market Revenues & Volume, By Animal Care, 2021-2031F |
6.2.3 Norway Industrial Hemp Market Revenues & Volume, By Textiles, 2021-2031F |
6.2.4 Norway Industrial Hemp Market Revenues & Volume, By Automotive, 2021-2031F |
6.2.5 Norway Industrial Hemp Market Revenues & Volume, By Furniture, 2021-2031F |
6.2.6 Norway Industrial Hemp Market Revenues & Volume, By Food & Beverages, 2021-2031F |
6.2.7 Norway Industrial Hemp Market Revenues & Volume, By Paper, 2021-2031F |
6.2.8 Norway Industrial Hemp Market Revenues & Volume, By Other, 2021-2031F |
6.2.9 Norway Industrial Hemp Market Revenues & Volume, By Other, 2021-2031F |
7 Norway Industrial Hemp Market Import-Export Trade Statistics |
7.1 Norway Industrial Hemp Market Export to Major Countries |
7.2 Norway Industrial Hemp Market Imports from Major Countries |
8 Norway Industrial Hemp Market Key Performance Indicators |
8.1 Percentage of industrial hemp products used as raw materials in various industries |
8.2 Number of research studies and publications on the benefits of industrial hemp |
8.3 Percentage of agricultural land in Norway allocated for industrial hemp cultivation |
9 Norway Industrial Hemp Market - Opportunity Assessment |
9.1 Norway Industrial Hemp Market Opportunity Assessment, By Product, 2021 & 2031F |
9.2 Norway Industrial Hemp Market Opportunity Assessment, By Application, 2021 & 2031F |
10 Norway Industrial Hemp Market - Competitive Landscape |
10.1 Norway Industrial Hemp Market Revenue Share, By Companies, 2024 |
10.2 Norway Industrial Hemp Market Competitive Benchmarking, By Operating and Technical Parameters |
11 Company Profiles |
12 Recommendations | 13 Disclaimer |
Export potential assessment - trade Analytics for 2030
Export potential enables firms to identify high-growth global markets with greater confidence by combining advanced trade intelligence with a structured quantitative methodology. The framework analyzes emerging demand trends and country-level import patterns while integrating macroeconomic and trade datasets such as GDP and population forecasts, bilateral import–export flows, tariff structures, elasticity differentials between developed and developing economies, geographic distance, and import demand projections. Using weighted trade values from 2020–2024 as the base period to project country-to-country export potential for 2030, these inputs are operationalized through calculated drivers such as gravity model parameters, tariff impact factors, and projected GDP per-capita growth. Through an analysis of hidden potentials, demand hotspots, and market conditions that are most favorable to success, this method enables firms to focus on target countries, maximize returns, and global expansion with data, backed by accuracy.
By factoring in the projected importer demand gap that is currently unmet and could be potential opportunity, it identifies the potential for the Exporter (Country) among 190 countries, against the general trade analysis, which identifies the biggest importer or exporter.
To discover high-growth global markets and optimize your business strategy:
Click Here
Pricing
- Single User License$ 1,995
- Department License$ 2,400
- Site License$ 3,120
- Global License$ 3,795

Search
Thought Leadership and Analyst Meet


Our Clients
Latest Reports
- United Kingdom (UK) Long-term Care Insurance Market (2026-2032) | Growth, Share, Consumer Insights, Drivers, Opportunities, Competition, Pricing Analysis, Segments, Restraints, Companies, Competitive, Value, Outlook, Size, Demand, Analysis, Challenges, Strategic Insights, Investment Trends, Revenue, Trends, Supply, Forecast
- United Kingdom (UK) Long Term Care Market (2026-2032) | Companies, Outlook, Analysis, Trends, Value, Revenue, Segmentation, Share, Forecast, Competitive Landscape, Growth, Size & Forecast
- Iraq Insulation and Waterproofing Market (2026-2032) | Outlook, Drivers, Growth, Size, Share, Industry, Revenue, Trends, Demand, Competitive, Strategic Insights, Opportunities, Segments, Companies, Challenges, Strategy, Consumer Insights, Analysis, Investment Trends, Value, Segmentation, Forecast, Restraints
- India Switchgear Market Outlook (2026 - 2032) | Size, Share, Trends, Growth, Revenue, Forecast, Analysis, Value, Outlook
- Pakistan Contraceptive Implants Market (2025-2031) | Demand, Growth, Size, Share, Industry, Pricing Analysis, Competitive, Strategic Insights, Strategy, Consumer Insights, Analysis, Investment Trends, Opportunities, Revenue, Segments, Value, Segmentation, Supply, Forecast, Restraints, Outlook, Competition, Drivers, Trends, Companies, Challenges
- Sri Lanka Packaging Market (2026-2032) | Outlook, Competition, Drivers, Trends, Demand, Pricing Analysis, Competitive, Strategic Insights, Companies, Challenges, Strategy, Consumer Insights, Analysis, Investment Trends, Opportunities, Growth, Size, Share, Industry, Revenue, Segments, Value, Segmentation, Supply, Forecast, Restraints
- India Kids Watches Market (2026-2032) | Strategy, Consumer Insights, Analysis, Investment Trends, Opportunities, Growth, Size, Share, Industry, Revenue, Segments, Value, Segmentation, Supply, Forecast, Restraints, Outlook, Competition, Drivers, Trends, Demand, Pricing Analysis, Competitive, Strategic Insights, Companies, Challenges
- Saudi Arabia Core Assurance Service Market (2025-2031) | Strategy, Consumer Insights, Analysis, Investment Trends, Opportunities, Growth, Size, Share, Industry, Revenue, Segments, Value, Segmentation, Supply, Forecast, Restraints, Outlook, Competition, Drivers, Trends, Demand, Pricing Analysis, Competitive, Strategic Insights, Companies, Challenges
- Romania Uninterruptible Power Supply (UPS) Market (2026-2032) | Industry, Analysis, Revenue, Size, Forecast, Outlook, Value, Trends, Share, Growth & Companies
- Saudi Arabia Car Window Tinting Film, Paint Protection Film (PPF), and Ceramic Coating Market (2025-2031) | Strategy, Consumer Insights, Analysis, Investment Trends, Opportunities, Growth, Size, Share, Industry, Revenue, Segments, Value, Segmentation, Supply, Forecast, Restraints, Outlook, Competition, Drivers, Trends, Demand, Pricing Analysis, Competitive, Strategic Insights, Companies, Challenges
Industry Events and Analyst Meet

India EV Show 2026

EV tech India Expo 2026

Auto Tech Asia 2026

Battery Tech India 2026

Smart Production Solutions Guangzhou 2026
Whitepaper
- Middle East & Africa Commercial Security Market Click here to view more.
- Middle East & Africa Fire Safety Systems & Equipment Market Click here to view more.
- GCC Drone Market Click here to view more.
- Middle East Lighting Fixture Market Click here to view more.
- GCC Physical & Perimeter Security Market Click here to view more.
6WResearch In News
- Doha a strategic location for EV manufacturing hub: IPA Qatar
- Demand for luxury TVs surging in the GCC, says Samsung
- Empowering Growth: The Thriving Journey of Bangladesh’s Cable Industry
- Demand for luxury TVs surging in the GCC, says Samsung
- Video call with a traditional healer? Once unthinkable, it’s now common in South Africa
- Intelligent Buildings To Smooth GCC’s Path To Net Zero