Norway Kitchen and cleaning cloth Market (2026-2032) | Segmentation, Forecast, Size, Trends, Share, Analysis, Growth, Industry, Value, Companies, Revenue & Outlook
Market Forecast By Product Type (Sourcing Pads, Scrubbers, and Sponges, Mops and Brooms, Cleaning Brushes, Wipes, Gloves, Others), By End-users (Commercial, Residential), By Distribution Channel (Supermarkets and Hypermarkets, Convenience Stores, Specialty Stores, Online Stores, Others) And Competitive Landscape
| Product Code: ETC5220199 | Publication Date: Nov 2023 | Updated Date: Apr 2026 | Product Type: Market Research Report | |
| Publisher: 6Wresearch | Author: Shubham Padhi | No. of Pages: 60 | No. of Figures: 30 | No. of Tables: 5 |
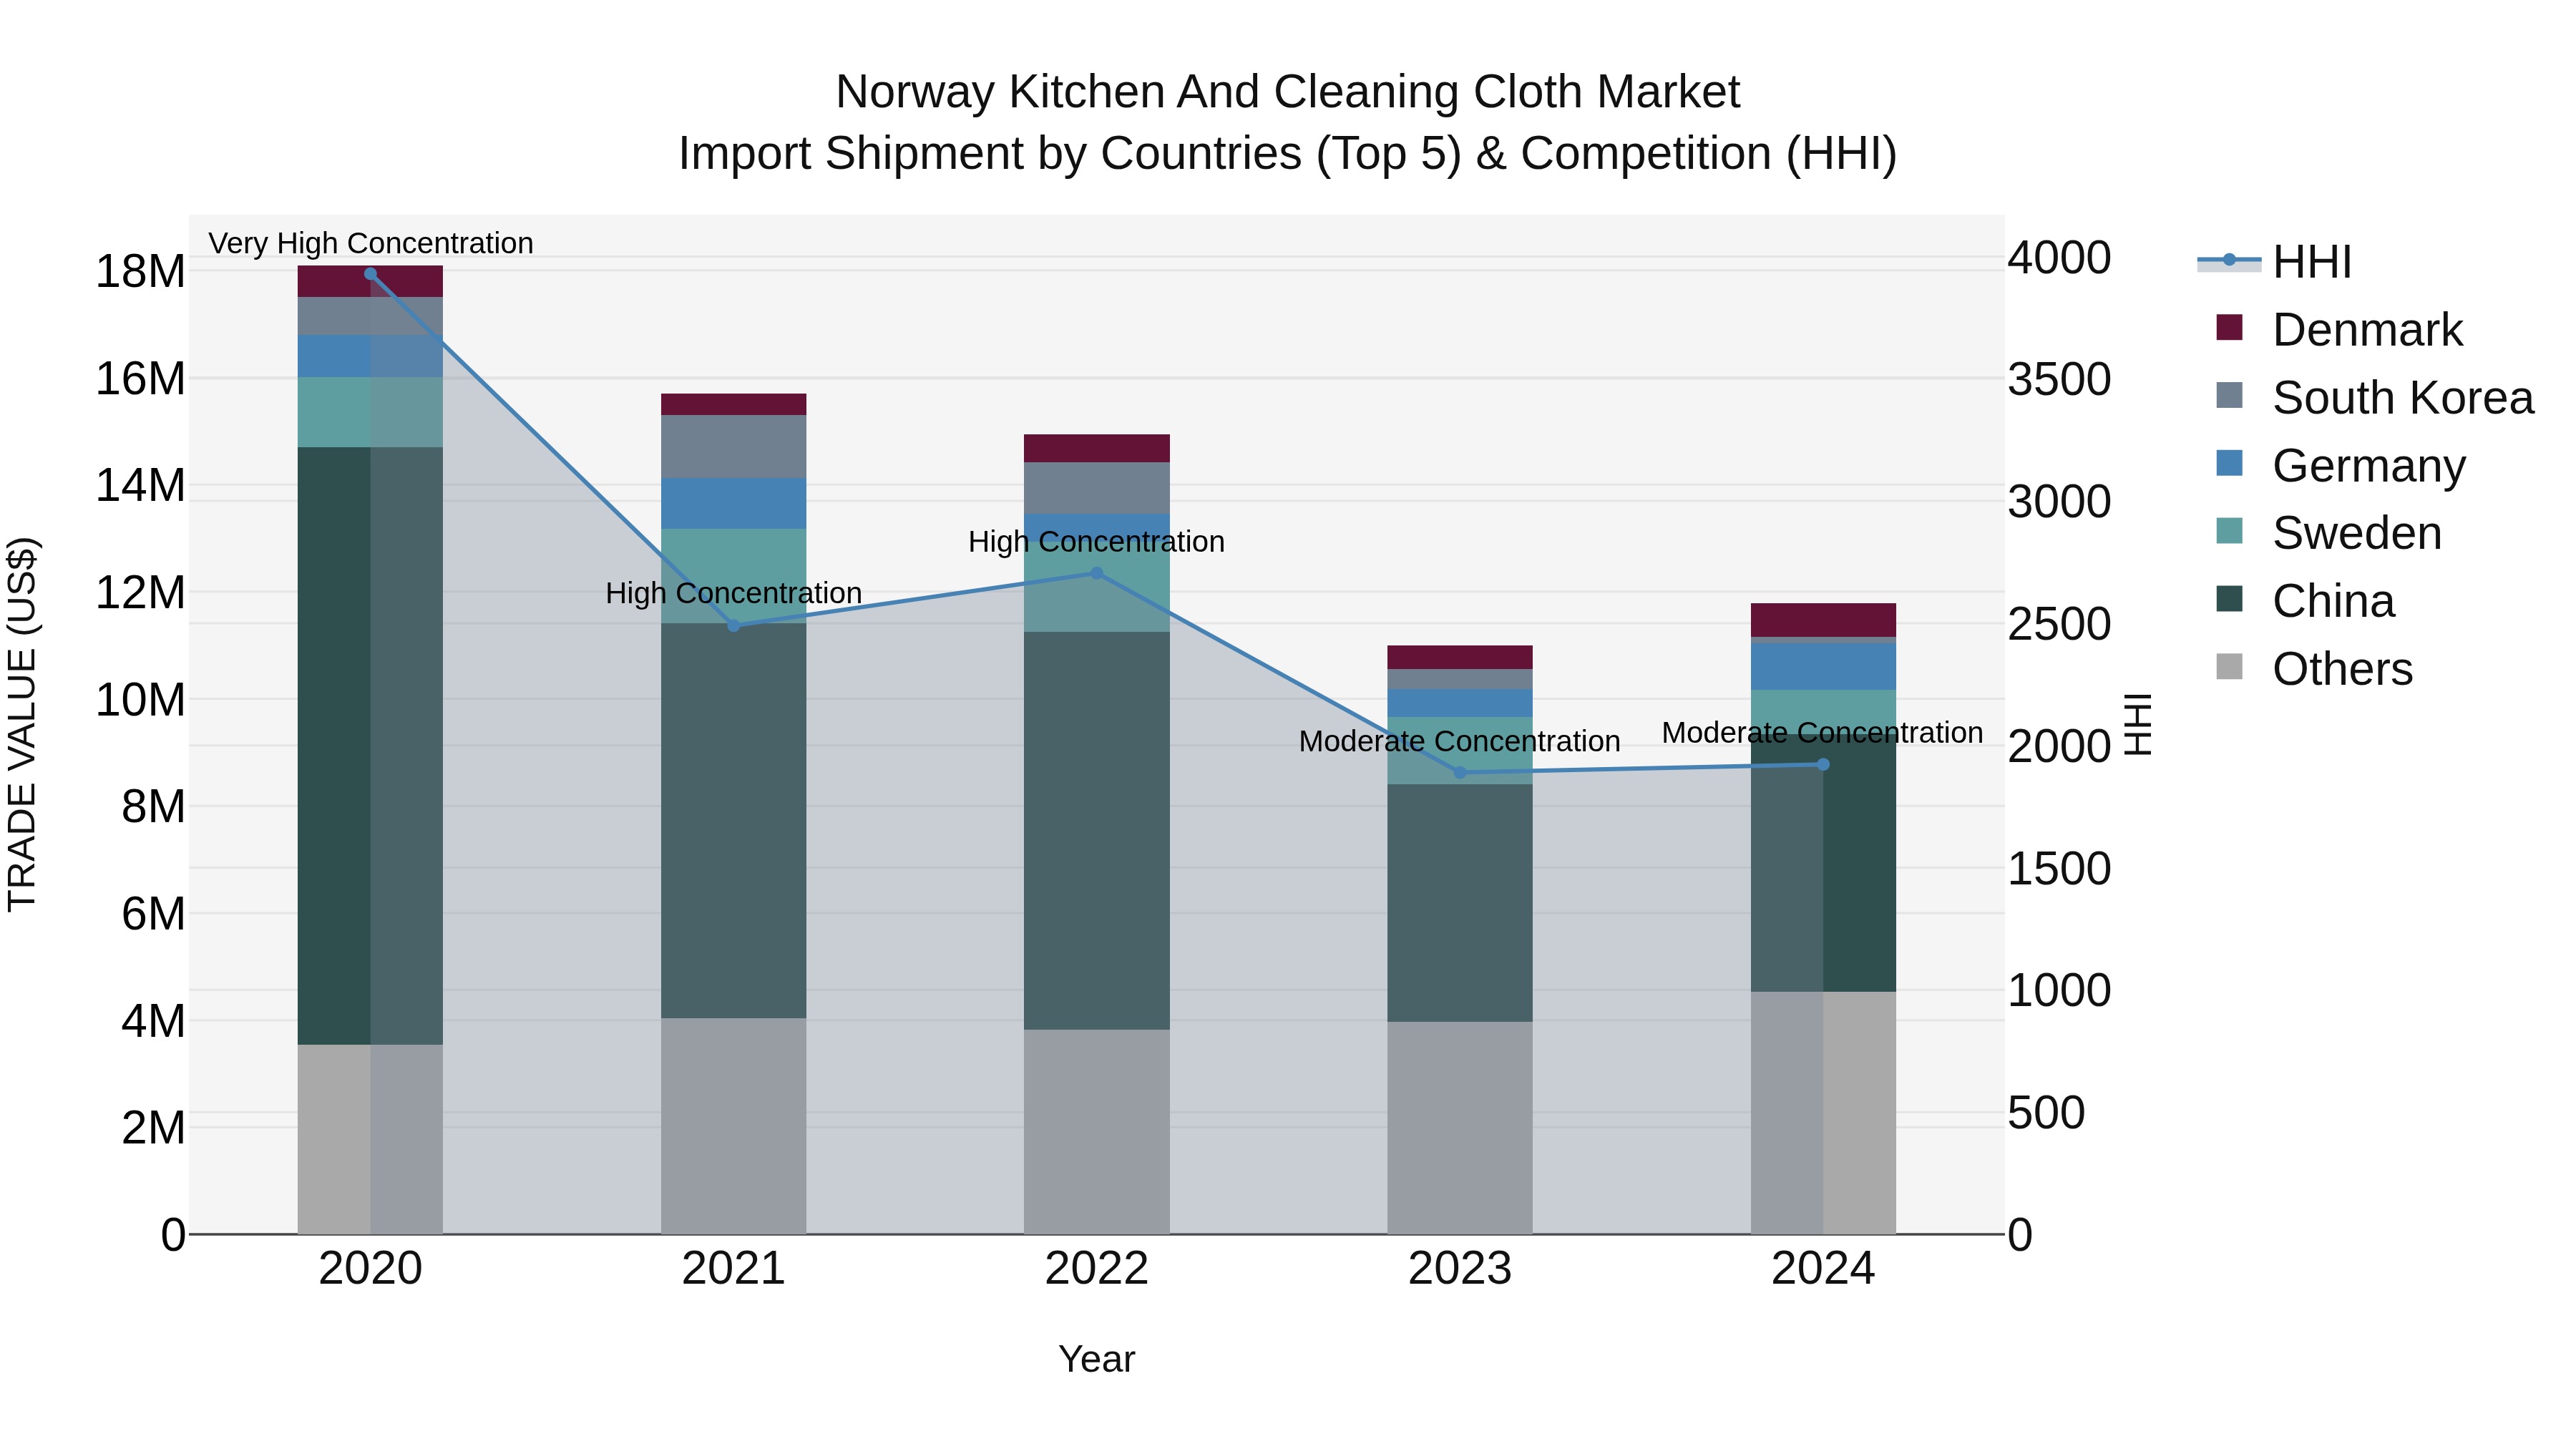
Norway Kitchen And Cleaning Cloth Market Top 5 Importing Countries and Market Competition (HHI) Analysis
Despite a negative CAGR from 2020 to 2024, the Norway kitchen and cleaning cloth import market saw a positive growth rate of 7.12% in 2024. The top exporting countries to Norway in this sector were China, Vietnam, Germany, Sweden, and Denmark. With moderate concentration indicated by the HHI, these import shipments suggest a diverse sourcing strategy for Norwegian retailers. The growth rate in 2024 indicates a potential rebound in demand for these products, potentially driven by changing consumer preferences or market dynamics.
Key Highlights of the Report:
- Norway Kitchen and cleaning cloth Market Outlook
- Market Size of Norway Kitchen and cleaning cloth Market, 2025
- Forecast of Norway Kitchen and cleaning cloth Market, 2032
- Historical Data and Forecast of Norway Kitchen and cleaning cloth Revenues & Volume for the Period 2022 - 2032F
- Norway Kitchen and cleaning cloth Market Trend Evolution
- Norway Kitchen and cleaning cloth Market Drivers and Challenges
- Norway Kitchen and cleaning cloth Price Trends
- Norway Kitchen and cleaning cloth Porter`s Five Forces
- Norway Kitchen and cleaning cloth Industry Life Cycle
- Historical Data and Forecast of Norway Kitchen and cleaning cloth Market Revenues & Volume By Product Type for the Period 2022 - 2032F
- Historical Data and Forecast of Norway Kitchen and cleaning cloth Market Revenues & Volume By Sourcing Pads, Scrubbers, and Sponges for the Period 2022 - 2032F
- Historical Data and Forecast of Norway Kitchen and cleaning cloth Market Revenues & Volume By Mops and Brooms for the Period 2022 - 2032F
- Historical Data and Forecast of Norway Kitchen and cleaning cloth Market Revenues & Volume By Cleaning Brushes for the Period 2022 - 2032F
- Historical Data and Forecast of Norway Kitchen and cleaning cloth Market Revenues & Volume By Wipes for the Period 2022 - 2032F
- Historical Data and Forecast of Norway Kitchen and cleaning cloth Market Revenues & Volume By Gloves for the Period 2022 - 2032F
- Historical Data and Forecast of Norway Kitchen and cleaning cloth Market Revenues & Volume By Others for the Period 2022 - 2032F
- Historical Data and Forecast of Norway Kitchen and cleaning cloth Market Revenues & Volume By End-users for the Period 2022 - 2032F
- Historical Data and Forecast of Norway Kitchen and cleaning cloth Market Revenues & Volume By Commercial for the Period 2022 - 2032F
- Historical Data and Forecast of Norway Kitchen and cleaning cloth Market Revenues & Volume By Residential for the Period 2022 - 2032F
- Historical Data and Forecast of Norway Kitchen and cleaning cloth Market Revenues & Volume By Distribution Channel for the Period 2022 - 2032F
- Historical Data and Forecast of Norway Kitchen and cleaning cloth Market Revenues & Volume By Supermarkets and Hypermarkets for the Period 2022 - 2032F
- Historical Data and Forecast of Norway Kitchen and cleaning cloth Market Revenues & Volume By Convenience Stores for the Period 2022 - 2032F
- Historical Data and Forecast of Norway Kitchen and cleaning cloth Market Revenues & Volume By Specialty Stores for the Period 2022 - 2032F
- Historical Data and Forecast of Norway Kitchen and cleaning cloth Market Revenues & Volume By Online Stores for the Period 2022 - 2032F
- Historical Data and Forecast of Norway Kitchen and cleaning cloth Market Revenues & Volume By Others for the Period 2022 - 2032F
- Norway Kitchen and cleaning cloth Import Export Trade Statistics
- Market Opportunity Assessment By Product Type
- Market Opportunity Assessment By End-users
- Market Opportunity Assessment By Distribution Channel
- Norway Kitchen and cleaning cloth Top Companies Market Share
- Norway Kitchen and cleaning cloth Competitive Benchmarking By Technical and Operational Parameters
- Norway Kitchen and cleaning cloth Company Profiles
- Norway Kitchen and cleaning cloth Key Strategic Recommendations
Frequently Asked Questions About the Market Study (FAQs):
6Wresearch actively monitors the Norway Kitchen and cleaning cloth Market and publishes its comprehensive annual report, highlighting emerging trends, growth drivers, revenue analysis, and forecast outlook. Our insights help businesses to make data-backed strategic decisions with ongoing market dynamics. Our analysts track relevent industries related to the Norway Kitchen and cleaning cloth Market, allowing our clients with actionable intelligence and reliable forecasts tailored to emerging regional needs.
Yes, we provide customisation as per your requirements. To learn more, feel free to contact us on sales@6wresearch.com
1 Executive Summary |
2 Introduction |
2.1 Key Highlights of the Report |
2.2 Report Description |
2.3 Market Scope & Segmentation |
2.4 Research Methodology |
2.5 Assumptions |
3 Norway Kitchen and cleaning cloth Market Overview |
3.1 Norway Country Macro Economic Indicators |
3.2 Norway Kitchen and cleaning cloth Market Revenues & Volume, 2022 & 2032F |
3.3 Norway Kitchen and cleaning cloth Market - Industry Life Cycle |
3.4 Norway Kitchen and cleaning cloth Market - Porter's Five Forces |
3.5 Norway Kitchen and cleaning cloth Market Revenues & Volume Share, By Product Type, 2022 & 2032F |
3.6 Norway Kitchen and cleaning cloth Market Revenues & Volume Share, By End-users, 2022 & 2032F |
3.7 Norway Kitchen and cleaning cloth Market Revenues & Volume Share, By Distribution Channel, 2022 & 2032F |
4 Norway Kitchen and cleaning cloth Market Dynamics |
4.1 Impact Analysis |
4.2 Market Drivers |
4.2.1 Increasing awareness about sustainable and eco-friendly products driving demand for kitchen and cleaning cloths in Norway. |
4.2.2 Growing emphasis on hygiene and cleanliness due to health concerns, leading to higher adoption of cleaning cloths. |
4.2.3 Rising disposable income and changing consumer lifestyles contributing to the demand for premium and innovative kitchen and cleaning cloth products. |
4.3 Market Restraints |
4.3.1 Intense competition in the market leading to price wars and margin pressures for kitchen and cleaning cloth manufacturers. |
4.3.2 Fluctuating raw material prices impacting the production cost and profitability of kitchen and cleaning cloth companies. |
4.3.3 Regulatory challenges related to environmental standards and certifications for sustainable production practices affecting market entry and operations. |
5 Norway Kitchen and cleaning cloth Market Trends |
6 Norway Kitchen and cleaning cloth Market Segmentations |
6.1 Norway Kitchen and cleaning cloth Market, By Product Type |
6.1.1 Overview and Analysis |
6.1.2 Norway Kitchen and cleaning cloth Market Revenues & Volume, By Sourcing Pads, Scrubbers, and Sponges, 2022 - 2032F |
6.1.3 Norway Kitchen and cleaning cloth Market Revenues & Volume, By Mops and Brooms, 2022 - 2032F |
6.1.4 Norway Kitchen and cleaning cloth Market Revenues & Volume, By Cleaning Brushes, 2022 - 2032F |
6.1.5 Norway Kitchen and cleaning cloth Market Revenues & Volume, By Wipes, 2022 - 2032F |
6.1.6 Norway Kitchen and cleaning cloth Market Revenues & Volume, By Gloves, 2022 - 2032F |
6.1.7 Norway Kitchen and cleaning cloth Market Revenues & Volume, By Others, 2022 - 2032F |
6.2 Norway Kitchen and cleaning cloth Market, By End-users |
6.2.1 Overview and Analysis |
6.2.2 Norway Kitchen and cleaning cloth Market Revenues & Volume, By Commercial, 2022 - 2032F |
6.2.3 Norway Kitchen and cleaning cloth Market Revenues & Volume, By Residential, 2022 - 2032F |
6.3 Norway Kitchen and cleaning cloth Market, By Distribution Channel |
6.3.1 Overview and Analysis |
6.3.2 Norway Kitchen and cleaning cloth Market Revenues & Volume, By Supermarkets and Hypermarkets, 2022 - 2032F |
6.3.3 Norway Kitchen and cleaning cloth Market Revenues & Volume, By Convenience Stores, 2022 - 2032F |
6.3.4 Norway Kitchen and cleaning cloth Market Revenues & Volume, By Specialty Stores, 2022 - 2032F |
6.3.5 Norway Kitchen and cleaning cloth Market Revenues & Volume, By Online Stores, 2022 - 2032F |
6.3.6 Norway Kitchen and cleaning cloth Market Revenues & Volume, By Others, 2022 - 2032F |
7 Norway Kitchen and cleaning cloth Market Import-Export Trade Statistics |
7.1 Norway Kitchen and cleaning cloth Market Export to Major Countries |
7.2 Norway Kitchen and cleaning cloth Market Imports from Major Countries |
8 Norway Kitchen and cleaning cloth Market Key Performance Indicators |
8.1 Customer satisfaction and retention rates to gauge the quality and effectiveness of kitchen and cleaning cloths in meeting consumer needs. |
8.2 Brand recognition and loyalty metrics to assess the market positioning and competitiveness of kitchen and cleaning cloth brands. |
8.3 Sustainability metrics such as carbon footprint reduction and waste management practices to evaluate the environmental impact of kitchen and cleaning cloth production. |
9 Norway Kitchen and cleaning cloth Market - Opportunity Assessment |
9.1 Norway Kitchen and cleaning cloth Market Opportunity Assessment, By Product Type, 2022 & 2032F |
9.2 Norway Kitchen and cleaning cloth Market Opportunity Assessment, By End-users, 2022 & 2032F |
9.3 Norway Kitchen and cleaning cloth Market Opportunity Assessment, By Distribution Channel, 2022 & 2032F |
10 Norway Kitchen and cleaning cloth Market - Competitive Landscape |
10.1 Norway Kitchen and cleaning cloth Market Revenue Share, By Companies, 2025 |
10.2 Norway Kitchen and cleaning cloth Market Competitive Benchmarking, By Operating and Technical Parameters |
11 Company Profiles |
12 Recommendations | 13 Disclaimer |
Export potential assessment - trade Analytics for 2030
Export potential enables firms to identify high-growth global markets with greater confidence by combining advanced trade intelligence with a structured quantitative methodology. The framework analyzes emerging demand trends and country-level import patterns while integrating macroeconomic and trade datasets such as GDP and population forecasts, bilateral import–export flows, tariff structures, elasticity differentials between developed and developing economies, geographic distance, and import demand projections. Using weighted trade values from 2020–2024 as the base period to project country-to-country export potential for 2030, these inputs are operationalized through calculated drivers such as gravity model parameters, tariff impact factors, and projected GDP per-capita growth. Through an analysis of hidden potentials, demand hotspots, and market conditions that are most favorable to success, this method enables firms to focus on target countries, maximize returns, and global expansion with data, backed by accuracy.
By factoring in the projected importer demand gap that is currently unmet and could be potential opportunity, it identifies the potential for the Exporter (Country) among 190 countries, against the general trade analysis, which identifies the biggest importer or exporter.
To discover high-growth global markets and optimize your business strategy:
Click Here
Pricing
- Single User License$ 1,995
- Department License$ 2,400
- Site License$ 3,120
- Global License$ 3,795

Search
Thought Leadership and Analyst Meet


Our Clients
Latest Reports
- Taiwan Food Delivery Platform Market (2026-2032) | Companies, Outlook, Analysis, Trends, Value, Revenue, Segmentation, Share, Forecast, Competitive Landscape, Growth, Size & Forecast
- United Kingdom (UK) Long-term Care Insurance Market (2026-2032) | Growth, Share, Consumer Insights, Drivers, Opportunities, Competition, Pricing Analysis, Segments, Restraints, Companies, Competitive, Value, Outlook, Size, Demand, Analysis, Challenges, Strategic Insights, Investment Trends, Revenue, Trends, Supply, Forecast
- United Kingdom (UK) Long Term Care Market (2026-2032) | Companies, Outlook, Analysis, Trends, Value, Revenue, Segmentation, Share, Forecast, Competitive Landscape, Growth, Size & Forecast
- Iraq Insulation and Waterproofing Market (2026-2032) | Outlook, Drivers, Growth, Size, Share, Industry, Revenue, Trends, Demand, Competitive, Strategic Insights, Opportunities, Segments, Companies, Challenges, Strategy, Consumer Insights, Analysis, Investment Trends, Value, Segmentation, Forecast, Restraints
- India Switchgear Market Outlook (2026-2032) | Size, Share, Trends, Growth, Revenue, Forecast, Analysis, Value, Outlook
- Pakistan Contraceptive Implants Market (2025-2031) | Demand, Growth, Size, Share, Industry, Pricing Analysis, Competitive, Strategic Insights, Strategy, Consumer Insights, Analysis, Investment Trends, Opportunities, Revenue, Segments, Value, Segmentation, Supply, Forecast, Restraints, Outlook, Competition, Drivers, Trends, Companies, Challenges
- Sri Lanka Packaging Market (2026-2032) | Outlook, Competition, Drivers, Trends, Demand, Pricing Analysis, Competitive, Strategic Insights, Companies, Challenges, Strategy, Consumer Insights, Analysis, Investment Trends, Opportunities, Growth, Size, Share, Industry, Revenue, Segments, Value, Segmentation, Supply, Forecast, Restraints
- India Kids Watches Market (2026-2032) | Strategy, Consumer Insights, Analysis, Investment Trends, Opportunities, Growth, Size, Share, Industry, Revenue, Segments, Value, Segmentation, Supply, Forecast, Restraints, Outlook, Competition, Drivers, Trends, Demand, Pricing Analysis, Competitive, Strategic Insights, Companies, Challenges
- Saudi Arabia Core Assurance Service Market (2025-2031) | Strategy, Consumer Insights, Analysis, Investment Trends, Opportunities, Growth, Size, Share, Industry, Revenue, Segments, Value, Segmentation, Supply, Forecast, Restraints, Outlook, Competition, Drivers, Trends, Demand, Pricing Analysis, Competitive, Strategic Insights, Companies, Challenges
- Romania Uninterruptible Power Supply (UPS) Market (2026-2032) | Industry, Analysis, Revenue, Size, Forecast, Outlook, Value, Trends, Share, Growth & Companies
Industry Events and Analyst Meet

India EV Show 2026

EV tech India Expo 2026

Auto Tech Asia 2026

Battery Tech India 2026

Smart Production Solutions Guangzhou 2026
Whitepaper
- Middle East & Africa Commercial Security Market Click here to view more.
- Middle East & Africa Fire Safety Systems & Equipment Market Click here to view more.
- GCC Drone Market Click here to view more.
- Middle East Lighting Fixture Market Click here to view more.
- GCC Physical & Perimeter Security Market Click here to view more.
6WResearch In News
- Doha a strategic location for EV manufacturing hub: IPA Qatar
- Demand for luxury TVs surging in the GCC, says Samsung
- Empowering Growth: The Thriving Journey of Bangladesh’s Cable Industry
- Demand for luxury TVs surging in the GCC, says Samsung
- Video call with a traditional healer? Once unthinkable, it’s now common in South Africa
- Intelligent Buildings To Smooth GCC’s Path To Net Zero