Norway Mica Market (2025-2031) | Analysis, Size, Forecast, Revenue, Industry, Share, Trends, Value, Companies, Growth, Outlook & Segmentation
Market Forecast By Type (Natural, Synthetic), By Grade (Ground Mica, Sheet Mica, Built-Up Mica), By End-user (Paints & Coatings, Electronics, Construction, Cosmetics, Others) And Competitive Landscape
| Product Code: ETC4815480 | Publication Date: Nov 2023 | Updated Date: Nov 2025 | Product Type: Market Research Report | |
| Publisher: 6Wresearch | Author: Sachin Kumar Rai | No. of Pages: 60 | No. of Figures: 30 | No. of Tables: 5 |
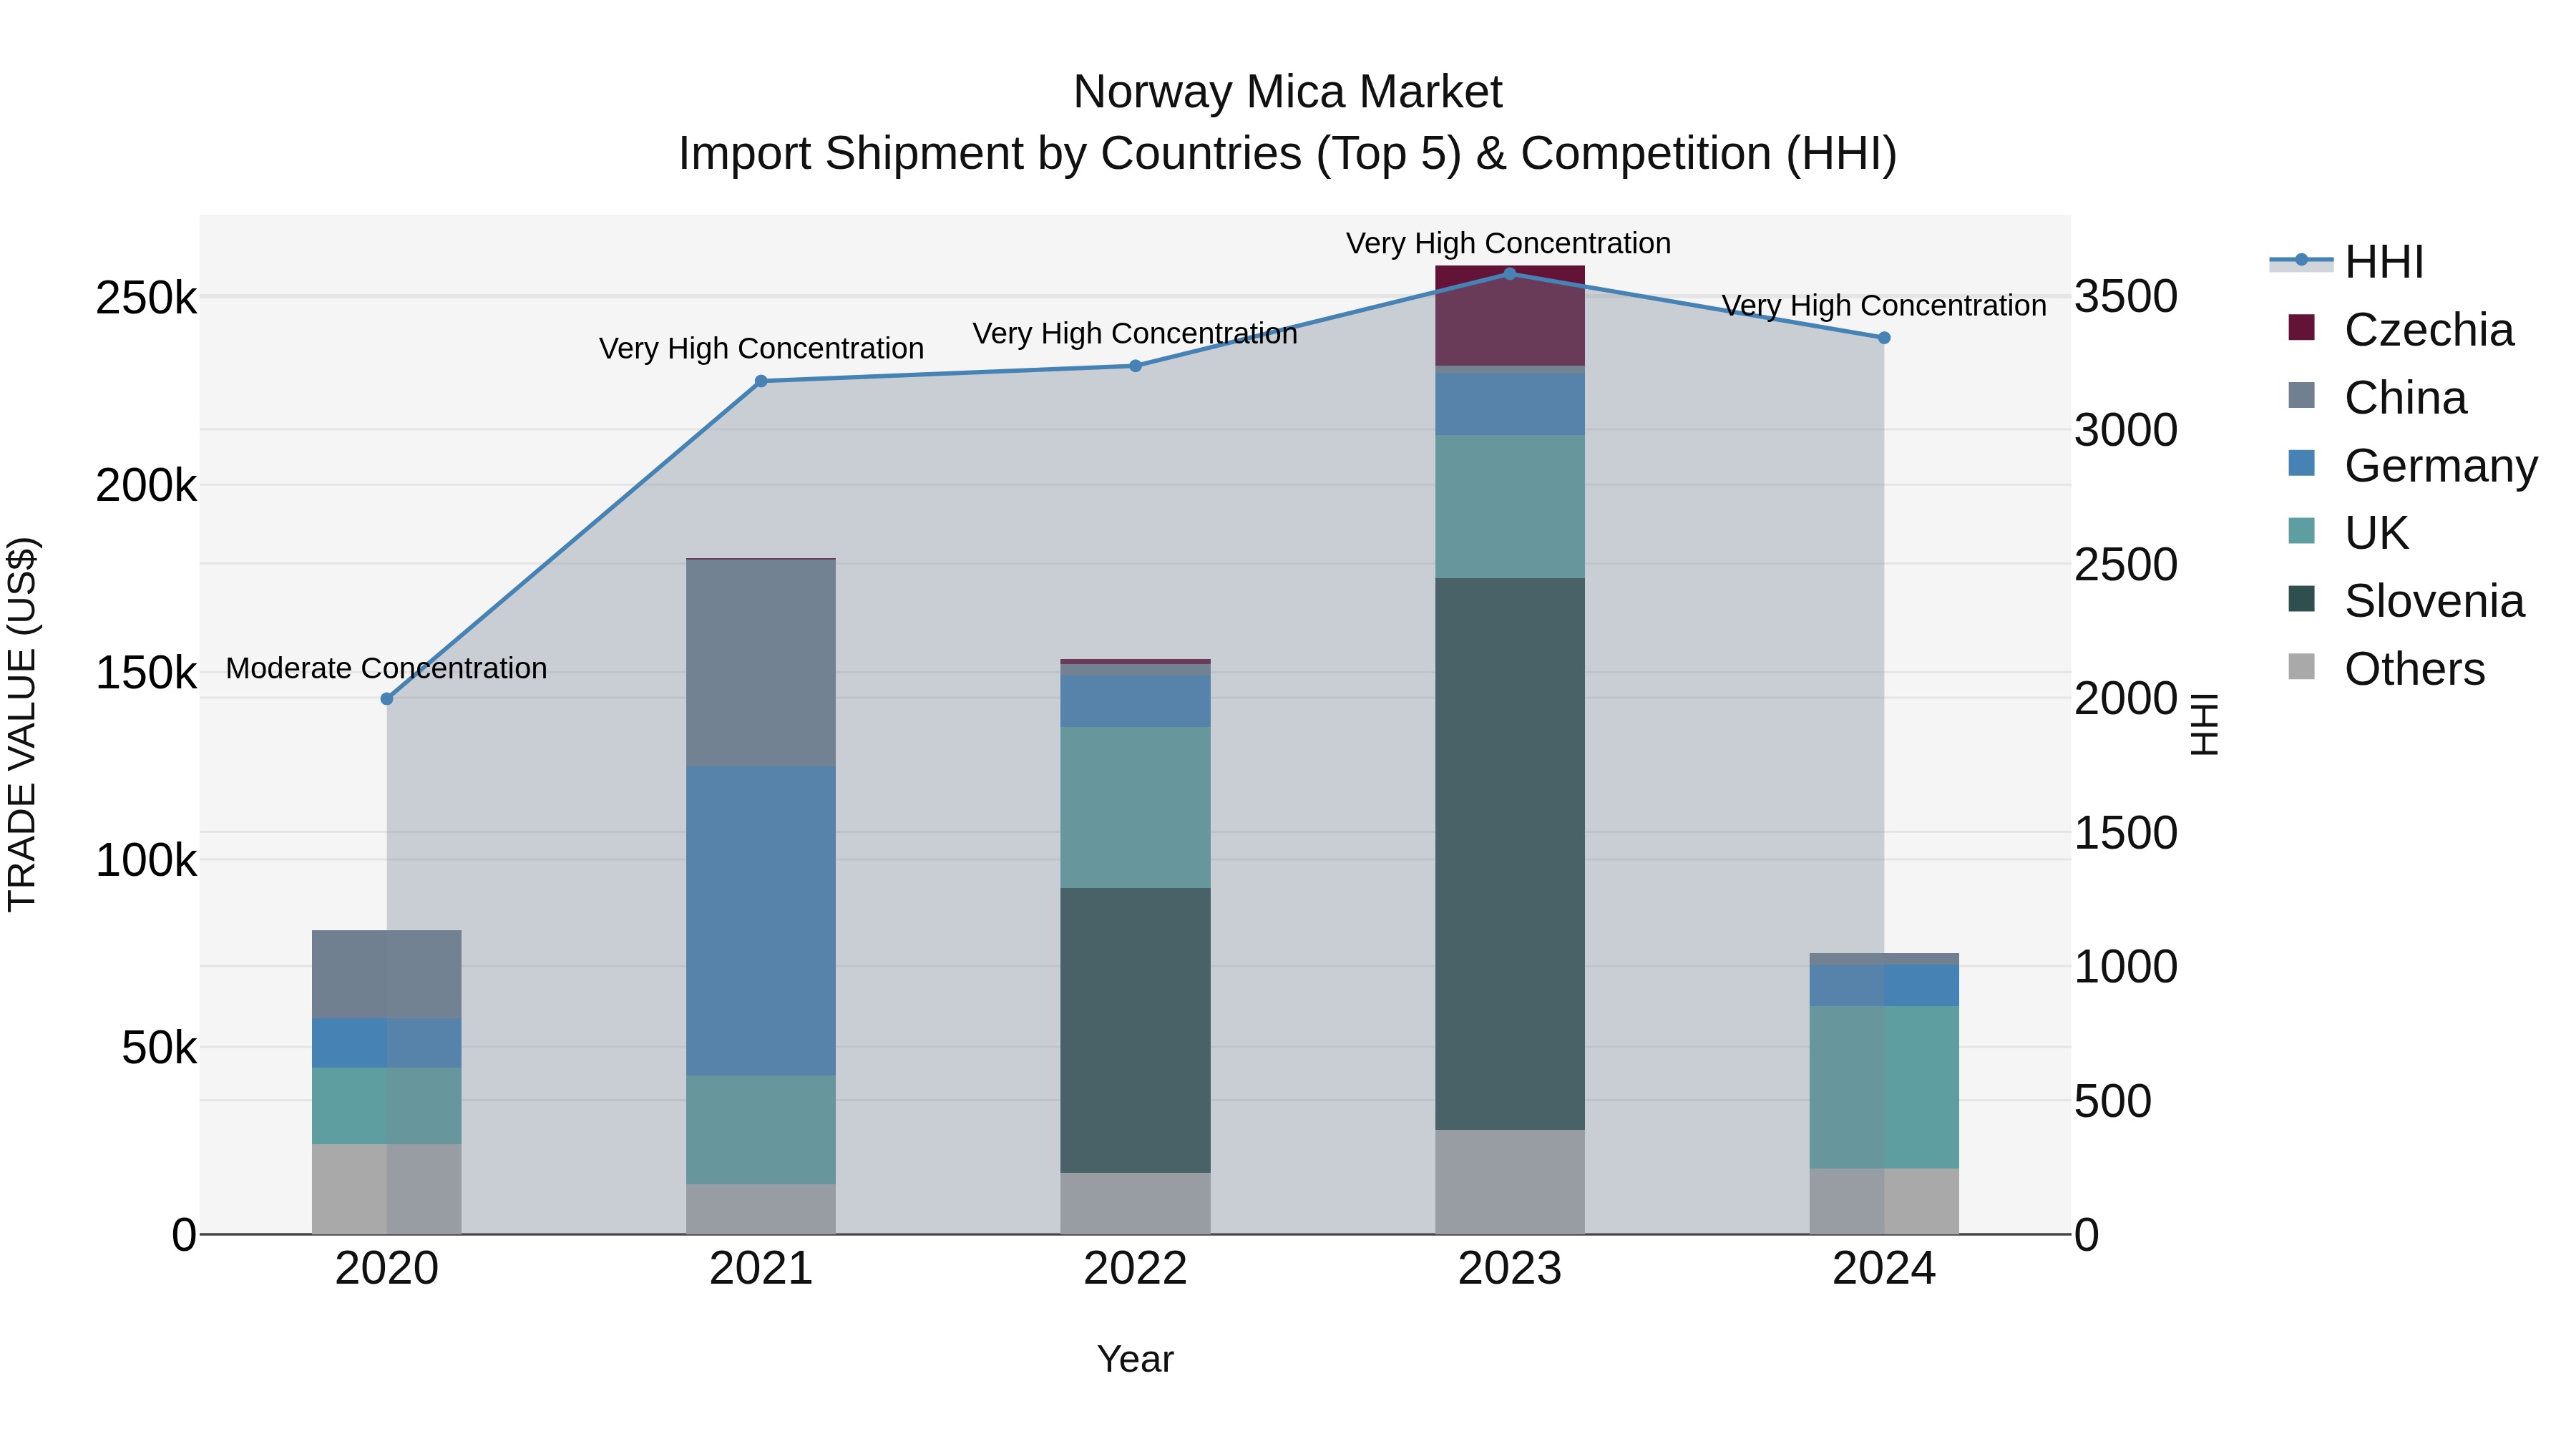
Norway Mica Market Top 5 Importing Countries and Market Competition (HHI) Analysis
Norway`s mica import shipments in 2024 continued to be dominated by top exporting countries such as the UK, Germany, Vietnam, Slovakia, and China. Despite a high concentration with a very high Herfindahl-Hirschman Index (HHI), the compound annual growth rate (CAGR) from 2020 to 2024 experienced a decline of -1.93%. Furthermore, the growth rate from 2023 to 2024 plummeted significantly by -70.94%, indicating a challenging year for mica imports in Norway. It will be important to closely monitor trends and dynamics in the mica market moving forward.
Norway Mica Market Overview
The mica market in Norway includes the extraction and use of mica, a group of silicate minerals known for their unique properties such as electrical insulation and heat resistance. Mica is widely used in industries like electronics, cosmetics, and construction. The market is driven by the growing demand for mica in these sectors, technological advancements in mica processing, and the search for high-quality and cost-effective mica products. Sustainability and ethical sourcing practices are becoming increasingly important in shaping market dynamics.
Drivers of the market
The Norway Mica market is influenced by its applications in electronics, construction, and cosmetics. Mica`s unique properties, such as thermal resistance and electrical insulation, make it valuable in various industries. The increasing demand for electronic devices and high-performance materials drives the market. Additionally, the growth of the construction and cosmetics sectors contributes to mica`s market growth.
Challenges of the market
The mica market in Norway faces challenges related to supply chain disruptions and environmental concerns. Mica mining can have significant environmental impacts, leading to regulatory scrutiny and increased costs for sustainable practices. Additionally, supply chain issues, including the ethical sourcing of mica, can affect the availability and cost of mica products.
Government Policy of the market
The mica market in Norway is regulated to ensure the safe extraction and use of mica. The government enforces standards for mining operations, including environmental impact assessments and worker safety protocols. Regulations also cover the quality and safety of mica products used in various industries, including cosmetics and electronics. Compliance with EU regulations is required to maintain high standards of safety and environmental protection.
Key Highlights of the Report:
- Norway Mica Market Outlook
- Market Size of Norway Mica Market, 2024
- Forecast of Norway Mica Market, 2031
- Historical Data and Forecast of Norway Mica Revenues & Volume for the Period 2021-2031
- Norway Mica Market Trend Evolution
- Norway Mica Market Drivers and Challenges
- Norway Mica Price Trends
- Norway Mica Porter`s Five Forces
- Norway Mica Industry Life Cycle
- Historical Data and Forecast of Norway Mica Market Revenues & Volume By Type for the Period 2021-2031
- Historical Data and Forecast of Norway Mica Market Revenues & Volume By Natural for the Period 2021-2031
- Historical Data and Forecast of Norway Mica Market Revenues & Volume By Synthetic for the Period 2021-2031
- Historical Data and Forecast of Norway Mica Market Revenues & Volume By Grade for the Period 2021-2031
- Historical Data and Forecast of Norway Mica Market Revenues & Volume By Ground Mica for the Period 2021-2031
- Historical Data and Forecast of Norway Mica Market Revenues & Volume By Sheet Mica for the Period 2021-2031
- Historical Data and Forecast of Norway Mica Market Revenues & Volume By Built-Up Mica for the Period 2021-2031
- Historical Data and Forecast of Norway Mica Market Revenues & Volume By End-user for the Period 2021-2031
- Historical Data and Forecast of Norway Mica Market Revenues & Volume By Paints & Coatings for the Period 2021-2031
- Historical Data and Forecast of Norway Mica Market Revenues & Volume By Electronics for the Period 2021-2031
- Historical Data and Forecast of Norway Mica Market Revenues & Volume By Construction for the Period 2021-2031
- Historical Data and Forecast of Norway Mica Market Revenues & Volume By Cosmetics for the Period 2021-2031
- Historical Data and Forecast of Norway Mica Market Revenues & Volume By Others for the Period 2021-2031
- Norway Mica Import Export Trade Statistics
- Market Opportunity Assessment By Type
- Market Opportunity Assessment By Grade
- Market Opportunity Assessment By End-user
- Norway Mica Top Companies Market Share
- Norway Mica Competitive Benchmarking By Technical and Operational Parameters
- Norway Mica Company Profiles
- Norway Mica Key Strategic Recommendations
Frequently Asked Questions About the Market Study (FAQs):
6Wresearch actively monitors the Norway Mica Market and publishes its comprehensive annual report, highlighting emerging trends, growth drivers, revenue analysis, and forecast outlook. Our insights help businesses to make data-backed strategic decisions with ongoing market dynamics. Our analysts track relevent industries related to the Norway Mica Market, allowing our clients with actionable intelligence and reliable forecasts tailored to emerging regional needs.
Yes, we provide customisation as per your requirements. To learn more, feel free to contact us on sales@6wresearch.com
1 Executive Summary |
2 Introduction |
2.1 Key Highlights of the Report |
2.2 Report Description |
2.3 Market Scope & Segmentation |
2.4 Research Methodology |
2.5 Assumptions |
3 Norway Mica Market Overview |
3.1 Norway Country Macro Economic Indicators |
3.2 Norway Mica Market Revenues & Volume, 2021 & 2031F |
3.3 Norway Mica Market - Industry Life Cycle |
3.4 Norway Mica Market - Porter's Five Forces |
3.5 Norway Mica Market Revenues & Volume Share, By Type, 2021 & 2031F |
3.6 Norway Mica Market Revenues & Volume Share, By Grade, 2021 & 2031F |
3.7 Norway Mica Market Revenues & Volume Share, By End-user, 2021 & 2031F |
4 Norway Mica Market Dynamics |
4.1 Impact Analysis |
4.2 Market Drivers |
4.2.1 Increasing demand for mica in the electronics industry for use in insulating materials and capacitors. |
4.2.2 Growing popularity of natural cosmetics and personal care products containing mica. |
4.2.3 Rising awareness about the benefits of mica in the construction and automotive sectors for heat resistance and durability. |
4.3 Market Restraints |
4.3.1 Fluctuating prices of raw materials impacting the overall production cost. |
4.3.2 Environmental concerns related to mica mining practices leading to regulatory challenges. |
4.3.3 Competition from synthetic alternatives impacting the market share of natural mica products. |
5 Norway Mica Market Trends |
6 Norway Mica Market Segmentations |
6.1 Norway Mica Market, By Type |
6.1.1 Overview and Analysis |
6.1.2 Norway Mica Market Revenues & Volume, By Natural, 2021-2031F |
6.1.3 Norway Mica Market Revenues & Volume, By Synthetic, 2021-2031F |
6.2 Norway Mica Market, By Grade |
6.2.1 Overview and Analysis |
6.2.2 Norway Mica Market Revenues & Volume, By Ground Mica, 2021-2031F |
6.2.3 Norway Mica Market Revenues & Volume, By Sheet Mica, 2021-2031F |
6.2.4 Norway Mica Market Revenues & Volume, By Built-Up Mica, 2021-2031F |
6.3 Norway Mica Market, By End-user |
6.3.1 Overview and Analysis |
6.3.2 Norway Mica Market Revenues & Volume, By Paints & Coatings, 2021-2031F |
6.3.3 Norway Mica Market Revenues & Volume, By Electronics, 2021-2031F |
6.3.4 Norway Mica Market Revenues & Volume, By Construction, 2021-2031F |
6.3.5 Norway Mica Market Revenues & Volume, By Cosmetics, 2021-2031F |
6.3.6 Norway Mica Market Revenues & Volume, By Others, 2021-2031F |
7 Norway Mica Market Import-Export Trade Statistics |
7.1 Norway Mica Market Export to Major Countries |
7.2 Norway Mica Market Imports from Major Countries |
8 Norway Mica Market Key Performance Indicators |
8.1 Average selling price of mica products in Norway. |
8.2 Percentage of mica sourced sustainably from ethical mining practices. |
8.3 Number of new product launches incorporating mica in diverse industries. |
9 Norway Mica Market - Opportunity Assessment |
9.1 Norway Mica Market Opportunity Assessment, By Type, 2021 & 2031F |
9.2 Norway Mica Market Opportunity Assessment, By Grade, 2021 & 2031F |
9.3 Norway Mica Market Opportunity Assessment, By End-user, 2021 & 2031F |
10 Norway Mica Market - Competitive Landscape |
10.1 Norway Mica Market Revenue Share, By Companies, 2024 |
10.2 Norway Mica Market Competitive Benchmarking, By Operating and Technical Parameters |
11 Company Profiles |
12 Recommendations | 13 Disclaimer |
Export potential assessment - trade Analytics for 2030
Export potential enables firms to identify high-growth global markets with greater confidence by combining advanced trade intelligence with a structured quantitative methodology. The framework analyzes emerging demand trends and country-level import patterns while integrating macroeconomic and trade datasets such as GDP and population forecasts, bilateral import–export flows, tariff structures, elasticity differentials between developed and developing economies, geographic distance, and import demand projections. Using weighted trade values from 2020–2024 as the base period to project country-to-country export potential for 2030, these inputs are operationalized through calculated drivers such as gravity model parameters, tariff impact factors, and projected GDP per-capita growth. Through an analysis of hidden potentials, demand hotspots, and market conditions that are most favorable to success, this method enables firms to focus on target countries, maximize returns, and global expansion with data, backed by accuracy.
By factoring in the projected importer demand gap that is currently unmet and could be potential opportunity, it identifies the potential for the Exporter (Country) among 190 countries, against the general trade analysis, which identifies the biggest importer or exporter.
To discover high-growth global markets and optimize your business strategy:
Click Here
Pricing
- Single User License$ 1,995
- Department License$ 2,400
- Site License$ 3,120
- Global License$ 3,795

Search
Thought Leadership and Analyst Meet


Our Clients
Latest Reports
- Canada Cloud CFD Market (2026-2032) | Size & Revenue, Industry, Growth, Competitive Landscape, Forecast, Segmentation, Value, Outlook, Trends, Share, Analysis, Companies
- Taiwan Food Delivery Platform Market (2026-2032) | Companies, Outlook, Analysis, Trends, Value, Revenue, Segmentation, Share, Forecast, Competitive Landscape, Growth, Size & Forecast
- United Kingdom (UK) Long-term Care Insurance Market (2026-2032) | Growth, Share, Consumer Insights, Drivers, Opportunities, Competition, Pricing Analysis, Segments, Restraints, Companies, Competitive, Value, Outlook, Size, Demand, Analysis, Challenges, Strategic Insights, Investment Trends, Revenue, Trends, Supply, Forecast
- United Kingdom (UK) Long Term Care Market (2026-2032) | Companies, Outlook, Analysis, Trends, Value, Revenue, Segmentation, Share, Forecast, Competitive Landscape, Growth, Size & Forecast
- Iraq Insulation and Waterproofing Market (2026-2032) | Outlook, Drivers, Growth, Size, Share, Industry, Revenue, Trends, Demand, Competitive, Strategic Insights, Opportunities, Segments, Companies, Challenges, Strategy, Consumer Insights, Analysis, Investment Trends, Value, Segmentation, Forecast, Restraints
- India Switchgear Market Outlook (2026-2032) | Size, Share, Trends, Growth, Revenue, Forecast, Analysis, Value, Outlook
- Pakistan Contraceptive Implants Market (2025-2031) | Demand, Growth, Size, Share, Industry, Pricing Analysis, Competitive, Strategic Insights, Strategy, Consumer Insights, Analysis, Investment Trends, Opportunities, Revenue, Segments, Value, Segmentation, Supply, Forecast, Restraints, Outlook, Competition, Drivers, Trends, Companies, Challenges
- Sri Lanka Packaging Market (2026-2032) | Outlook, Competition, Drivers, Trends, Demand, Pricing Analysis, Competitive, Strategic Insights, Companies, Challenges, Strategy, Consumer Insights, Analysis, Investment Trends, Opportunities, Growth, Size, Share, Industry, Revenue, Segments, Value, Segmentation, Supply, Forecast, Restraints
- India Kids Watches Market (2026-2032) | Strategy, Consumer Insights, Analysis, Investment Trends, Opportunities, Growth, Size, Share, Industry, Revenue, Segments, Value, Segmentation, Supply, Forecast, Restraints, Outlook, Competition, Drivers, Trends, Demand, Pricing Analysis, Competitive, Strategic Insights, Companies, Challenges
- Saudi Arabia Core Assurance Service Market (2025-2031) | Strategy, Consumer Insights, Analysis, Investment Trends, Opportunities, Growth, Size, Share, Industry, Revenue, Segments, Value, Segmentation, Supply, Forecast, Restraints, Outlook, Competition, Drivers, Trends, Demand, Pricing Analysis, Competitive, Strategic Insights, Companies, Challenges
Industry Events and Analyst Meet

India EV Show 2026

EV tech India Expo 2026

Auto Tech Asia 2026

Battery Tech India 2026

Smart Production Solutions Guangzhou 2026
Whitepaper
- Middle East & Africa Commercial Security Market Click here to view more.
- Middle East & Africa Fire Safety Systems & Equipment Market Click here to view more.
- GCC Drone Market Click here to view more.
- Middle East Lighting Fixture Market Click here to view more.
- GCC Physical & Perimeter Security Market Click here to view more.
6WResearch In News
- Doha a strategic location for EV manufacturing hub: IPA Qatar
- Demand for luxury TVs surging in the GCC, says Samsung
- Empowering Growth: The Thriving Journey of Bangladesh’s Cable Industry
- Demand for luxury TVs surging in the GCC, says Samsung
- Video call with a traditional healer? Once unthinkable, it’s now common in South Africa
- Intelligent Buildings To Smooth GCC’s Path To Net Zero