Norway Nutrition Bars Market (2025-2031) | Value, Segmentation, Competitive Landscape, Growth, Outlook, Forecast, Industry, Analysis, Share, Companies, Size & Revenue, Trends
Market Forecast By Product Type (Energy Bars, Protein-rich Bars, Meal Replacement Bars, Low Carbohydrate Bars), By Format (Extruded, Co-extruded, Double Layer, Multilayer), By Function (Weight Management, Sports & Fitness, Functional Food, Diabetes, Others), By Packaging (Wrappers, Clear Wrappers, Boxes, Others), By Nature (Organic, Conventional), By Sales Channel (Institutional Sales, Modern Retail, Specialty Stores, Departmental Stores, Online Retail, Others) And Competitive Landscape
| Product Code: ETC8673936 | Publication Date: Sep 2024 | Updated Date: Nov 2025 | Product Type: Market Research Report | |
| Publisher: 6Wresearch | Author: Shubham Padhi | No. of Pages: 75 | No. of Figures: 35 | No. of Tables: 20 |
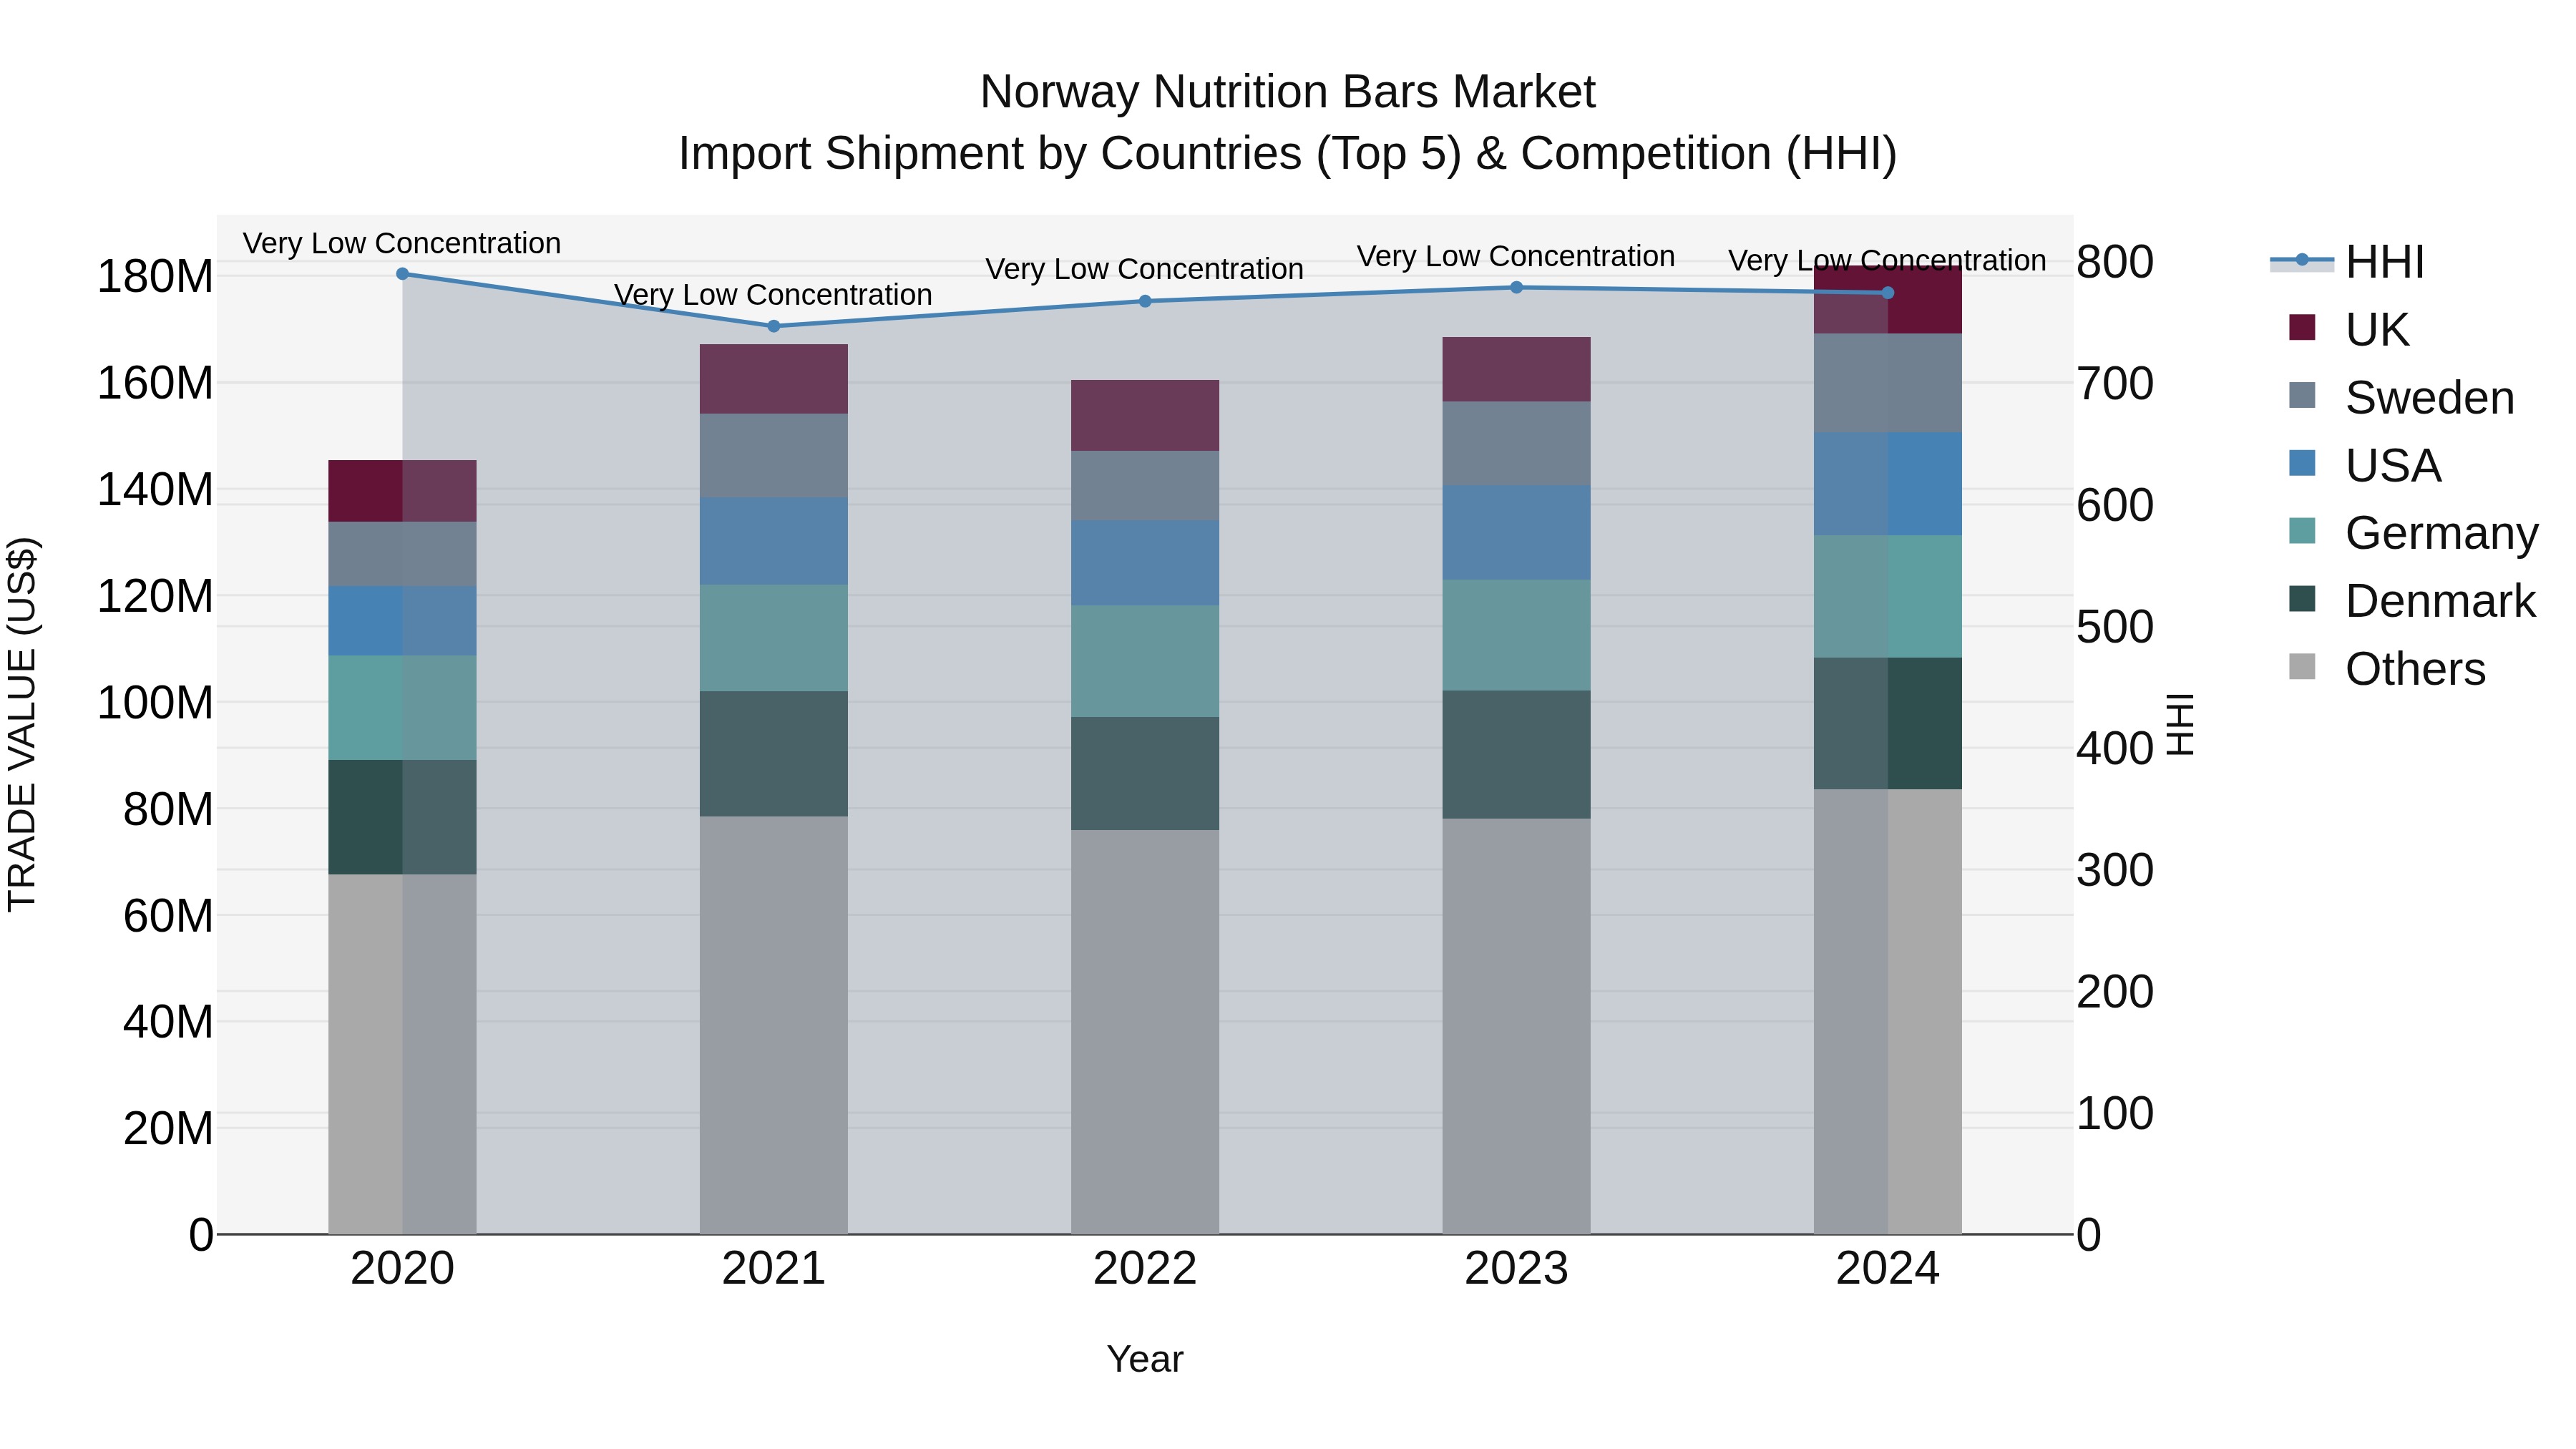
Norway Nutrition Bars Market Top 5 Importing Countries and Market Competition (HHI) Analysis
Norway continues to see an increasing trend in the import of nutrition bars, with key exporting countries including Denmark, Germany, USA, Sweden, and the UK. The market shows a healthy Compound Annual Growth Rate (CAGR) of 5.76% from 2020 to 2024, with a notable growth rate of 7.94% in 2023-24. Despite the growth, the market remains competitive and diversified, as indicated by the low concentration levels measured by the Herfindahl-Hirschman Index (HHI) in 2024. This data suggests a promising outlook for the nutrition bars market in Norway.
Key Highlights of the Report:
- Norway Nutrition Bars Market Outlook
- Market Size of Norway Nutrition Bars Market, 2024
- Forecast of Norway Nutrition Bars Market, 2031
- Historical Data and Forecast of Norway Nutrition Bars Revenues & Volume for the Period 2021- 2031
- Norway Nutrition Bars Market Trend Evolution
- Norway Nutrition Bars Market Drivers and Challenges
- Norway Nutrition Bars Price Trends
- Norway Nutrition Bars Porter's Five Forces
- Norway Nutrition Bars Industry Life Cycle
- Historical Data and Forecast of Norway Nutrition Bars Market Revenues & Volume By Product Type for the Period 2021- 2031
- Historical Data and Forecast of Norway Nutrition Bars Market Revenues & Volume By Energy Bars for the Period 2021- 2031
- Historical Data and Forecast of Norway Nutrition Bars Market Revenues & Volume By Protein-rich Bars for the Period 2021- 2031
- Historical Data and Forecast of Norway Nutrition Bars Market Revenues & Volume By Meal Replacement Bars for the Period 2021- 2031
- Historical Data and Forecast of Norway Nutrition Bars Market Revenues & Volume By Low Carbohydrate Bars for the Period 2021- 2031
- Historical Data and Forecast of Norway Nutrition Bars Market Revenues & Volume By Format for the Period 2021- 2031
- Historical Data and Forecast of Norway Nutrition Bars Market Revenues & Volume By Extruded for the Period 2021- 2031
- Historical Data and Forecast of Norway Nutrition Bars Market Revenues & Volume By Co-extruded for the Period 2021- 2031
- Historical Data and Forecast of Norway Nutrition Bars Market Revenues & Volume By Double Layer for the Period 2021- 2031
- Historical Data and Forecast of Norway Nutrition Bars Market Revenues & Volume By Multilayer for the Period 2021- 2031
- Historical Data and Forecast of Norway Nutrition Bars Market Revenues & Volume By Function for the Period 2021- 2031
- Historical Data and Forecast of Norway Nutrition Bars Market Revenues & Volume By Weight Management for the Period 2021- 2031
- Historical Data and Forecast of Norway Nutrition Bars Market Revenues & Volume By Sports & Fitness for the Period 2021- 2031
- Historical Data and Forecast of Norway Nutrition Bars Market Revenues & Volume By Functional Food for the Period 2021- 2031
- Historical Data and Forecast of Norway Nutrition Bars Market Revenues & Volume By Diabetes for the Period 2021- 2031
- Historical Data and Forecast of Norway Nutrition Bars Market Revenues & Volume By Others for the Period 2021- 2031
- Historical Data and Forecast of Norway Nutrition Bars Market Revenues & Volume By Packaging for the Period 2021- 2031
- Historical Data and Forecast of Norway Nutrition Bars Market Revenues & Volume By Wrappers for the Period 2021- 2031
- Historical Data and Forecast of Norway Nutrition Bars Market Revenues & Volume By Clear Wrappers for the Period 2021- 2031
- Historical Data and Forecast of Norway Nutrition Bars Market Revenues & Volume By Boxes for the Period 2021- 2031
- Historical Data and Forecast of Norway Nutrition Bars Market Revenues & Volume By Others for the Period 2021- 2031
- Historical Data and Forecast of Norway Nutrition Bars Market Revenues & Volume By Nature for the Period 2021- 2031
- Historical Data and Forecast of Norway Nutrition Bars Market Revenues & Volume By Organic for the Period 2021- 2031
- Historical Data and Forecast of Norway Nutrition Bars Market Revenues & Volume By Conventional for the Period 2021- 2031
- Historical Data and Forecast of Norway Nutrition Bars Market Revenues & Volume By Sales Channel for the Period 2021- 2031
- Historical Data and Forecast of Norway Nutrition Bars Market Revenues & Volume By Institutional Sales for the Period 2021- 2031
- Historical Data and Forecast of Norway Nutrition Bars Market Revenues & Volume By Modern Retail for the Period 2021- 2031
- Historical Data and Forecast of Norway Nutrition Bars Market Revenues & Volume By Specialty Stores for the Period 2021- 2031
- Historical Data and Forecast of Norway Nutrition Bars Market Revenues & Volume By Departmental Stores for the Period 2021- 2031
- Historical Data and Forecast of Norway Nutrition Bars Market Revenues & Volume By Online Retail for the Period 2021- 2031
- Historical Data and Forecast of Norway Nutrition Bars Market Revenues & Volume By Others for the Period 2021- 2031
- Norway Nutrition Bars Import Export Trade Statistics
- Market Opportunity Assessment By Product Type
- Market Opportunity Assessment By Format
- Market Opportunity Assessment By Function
- Market Opportunity Assessment By Packaging
- Market Opportunity Assessment By Nature
- Market Opportunity Assessment By Sales Channel
- Norway Nutrition Bars Top Companies Market Share
- Norway Nutrition Bars Competitive Benchmarking By Technical and Operational Parameters
- Norway Nutrition Bars Company Profiles
- Norway Nutrition Bars Key Strategic Recommendations
Frequently Asked Questions About the Market Study (FAQs):
6Wresearch actively monitors the Norway Nutrition Bars Market and publishes its comprehensive annual report, highlighting emerging trends, growth drivers, revenue analysis, and forecast outlook. Our insights help businesses to make data-backed strategic decisions with ongoing market dynamics. Our analysts track relevent industries related to the Norway Nutrition Bars Market, allowing our clients with actionable intelligence and reliable forecasts tailored to emerging regional needs.
Yes, we provide customisation as per your requirements. To learn more, feel free to contact us on sales@6wresearch.com
1 Executive Summary |
2 Introduction |
2.1 Key Highlights of the Report |
2.2 Report Description |
2.3 Market Scope & Segmentation |
2.4 Research Methodology |
2.5 Assumptions |
3 Norway Nutrition Bars Market Overview |
3.1 Norway Country Macro Economic Indicators |
3.2 Norway Nutrition Bars Market Revenues & Volume, 2021 & 2031F |
3.3 Norway Nutrition Bars Market - Industry Life Cycle |
3.4 Norway Nutrition Bars Market - Porter's Five Forces |
3.5 Norway Nutrition Bars Market Revenues & Volume Share, By Product Type, 2021 & 2031F |
3.6 Norway Nutrition Bars Market Revenues & Volume Share, By Format, 2021 & 2031F |
3.7 Norway Nutrition Bars Market Revenues & Volume Share, By Function, 2021 & 2031F |
3.8 Norway Nutrition Bars Market Revenues & Volume Share, By Packaging, 2021 & 2031F |
3.9 Norway Nutrition Bars Market Revenues & Volume Share, By Nature, 2021 & 2031F |
3.10 Norway Nutrition Bars Market Revenues & Volume Share, By Sales Channel, 2021 & 2031F |
4 Norway Nutrition Bars Market Dynamics |
4.1 Impact Analysis |
4.2 Market Drivers |
4.2.1 Increasing health consciousness and awareness among consumers leading to a demand for healthier snack options like nutrition bars. |
4.2.2 Busy lifestyles and on-the-go consumption habits driving the need for convenient and portable food options like nutrition bars. |
4.2.3 Growing preference for natural and organic ingredients in food products, boosting the demand for nutrition bars made with clean labels. |
4.3 Market Restraints |
4.3.1 High competition in the nutrition bars market leading to price wars and margin pressures for manufacturers. |
4.3.2 Fluctuating raw material prices impacting production costs of nutrition bars. |
4.3.3 Regulatory challenges and compliance requirements in the food industry affecting product innovation and marketing strategies for nutrition bars. |
5 Norway Nutrition Bars Market Trends |
6 Norway Nutrition Bars Market, By Types |
6.1 Norway Nutrition Bars Market, By Product Type |
6.1.1 Overview and Analysis |
6.1.2 Norway Nutrition Bars Market Revenues & Volume, By Product Type, 2021- 2031F |
6.1.3 Norway Nutrition Bars Market Revenues & Volume, By Energy Bars, 2021- 2031F |
6.1.4 Norway Nutrition Bars Market Revenues & Volume, By Protein-rich Bars, 2021- 2031F |
6.1.5 Norway Nutrition Bars Market Revenues & Volume, By Meal Replacement Bars, 2021- 2031F |
6.1.6 Norway Nutrition Bars Market Revenues & Volume, By Low Carbohydrate Bars, 2021- 2031F |
6.2 Norway Nutrition Bars Market, By Format |
6.2.1 Overview and Analysis |
6.2.2 Norway Nutrition Bars Market Revenues & Volume, By Extruded, 2021- 2031F |
6.2.3 Norway Nutrition Bars Market Revenues & Volume, By Co-extruded, 2021- 2031F |
6.2.4 Norway Nutrition Bars Market Revenues & Volume, By Double Layer, 2021- 2031F |
6.2.5 Norway Nutrition Bars Market Revenues & Volume, By Multilayer, 2021- 2031F |
6.3 Norway Nutrition Bars Market, By Function |
6.3.1 Overview and Analysis |
6.3.2 Norway Nutrition Bars Market Revenues & Volume, By Weight Management, 2021- 2031F |
6.3.3 Norway Nutrition Bars Market Revenues & Volume, By Sports & Fitness, 2021- 2031F |
6.3.4 Norway Nutrition Bars Market Revenues & Volume, By Functional Food, 2021- 2031F |
6.3.5 Norway Nutrition Bars Market Revenues & Volume, By Diabetes, 2021- 2031F |
6.3.6 Norway Nutrition Bars Market Revenues & Volume, By Others, 2021- 2031F |
6.4 Norway Nutrition Bars Market, By Packaging |
6.4.1 Overview and Analysis |
6.4.2 Norway Nutrition Bars Market Revenues & Volume, By Wrappers, 2021- 2031F |
6.4.3 Norway Nutrition Bars Market Revenues & Volume, By Clear Wrappers, 2021- 2031F |
6.4.4 Norway Nutrition Bars Market Revenues & Volume, By Boxes, 2021- 2031F |
6.4.5 Norway Nutrition Bars Market Revenues & Volume, By Others, 2021- 2031F |
6.5 Norway Nutrition Bars Market, By Nature |
6.5.1 Overview and Analysis |
6.5.2 Norway Nutrition Bars Market Revenues & Volume, By Organic, 2021- 2031F |
6.5.3 Norway Nutrition Bars Market Revenues & Volume, By Conventional, 2021- 2031F |
6.6 Norway Nutrition Bars Market, By Sales Channel |
6.6.1 Overview and Analysis |
6.6.2 Norway Nutrition Bars Market Revenues & Volume, By Institutional Sales, 2021- 2031F |
6.6.3 Norway Nutrition Bars Market Revenues & Volume, By Modern Retail, 2021- 2031F |
6.6.4 Norway Nutrition Bars Market Revenues & Volume, By Specialty Stores, 2021- 2031F |
6.6.5 Norway Nutrition Bars Market Revenues & Volume, By Departmental Stores, 2021- 2031F |
6.6.6 Norway Nutrition Bars Market Revenues & Volume, By Online Retail, 2021- 2031F |
6.6.7 Norway Nutrition Bars Market Revenues & Volume, By Others, 2021- 2031F |
7 Norway Nutrition Bars Market Import-Export Trade Statistics |
7.1 Norway Nutrition Bars Market Export to Major Countries |
7.2 Norway Nutrition Bars Market Imports from Major Countries |
8 Norway Nutrition Bars Market Key Performance Indicators |
8.1 Consumer engagement metrics such as website traffic, social media interactions, and customer reviews to gauge brand awareness and loyalty. |
8.2 Nutritional value and ingredient transparency ratings to assess the perceived healthiness and quality of nutrition bars. |
8.3 Sustainability practices and certifications like Fair Trade or organic labeling to measure the market's responsiveness to eco-friendly and ethical considerations in nutrition bar production. |
9 Norway Nutrition Bars Market - Opportunity Assessment |
9.1 Norway Nutrition Bars Market Opportunity Assessment, By Product Type, 2021 & 2031F |
9.2 Norway Nutrition Bars Market Opportunity Assessment, By Format, 2021 & 2031F |
9.3 Norway Nutrition Bars Market Opportunity Assessment, By Function, 2021 & 2031F |
9.4 Norway Nutrition Bars Market Opportunity Assessment, By Packaging, 2021 & 2031F |
9.5 Norway Nutrition Bars Market Opportunity Assessment, By Nature, 2021 & 2031F |
9.6 Norway Nutrition Bars Market Opportunity Assessment, By Sales Channel, 2021 & 2031F |
10 Norway Nutrition Bars Market - Competitive Landscape |
10.1 Norway Nutrition Bars Market Revenue Share, By Companies, 2024 |
10.2 Norway Nutrition Bars Market Competitive Benchmarking, By Operating and Technical Parameters |
11 Company Profiles |
12 Recommendations |
13 Disclaimer |
Export potential assessment - trade Analytics for 2030
Export potential enables firms to identify high-growth global markets with greater confidence by combining advanced trade intelligence with a structured quantitative methodology. The framework analyzes emerging demand trends and country-level import patterns while integrating macroeconomic and trade datasets such as GDP and population forecasts, bilateral import–export flows, tariff structures, elasticity differentials between developed and developing economies, geographic distance, and import demand projections. Using weighted trade values from 2020–2024 as the base period to project country-to-country export potential for 2030, these inputs are operationalized through calculated drivers such as gravity model parameters, tariff impact factors, and projected GDP per-capita growth. Through an analysis of hidden potentials, demand hotspots, and market conditions that are most favorable to success, this method enables firms to focus on target countries, maximize returns, and global expansion with data, backed by accuracy.
By factoring in the projected importer demand gap that is currently unmet and could be potential opportunity, it identifies the potential for the Exporter (Country) among 190 countries, against the general trade analysis, which identifies the biggest importer or exporter.
To discover high-growth global markets and optimize your business strategy:
Click Here
Pricing
- Single User License$ 1,995
- Department License$ 2,400
- Site License$ 3,120
- Global License$ 3,795

Search
Thought Leadership and Analyst Meet


Our Clients
Latest Reports
- United Kingdom (UK) Long-term Care Insurance Market (2026-2032) | Growth, Share, Consumer Insights, Drivers, Opportunities, Competition, Pricing Analysis, Segments, Restraints, Companies, Competitive, Value, Outlook, Size, Demand, Analysis, Challenges, Strategic Insights, Investment Trends, Revenue, Trends, Supply, Forecast
- United Kingdom (UK) Long Term Care Market (2026-2032) | Companies, Outlook, Analysis, Trends, Value, Revenue, Segmentation, Share, Forecast, Competitive Landscape, Growth, Size & Forecast
- Iraq Insulation and Waterproofing Market (2026-2032) | Outlook, Drivers, Growth, Size, Share, Industry, Revenue, Trends, Demand, Competitive, Strategic Insights, Opportunities, Segments, Companies, Challenges, Strategy, Consumer Insights, Analysis, Investment Trends, Value, Segmentation, Forecast, Restraints
- India Switchgear Market Outlook (2026 - 2032) | Size, Share, Trends, Growth, Revenue, Forecast, Analysis, Value, Outlook
- Pakistan Contraceptive Implants Market (2025-2031) | Demand, Growth, Size, Share, Industry, Pricing Analysis, Competitive, Strategic Insights, Strategy, Consumer Insights, Analysis, Investment Trends, Opportunities, Revenue, Segments, Value, Segmentation, Supply, Forecast, Restraints, Outlook, Competition, Drivers, Trends, Companies, Challenges
- Sri Lanka Packaging Market (2026-2032) | Outlook, Competition, Drivers, Trends, Demand, Pricing Analysis, Competitive, Strategic Insights, Companies, Challenges, Strategy, Consumer Insights, Analysis, Investment Trends, Opportunities, Growth, Size, Share, Industry, Revenue, Segments, Value, Segmentation, Supply, Forecast, Restraints
- India Kids Watches Market (2026-2032) | Strategy, Consumer Insights, Analysis, Investment Trends, Opportunities, Growth, Size, Share, Industry, Revenue, Segments, Value, Segmentation, Supply, Forecast, Restraints, Outlook, Competition, Drivers, Trends, Demand, Pricing Analysis, Competitive, Strategic Insights, Companies, Challenges
- Saudi Arabia Core Assurance Service Market (2025-2031) | Strategy, Consumer Insights, Analysis, Investment Trends, Opportunities, Growth, Size, Share, Industry, Revenue, Segments, Value, Segmentation, Supply, Forecast, Restraints, Outlook, Competition, Drivers, Trends, Demand, Pricing Analysis, Competitive, Strategic Insights, Companies, Challenges
- Romania Uninterruptible Power Supply (UPS) Market (2026-2032) | Industry, Analysis, Revenue, Size, Forecast, Outlook, Value, Trends, Share, Growth & Companies
- Saudi Arabia Car Window Tinting Film, Paint Protection Film (PPF), and Ceramic Coating Market (2025-2031) | Strategy, Consumer Insights, Analysis, Investment Trends, Opportunities, Growth, Size, Share, Industry, Revenue, Segments, Value, Segmentation, Supply, Forecast, Restraints, Outlook, Competition, Drivers, Trends, Demand, Pricing Analysis, Competitive, Strategic Insights, Companies, Challenges
Industry Events and Analyst Meet

India EV Show 2026

EV tech India Expo 2026

Auto Tech Asia 2026

Battery Tech India 2026

Smart Production Solutions Guangzhou 2026
Whitepaper
- Middle East & Africa Commercial Security Market Click here to view more.
- Middle East & Africa Fire Safety Systems & Equipment Market Click here to view more.
- GCC Drone Market Click here to view more.
- Middle East Lighting Fixture Market Click here to view more.
- GCC Physical & Perimeter Security Market Click here to view more.
6WResearch In News
- Doha a strategic location for EV manufacturing hub: IPA Qatar
- Demand for luxury TVs surging in the GCC, says Samsung
- Empowering Growth: The Thriving Journey of Bangladesh’s Cable Industry
- Demand for luxury TVs surging in the GCC, says Samsung
- Video call with a traditional healer? Once unthinkable, it’s now common in South Africa
- Intelligent Buildings To Smooth GCC’s Path To Net Zero