Norway Power Quality Equipment Market (2025-2031) | Forecast, Segmentation, Share, Industry, Value, Companies, Trends, Size, Revenue, Analysis, Outlook & Growth
Market Forecast By Equipment (UPS, Harmonic Filters, Surge Protection Devices, Voltage Regulators, Static VAR compensators, Power Quality Meters), By Phase (Single , Three Phase) And Competitive Landscape
| Product Code: ETC5762687 | Publication Date: Nov 2023 | Updated Date: Nov 2025 | Product Type: Market Research Report | |
| Publisher: 6Wresearch | Author: Sumit Sagar | No. of Pages: 60 | No. of Figures: 30 | No. of Tables: 5 |
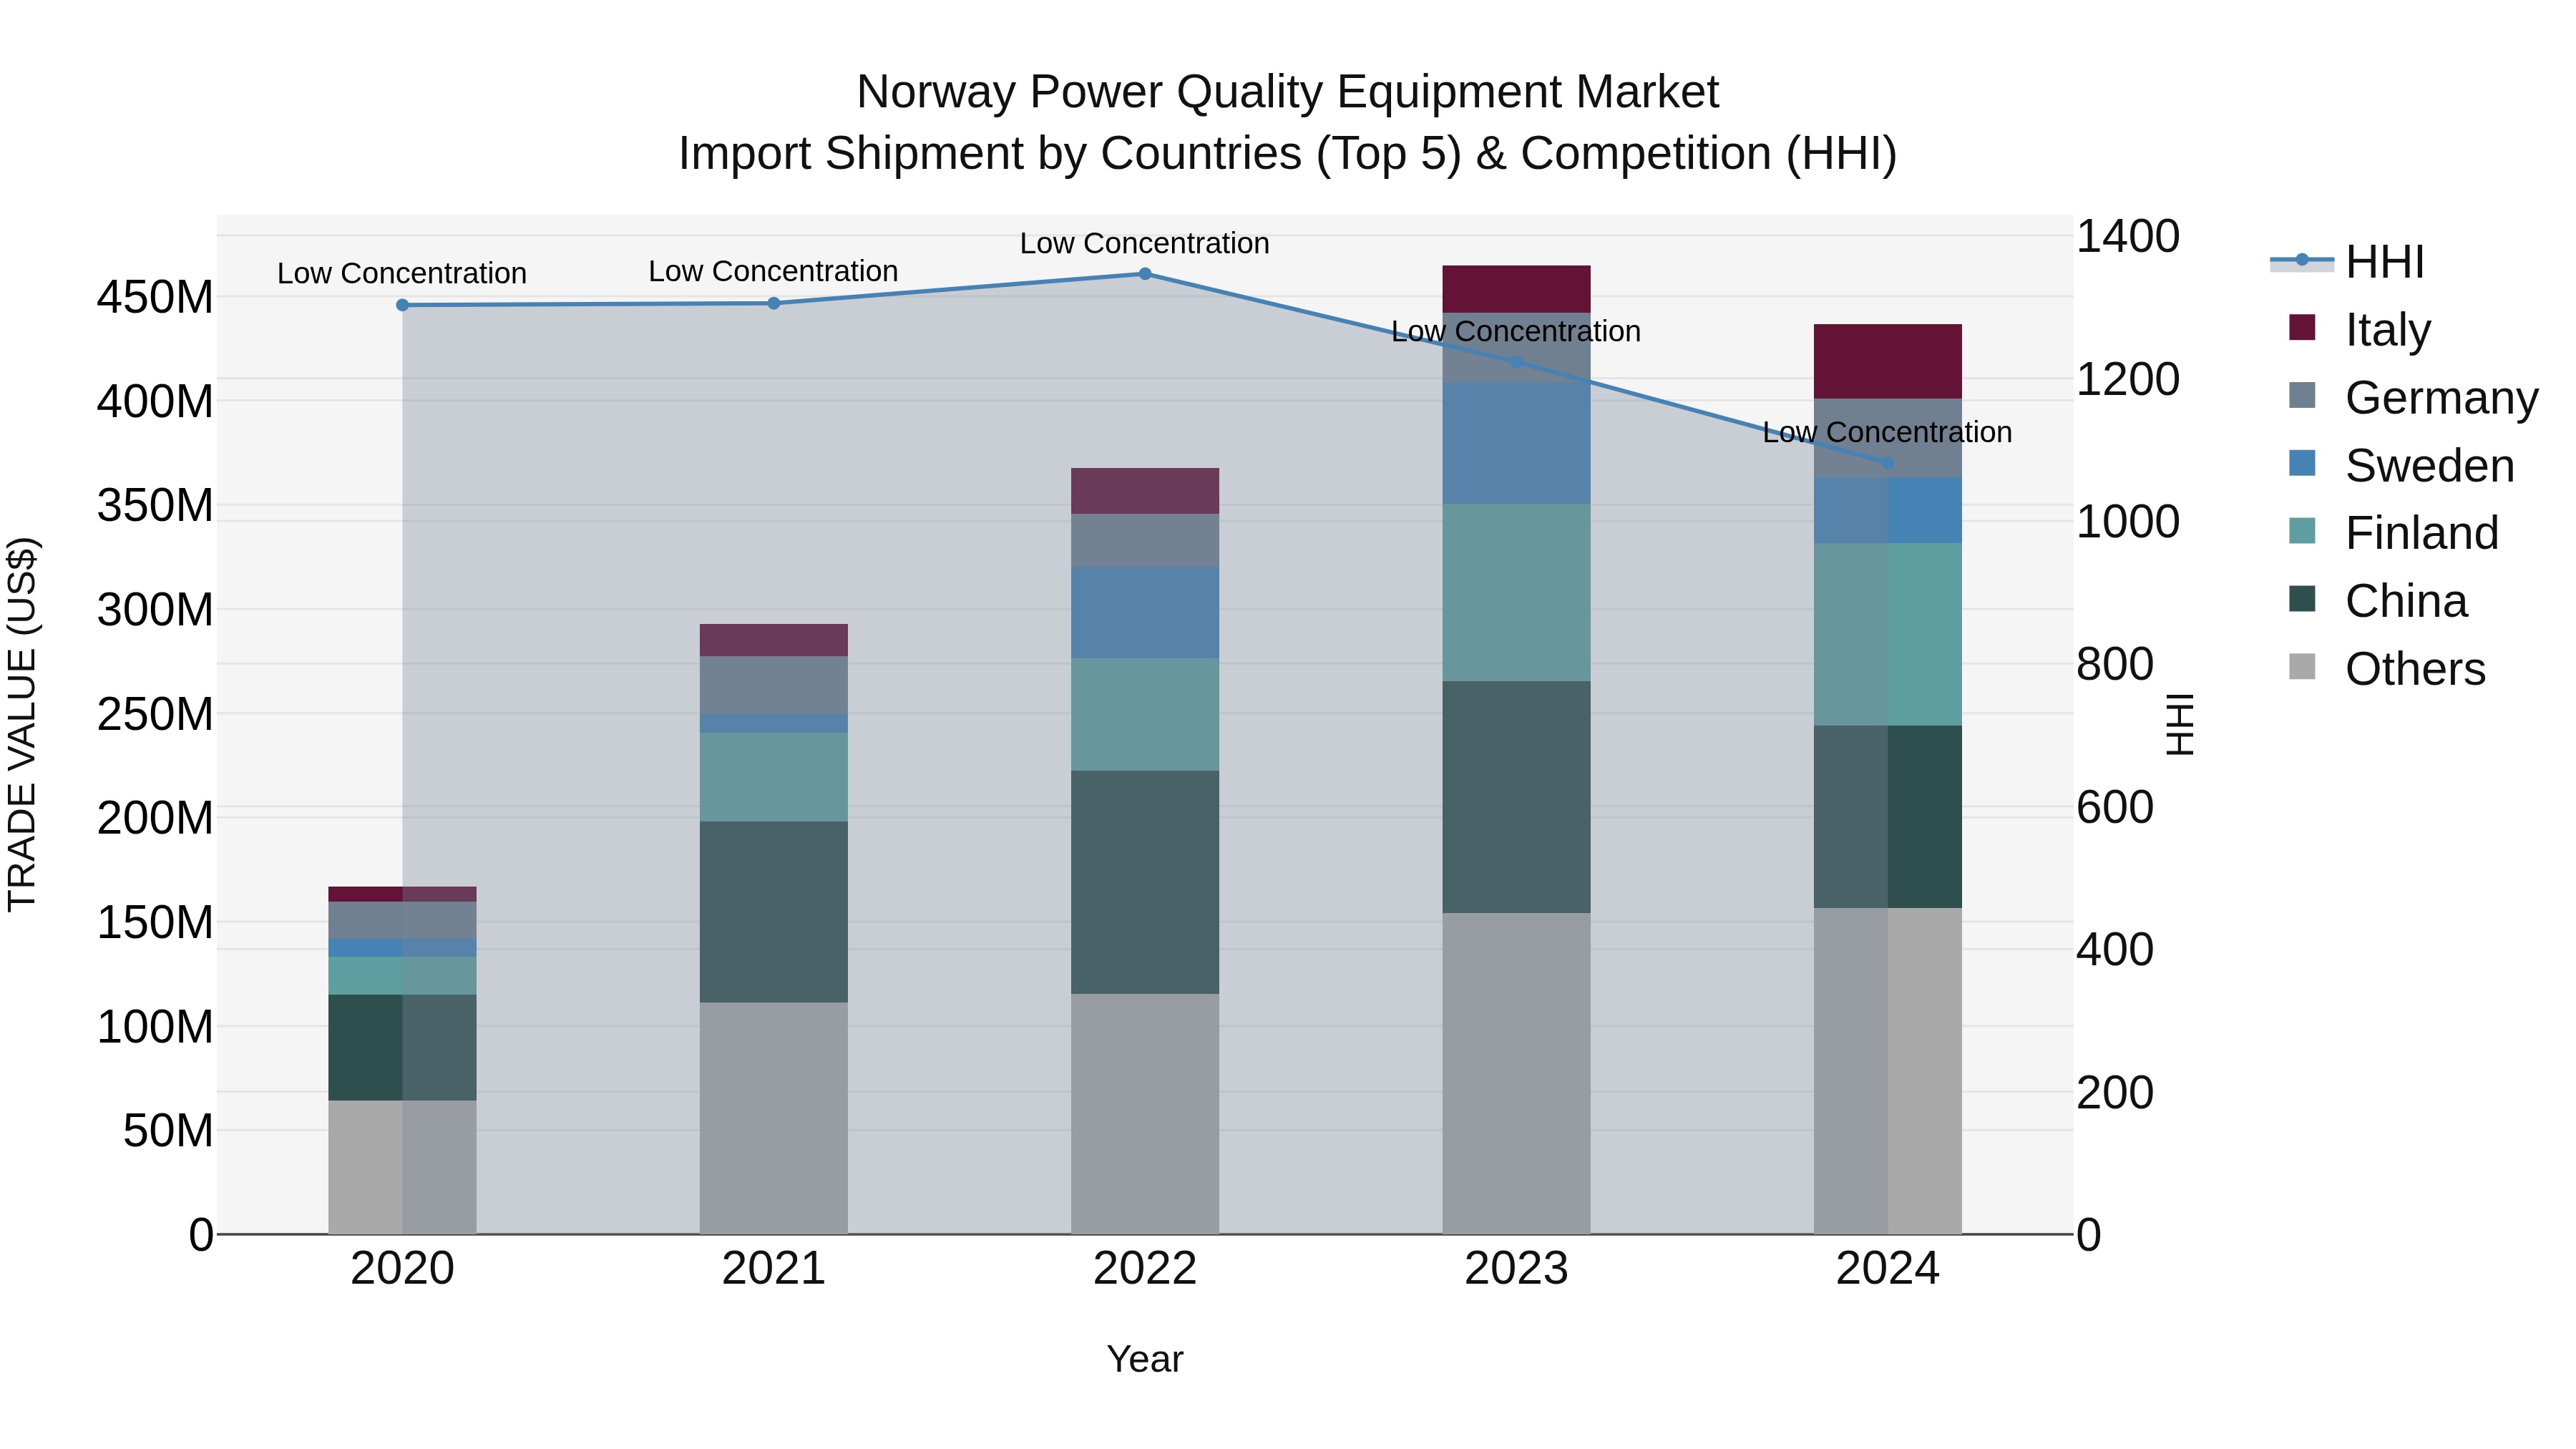
Norway Power Quality Equipment Market Top 5 Importing Countries and Market Competition (HHI) Analysis
Norway`s power quality equipment import shipments in 2024 saw a diverse mix of top exporting countries including Finland, China, Germany, Italy, and Sweden. With a low concentration level indicated by the Herfindahl-Hirschman Index (HHI), the market remains competitive. The impressive compound annual growth rate (CAGR) of 27.2% from 2020 to 2024 highlights the increasing demand for power quality equipment in Norway. However, the slight decline in growth rate from 2023 to 2024 at -6.07% suggests a potential slowdown or market adjustment in the short term.
Norway Power Quality Equipment Market Overview
The power quality equipment market in Norway is expanding as businesses seek to improve the quality and reliability of their electrical power supplies. Power quality equipment, such as voltage regulators and uninterruptible power supplies (UPS), helps prevent and mitigate power disturbances. The market is influenced by the increasing reliance on sensitive electronic equipment and the need for stable power sources.
Drivers of the market
The power quality equipment market in Norway is driven by the increasing need to address power quality issues such as voltage sags, surges, and harmonics in industrial and commercial settings. The growing reliance on sensitive electronic equipment and the expansion of data centers drive the demand for power quality solutions. Additionally, regulations and standards aimed at maintaining power quality contribute to market growth.
Challenges of the market
The Norway power quality equipment market faces challenges related to the need for advanced technology and evolving industry standards. Ensuring that power quality equipment can effectively address issues such as voltage sags, harmonics, and transients requires ongoing innovation and adaptation. Additionally, the market must navigate the complexities of integrating new technologies with existing power infrastructure.
Government Policy of the market
Norways approach to power quality equipment is guided by policies that aim to improve grid stability and reduce power disturbances. The government supports the development and deployment of equipment that enhances power quality through incentives and standards. Regulations ensure that power quality equipment meets performance criteria and contributes to the overall reliability of the power supply system.
Key Highlights of the Report:
- Norway Power Quality Equipment Market Outlook
- Market Size of Norway Power Quality Equipment Market, 2024
- Forecast of Norway Power Quality Equipment Market, 2031
- Historical Data and Forecast of Norway Power Quality Equipment Revenues & Volume for the Period 2021-2031
- Norway Power Quality Equipment Market Trend Evolution
- Norway Power Quality Equipment Market Drivers and Challenges
- Norway Power Quality Equipment Price Trends
- Norway Power Quality Equipment Porter`s Five Forces
- Norway Power Quality Equipment Industry Life Cycle
- Historical Data and Forecast of Norway Power Quality Equipment Market Revenues & Volume By Equipment for the Period 2021-2031
- Historical Data and Forecast of Norway Power Quality Equipment Market Revenues & Volume By UPS for the Period 2021-2031
- Historical Data and Forecast of Norway Power Quality Equipment Market Revenues & Volume By Harmonic Filters for the Period 2021-2031
- Historical Data and Forecast of Norway Power Quality Equipment Market Revenues & Volume By Surge Protection Devices for the Period 2021-2031
- Historical Data and Forecast of Norway Power Quality Equipment Market Revenues & Volume By Voltage Regulators for the Period 2021-2031
- Historical Data and Forecast of Norway Power Quality Equipment Market Revenues & Volume By Static VAR compensators for the Period 2021-2031
- Historical Data and Forecast of Norway Power Quality Equipment Market Revenues & Volume By Power Quality Meters for the Period 2021-2031
- Historical Data and Forecast of Norway Power Quality Equipment Market Revenues & Volume By Phase for the Period 2021-2031
- Historical Data and Forecast of Norway Power Quality Equipment Market Revenues & Volume By Single for the Period 2021-2031
- Historical Data and Forecast of Norway Power Quality Equipment Market Revenues & Volume By Three Phase for the Period 2021-2031
- Norway Power Quality Equipment Import Export Trade Statistics
- Market Opportunity Assessment By Equipment
- Market Opportunity Assessment By Phase
- Norway Power Quality Equipment Top Companies Market Share
- Norway Power Quality Equipment Competitive Benchmarking By Technical and Operational Parameters
- Norway Power Quality Equipment Company Profiles
- Norway Power Quality Equipment Key Strategic Recommendations
Frequently Asked Questions About the Market Study (FAQs):
6Wresearch actively monitors the Norway Power Quality Equipment Market and publishes its comprehensive annual report, highlighting emerging trends, growth drivers, revenue analysis, and forecast outlook. Our insights help businesses to make data-backed strategic decisions with ongoing market dynamics. Our analysts track relevent industries related to the Norway Power Quality Equipment Market, allowing our clients with actionable intelligence and reliable forecasts tailored to emerging regional needs.
Yes, we provide customisation as per your requirements. To learn more, feel free to contact us on sales@6wresearch.com
1 Executive Summary |
2 Introduction |
2.1 Key Highlights of the Report |
2.2 Report Description |
2.3 Market Scope & Segmentation |
2.4 Research Methodology |
2.5 Assumptions |
3 Norway Power Quality Equipment Market Overview |
3.1 Norway Country Macro Economic Indicators |
3.2 Norway Power Quality Equipment Market Revenues & Volume, 2021 & 2031F |
3.3 Norway Power Quality Equipment Market - Industry Life Cycle |
3.4 Norway Power Quality Equipment Market - Porter's Five Forces |
3.5 Norway Power Quality Equipment Market Revenues & Volume Share, By Equipment, 2021 & 2031F |
3.6 Norway Power Quality Equipment Market Revenues & Volume Share, By Phase, 2021 & 2031F |
4 Norway Power Quality Equipment Market Dynamics |
4.1 Impact Analysis |
4.2 Market Drivers |
4.2.1 Increasing adoption of renewable energy sources requiring power quality equipment for grid integration |
4.2.2 Growing industrial sector in Norway demanding reliable power quality solutions |
4.2.3 Stringent government regulations mandating the use of power quality equipment to ensure grid stability |
4.3 Market Restraints |
4.3.1 High initial investment costs associated with power quality equipment |
4.3.2 Lack of awareness among end-users about the benefits of power quality equipment |
4.3.3 Limited availability of skilled professionals for installation and maintenance of power quality equipment |
5 Norway Power Quality Equipment Market Trends |
6 Norway Power Quality Equipment Market Segmentations |
6.1 Norway Power Quality Equipment Market, By Equipment |
6.1.1 Overview and Analysis |
6.1.2 Norway Power Quality Equipment Market Revenues & Volume, By UPS, 2021-2031F |
6.1.3 Norway Power Quality Equipment Market Revenues & Volume, By Harmonic Filters, 2021-2031F |
6.1.4 Norway Power Quality Equipment Market Revenues & Volume, By Surge Protection Devices, 2021-2031F |
6.1.5 Norway Power Quality Equipment Market Revenues & Volume, By Voltage Regulators, 2021-2031F |
6.1.6 Norway Power Quality Equipment Market Revenues & Volume, By Static VAR compensators, 2021-2031F |
6.1.7 Norway Power Quality Equipment Market Revenues & Volume, By Power Quality Meters, 2021-2031F |
6.2 Norway Power Quality Equipment Market, By Phase |
6.2.1 Overview and Analysis |
6.2.2 Norway Power Quality Equipment Market Revenues & Volume, By Single , 2021-2031F |
6.2.3 Norway Power Quality Equipment Market Revenues & Volume, By Three Phase, 2021-2031F |
7 Norway Power Quality Equipment Market Import-Export Trade Statistics |
7.1 Norway Power Quality Equipment Market Export to Major Countries |
7.2 Norway Power Quality Equipment Market Imports from Major Countries |
8 Norway Power Quality Equipment Market Key Performance Indicators |
8.1 Average downtime reduction percentage due to the implementation of power quality equipment |
8.2 Percentage increase in the adoption of power quality equipment by key industries in Norway |
8.3 Number of government initiatives or policies supporting the use of power quality equipment in the country |
9 Norway Power Quality Equipment Market - Opportunity Assessment |
9.1 Norway Power Quality Equipment Market Opportunity Assessment, By Equipment, 2021 & 2031F |
9.2 Norway Power Quality Equipment Market Opportunity Assessment, By Phase, 2021 & 2031F |
10 Norway Power Quality Equipment Market - Competitive Landscape |
10.1 Norway Power Quality Equipment Market Revenue Share, By Companies, 2024 |
10.2 Norway Power Quality Equipment Market Competitive Benchmarking, By Operating and Technical Parameters |
11 Company Profiles |
12 Recommendations | 13 Disclaimer |
Global Go To Market Strategy - 2030
Export potential enables firms to identify high-growth global markets with greater confidence by combining advanced trade intelligence with a structured quantitative methodology. The framework analyzes emerging demand trends and country-level import patterns while integrating macroeconomic and trade datasets such as GDP and population forecasts, bilateral import–export flows, tariff structures, elasticity differentials between developed and developing economies, geographic distance, and import demand projections. Using weighted trade values from 2020–2024 as the base period to project country-to-country export potential for 2030, these inputs are operationalized through calculated drivers such as gravity model parameters, tariff impact factors, and projected GDP per-capita growth. Through an analysis of hidden potentials, demand hotspots, and market conditions that are most favorable to success, this method enables firms to focus on target countries, maximize returns, and global expansion with data, backed by accuracy.
By factoring in the projected importer demand gap that is currently unmet and could be potential opportunity, it identifies the potential for the Exporter (Country) among 190 countries, against the general trade analysis, which identifies the biggest importer or exporter.
To discover high-growth global markets and optimize your business strategy:
Click Here
Pricing
- Single User License$ 1,995
- Department License$ 2,400
- Site License$ 3,120
- Global License$ 3,795

Leadership Perspectives from Industry Events
Search
Thought Leadership and Analyst Meet


Our Clients
6WResearch In News
- Doha a strategic location for EV manufacturing hub: IPA Qatar
- Demand for luxury TVs surging in the GCC, says Samsung
- Empowering Growth: The Thriving Journey of Bangladesh’s Cable Industry
- Demand for luxury TVs surging in the GCC, says Samsung
- Video call with a traditional healer? Once unthinkable, it’s now common in South Africa
- Intelligent Buildings To Smooth GCC’s Path To Net Zero
Latest Reports
- Taiwan Airport Wireless Infrastructure Market (2026-2032)
- Vietnam Airport Wireless Infrastructure Market (2026-2032)
- Thailand Airport Wireless Infrastructure Market (2026-2032)
- South Korea Airport Wireless Infrastructure Market (2026-2032)
- Romania Airport Wireless Infrastructure Market (2026-2032)
- Qatar Airport Wireless Infrastructure Market (2026-2032)
- Philippines Airport Wireless Infrastructure Market (2026-2032)
- Japan Airport Wireless Infrastructure Market (2026-2032)
- Taiwan Airport Winter Services Market (2026-2032)
- Vietnam Airport Winter Services Market (2026-2032)
Industry Events and Analyst Meet

HIMTEX 2026

India Refining Summit 2026

India EV Show 2026

EV tech India Expo 2026

Auto Tech Asia 2026
Whitepaper
- Middle East & Africa Commercial Security Market Click here to view more.
- Middle East & Africa Fire Safety Systems & Equipment Market Click here to view more.
- GCC Drone Market Click here to view more.
- Middle East Lighting Fixture Market Click here to view more.
- GCC Physical & Perimeter Security Market Click here to view more.