Norway Table Top Sweeteners Market (2025-2031) | Outlook, Growth, Competitive Landscape, Forecast, Trends, Share, Industry, Value, Analysis, Segmentation, Size & Revenue, Companies
Market Forecast By Type (Natural, Artificial), By Application (Dining Room, Family, Others) And Competitive Landscape
| Product Code: ETC8679961 | Publication Date: Sep 2024 | Updated Date: Nov 2025 | Product Type: Market Research Report | |
| Publisher: 6Wresearch | Author: Shubham Padhi | No. of Pages: 75 | No. of Figures: 35 | No. of Tables: 20 |
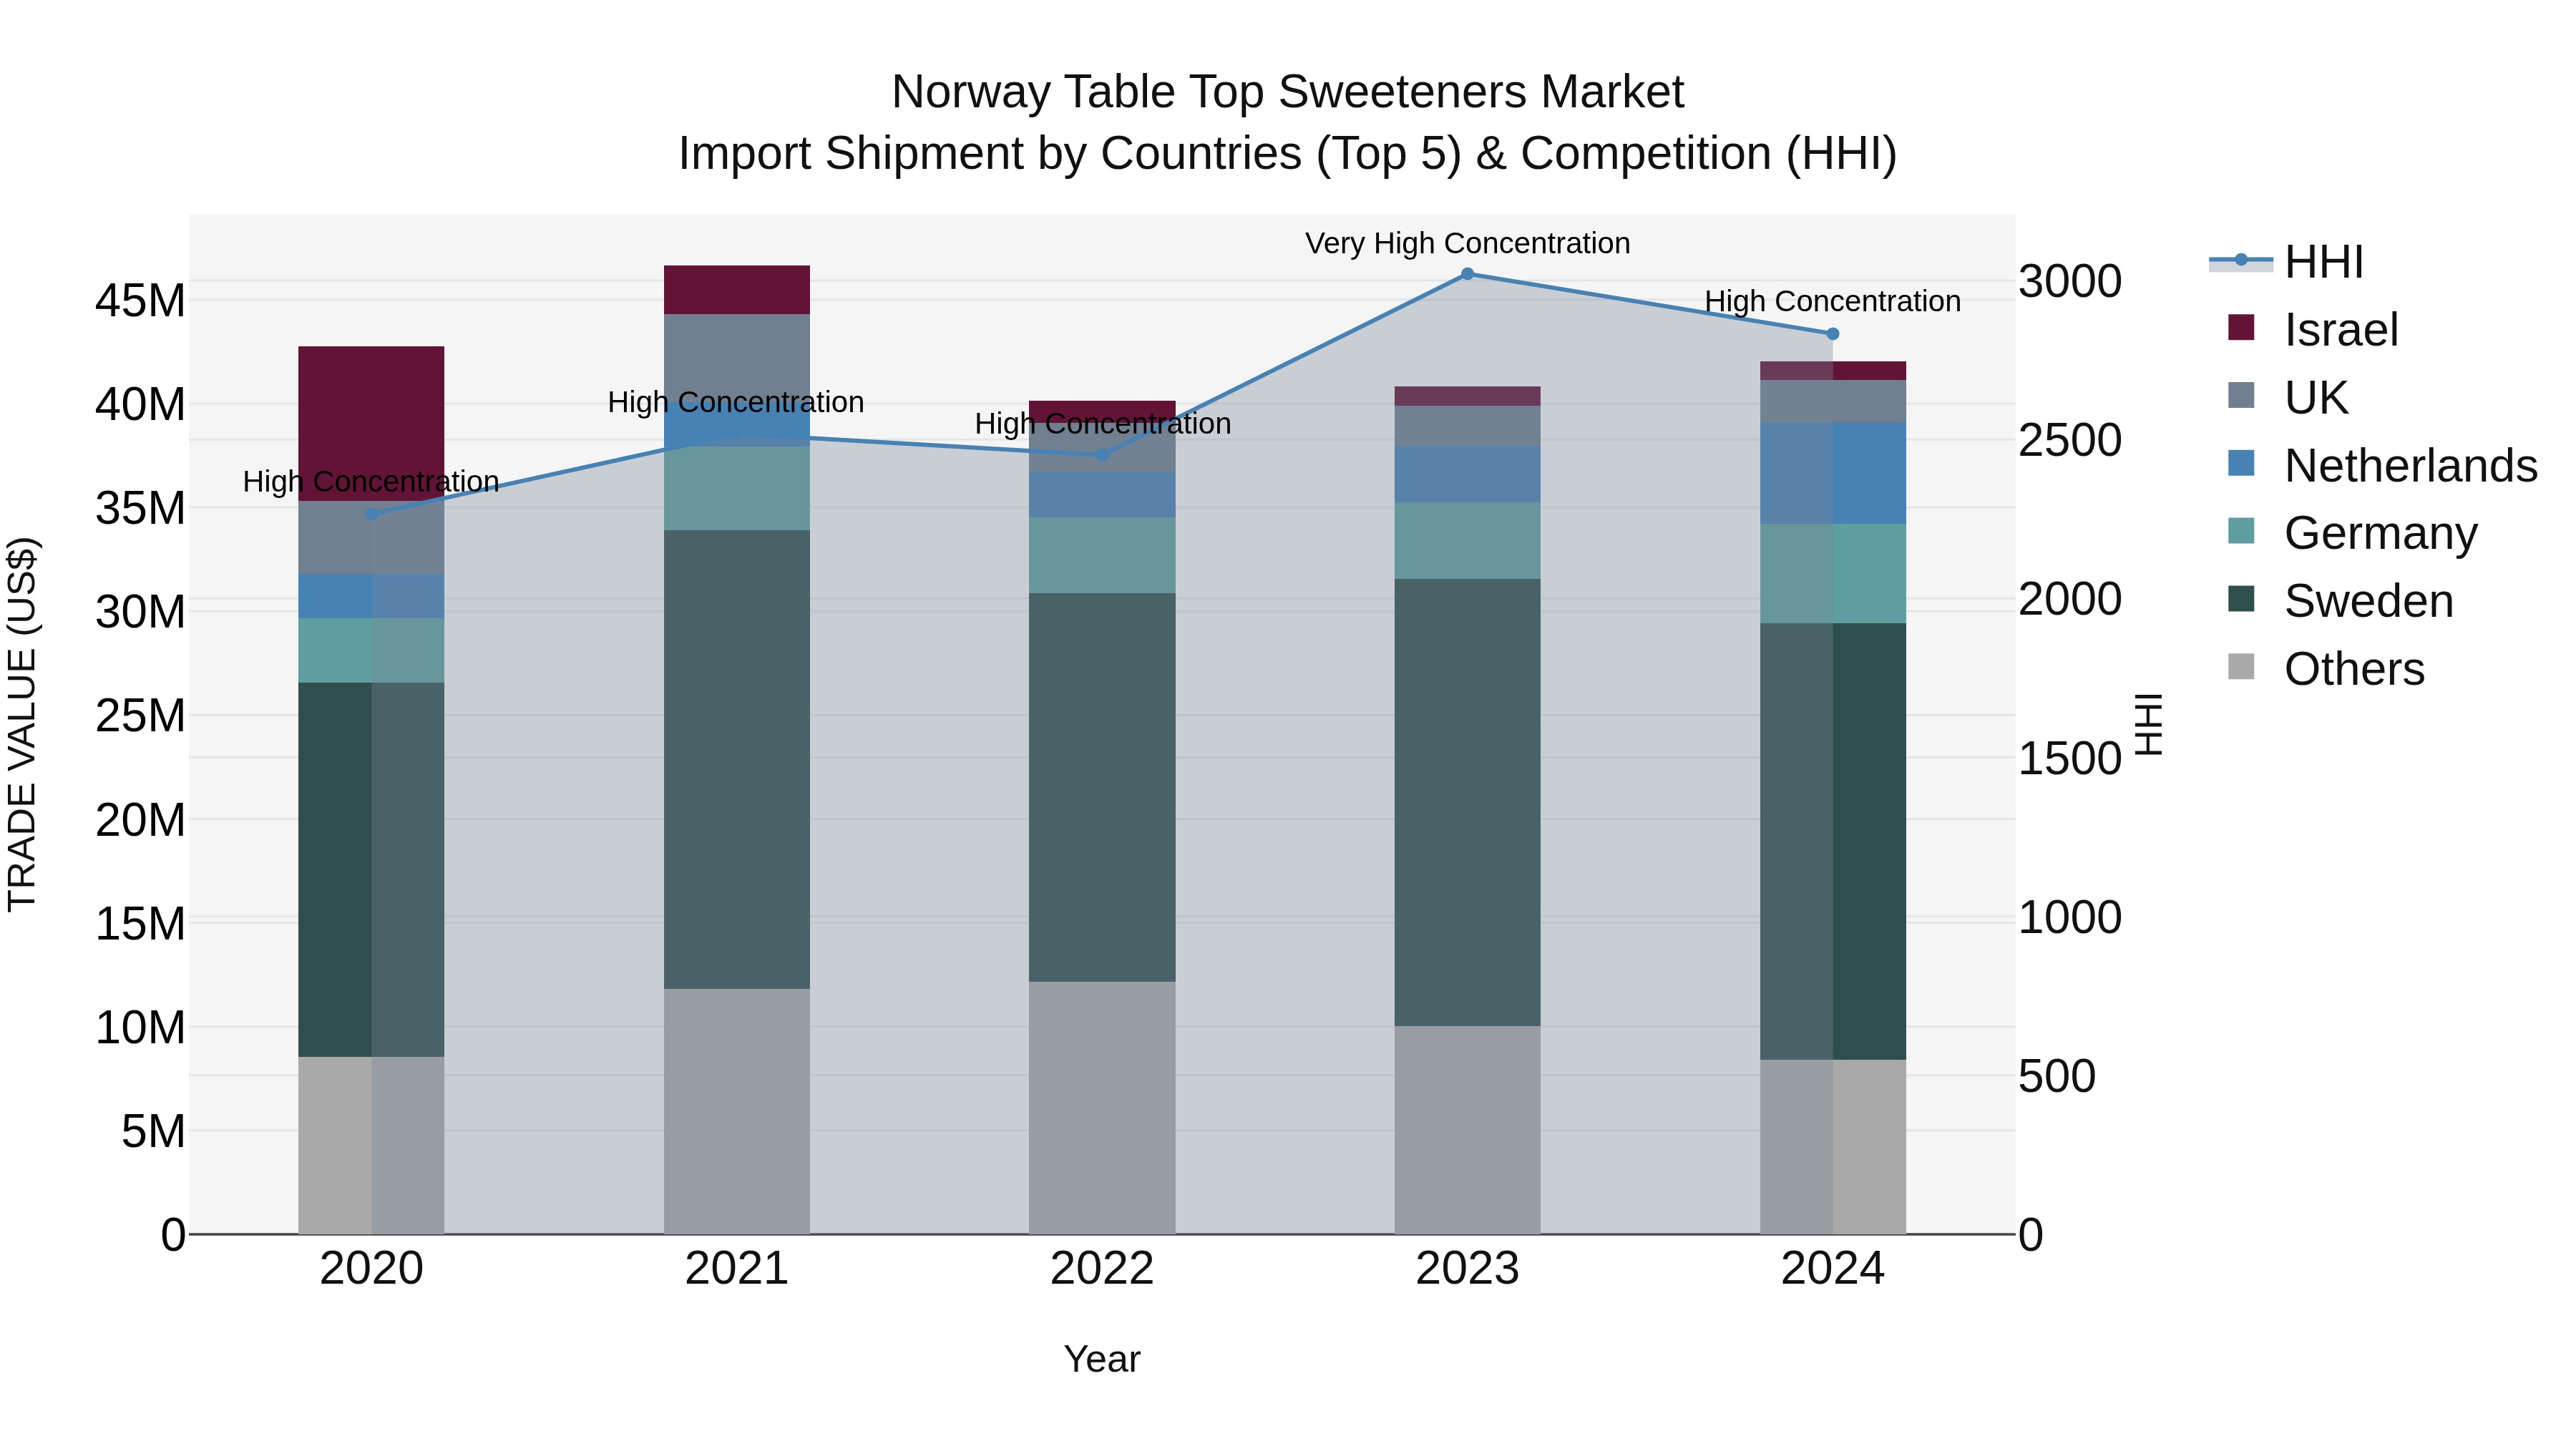
Norway Table Top Sweeteners Market Top 5 Importing Countries and Market Competition (HHI) Analysis
Norway`s table top sweeteners import market continues to be dominated by key suppliers such as Sweden, Netherlands, Germany, UK, and Poland. Despite a slight decrease in market concentration from 2023 to 2024, the market remains highly concentrated. The overall compound annual growth rate (CAGR) for the period 2020-2024 was negative at -0.42%, but there was a positive growth rate of 2.97% from 2023 to 2024. This indicates a moderate recovery in the market, potentially driven by changing consumer preferences and increased demand for sweeteners in Norway.
Norway Table Top Sweeteners Market Synopsis
The Norway Table Top Sweeteners Market is witnessing steady growth driven by increasing consumer preference for low-calorie and sugar-free alternatives. With growing awareness about the health risks associated with excessive sugar consumption, the demand for table top sweeteners has been on the rise. Stevia-based sweeteners are gaining popularity due to their natural origin and zero-calorie properties. Artificial sweeteners such as aspartame and sucralose also hold a significant market share. The market is characterized by the presence of both global and regional players offering a variety of sweetener products in different forms such as powder, liquid, and tablets. Key factors influencing market growth include changing consumer lifestyles, rising incidence of diabetes and obesity, and the growing trend towards healthier food choices. Overall, the Norway Table Top Sweeteners Market is expected to continue its growth trajectory in the coming years.
Norway Table Top Sweeteners Market Trends
The Norway Table Top Sweeteners Market is witnessing a growing demand for natural sweeteners like stevia and monk fruit due to increasing health consciousness among consumers. There is a shift towards sugar-free and low-calorie sweeteners driven by the rising prevalence of diabetes and obesity in the country. The market is also seeing a surge in innovative product offerings such as liquid sweeteners and flavored sweeteners to cater to diverse consumer preferences. Opportunities exist for market players to capitalize on the growing trend of clean label and organic sweeteners, as well as to expand product distribution through online retail channels. Additionally, partnerships with food and beverage companies to develop customized sweetening solutions and product formulations could further drive growth in the Norway Table Top Sweeteners Market.
Norway Table Top Sweeteners Market Challenges
In the Norway Table Top Sweeteners Market, some challenges faced include increasing consumer awareness and concerns about the health effects of artificial sweeteners, leading to a shift towards natural sweeteners such as stevia and monk fruit. Additionally, regulatory restrictions on certain artificial sweeteners and the availability of a wide range of sugar substitutes make it challenging for companies to differentiate their products and stand out in the market. The fluctuating prices of raw materials used in sweeteners production also impact profit margins for manufacturers. Moreover, competition from traditional sugar and other alternative sweeteners further intensifies the market landscape, requiring companies to invest in innovative marketing strategies and product development to maintain market share and meet evolving consumer preferences.
Norway Table Top Sweeteners Market Investment Opportunities
The Norway Table Top Sweeteners Market is primarily driven by the increasing consumer preference for healthier alternatives to sugar, as individuals become more health-conscious and seek to manage their sugar intake. The rising prevalence of lifestyle diseases like obesity and diabetes is also contributing to the demand for table top sweeteners as a sugar substitute. Additionally, the growing trend of low-calorie and sugar-free products in the food and beverage industry is fueling market growth. The convenience and portability of table top sweeteners, along with their versatility in various applications such as coffee, tea, and baking, are further driving their popularity among consumers seeking to reduce their sugar consumption without compromising on taste.
Norway Table Top Sweeteners Market Government Polices
In Norway, the Table Top Sweeteners Market is regulated by the Norwegian Food Safety Authority (Mattilsynet) under the Food Act and the Food Regulations. The authority sets maximum limits for sweeteners in various food products, including table-top sweeteners, to ensure consumer safety and compliance with health standards. The use of artificial sweeteners such as aspartame, saccharin, and steviol glycosides is permitted within specified limits. Additionally, there are strict labeling requirements in place to inform consumers about the sweeteners used in the products. The government emphasizes transparency and consumer awareness in the market, aiming to protect public health while also promoting a competitive and innovative industry for table-top sweeteners in Norway.
Norway Table Top Sweeteners Market Future Outlook
The future outlook for the Norway Table Top Sweeteners Market is projected to witness steady growth due to increasing health consciousness among consumers, leading to a shift towards low-calorie sweeteners as a substitute for sugar. With rising concerns about obesity and diabetes, there is a growing demand for sugar alternatives in various food and beverage products. The market is expected to be driven by the introduction of innovative sweeteners derived from natural sources and advancements in product formulations to enhance taste profiles. Additionally, the convenience factor and portability of table top sweeteners are likely to contribute to market growth as consumers seek on-the-go solutions for their sweetening needs. Overall, the Norway Table Top Sweeteners Market is anticipated to experience sustained growth in the coming years.
Key Highlights of the Report:
- Norway Table Top Sweeteners Market Outlook
- Market Size of Norway Table Top Sweeteners Market, 2024
- Forecast of Norway Table Top Sweeteners Market, 2031
- Historical Data and Forecast of Norway Table Top Sweeteners Revenues & Volume for the Period 2021- 2031
- Norway Table Top Sweeteners Market Trend Evolution
- Norway Table Top Sweeteners Market Drivers and Challenges
- Norway Table Top Sweeteners Price Trends
- Norway Table Top Sweeteners Porter's Five Forces
- Norway Table Top Sweeteners Industry Life Cycle
- Historical Data and Forecast of Norway Table Top Sweeteners Market Revenues & Volume By Type for the Period 2021- 2031
- Historical Data and Forecast of Norway Table Top Sweeteners Market Revenues & Volume By Natural for the Period 2021- 2031
- Historical Data and Forecast of Norway Table Top Sweeteners Market Revenues & Volume By Artificial for the Period 2021- 2031
- Historical Data and Forecast of Norway Table Top Sweeteners Market Revenues & Volume By Application for the Period 2021- 2031
- Historical Data and Forecast of Norway Table Top Sweeteners Market Revenues & Volume By Dining Room for the Period 2021- 2031
- Historical Data and Forecast of Norway Table Top Sweeteners Market Revenues & Volume By Family for the Period 2021- 2031
- Historical Data and Forecast of Norway Table Top Sweeteners Market Revenues & Volume By Others for the Period 2021- 2031
- Norway Table Top Sweeteners Import Export Trade Statistics
- Market Opportunity Assessment By Type
- Market Opportunity Assessment By Application
- Norway Table Top Sweeteners Top Companies Market Share
- Norway Table Top Sweeteners Competitive Benchmarking By Technical and Operational Parameters
- Norway Table Top Sweeteners Company Profiles
- Norway Table Top Sweeteners Key Strategic Recommendations
Frequently Asked Questions About the Market Study (FAQs):
6Wresearch actively monitors the Norway Table Top Sweeteners Market and publishes its comprehensive annual report, highlighting emerging trends, growth drivers, revenue analysis, and forecast outlook. Our insights help businesses to make data-backed strategic decisions with ongoing market dynamics. Our analysts track relevent industries related to the Norway Table Top Sweeteners Market, allowing our clients with actionable intelligence and reliable forecasts tailored to emerging regional needs.
Yes, we provide customisation as per your requirements. To learn more, feel free to contact us on sales@6wresearch.com
1 Executive Summary |
2 Introduction |
2.1 Key Highlights of the Report |
2.2 Report Description |
2.3 Market Scope & Segmentation |
2.4 Research Methodology |
2.5 Assumptions |
3 Norway Table Top Sweeteners Market Overview |
3.1 Norway Country Macro Economic Indicators |
3.2 Norway Table Top Sweeteners Market Revenues & Volume, 2021 & 2031F |
3.3 Norway Table Top Sweeteners Market - Industry Life Cycle |
3.4 Norway Table Top Sweeteners Market - Porter's Five Forces |
3.5 Norway Table Top Sweeteners Market Revenues & Volume Share, By Type, 2021 & 2031F |
3.6 Norway Table Top Sweeteners Market Revenues & Volume Share, By Application, 2021 & 2031F |
4 Norway Table Top Sweeteners Market Dynamics |
4.1 Impact Analysis |
4.2 Market Drivers |
4.2.1 Increasing health consciousness and awareness about the negative effects of sugar consumption. |
4.2.2 Rising prevalence of lifestyle diseases such as diabetes and obesity, leading to a shift towards healthier alternatives like table top sweeteners. |
4.2.3 Growing demand for convenience and on-the-go consumption options, driving the market for table top sweeteners. |
4.3 Market Restraints |
4.3.1 Stringent regulations and safety concerns regarding artificial sweeteners used in table top sweeteners. |
4.3.2 Limited awareness and acceptance of table top sweeteners among certain consumer segments. |
5 Norway Table Top Sweeteners Market Trends |
6 Norway Table Top Sweeteners Market, By Types |
6.1 Norway Table Top Sweeteners Market, By Type |
6.1.1 Overview and Analysis |
6.1.2 Norway Table Top Sweeteners Market Revenues & Volume, By Type, 2021- 2031F |
6.1.3 Norway Table Top Sweeteners Market Revenues & Volume, By Natural, 2021- 2031F |
6.1.4 Norway Table Top Sweeteners Market Revenues & Volume, By Artificial, 2021- 2031F |
6.2 Norway Table Top Sweeteners Market, By Application |
6.2.1 Overview and Analysis |
6.2.2 Norway Table Top Sweeteners Market Revenues & Volume, By Dining Room, 2021- 2031F |
6.2.3 Norway Table Top Sweeteners Market Revenues & Volume, By Family, 2021- 2031F |
6.2.4 Norway Table Top Sweeteners Market Revenues & Volume, By Others, 2021- 2031F |
7 Norway Table Top Sweeteners Market Import-Export Trade Statistics |
7.1 Norway Table Top Sweeteners Market Export to Major Countries |
7.2 Norway Table Top Sweeteners Market Imports from Major Countries |
8 Norway Table Top Sweeteners Market Key Performance Indicators |
8.1 Consumer awareness and perception of table top sweeteners as a healthier alternative. |
8.2 Growth in the number of product innovations and introductions in the table top sweeteners market. |
8.3 Adoption rate of table top sweeteners by food service establishments and cafes. |
9 Norway Table Top Sweeteners Market - Opportunity Assessment |
9.1 Norway Table Top Sweeteners Market Opportunity Assessment, By Type, 2021 & 2031F |
9.2 Norway Table Top Sweeteners Market Opportunity Assessment, By Application, 2021 & 2031F |
10 Norway Table Top Sweeteners Market - Competitive Landscape |
10.1 Norway Table Top Sweeteners Market Revenue Share, By Companies, 2024 |
10.2 Norway Table Top Sweeteners Market Competitive Benchmarking, By Operating and Technical Parameters |
11 Company Profiles |
12 Recommendations |
13 Disclaimer |
Export potential assessment - trade Analytics for 2030
Export potential enables firms to identify high-growth global markets with greater confidence by combining advanced trade intelligence with a structured quantitative methodology. The framework analyzes emerging demand trends and country-level import patterns while integrating macroeconomic and trade datasets such as GDP and population forecasts, bilateral import–export flows, tariff structures, elasticity differentials between developed and developing economies, geographic distance, and import demand projections. Using weighted trade values from 2020–2024 as the base period to project country-to-country export potential for 2030, these inputs are operationalized through calculated drivers such as gravity model parameters, tariff impact factors, and projected GDP per-capita growth. Through an analysis of hidden potentials, demand hotspots, and market conditions that are most favorable to success, this method enables firms to focus on target countries, maximize returns, and global expansion with data, backed by accuracy.
By factoring in the projected importer demand gap that is currently unmet and could be potential opportunity, it identifies the potential for the Exporter (Country) among 190 countries, against the general trade analysis, which identifies the biggest importer or exporter.
To discover high-growth global markets and optimize your business strategy:
Click Here
Pricing
- Single User License$ 1,995
- Department License$ 2,400
- Site License$ 3,120
- Global License$ 3,795

Search
Thought Leadership and Analyst Meet


Our Clients
Latest Reports
- Canada Cloud CFD Market (2026-2032) | Size & Revenue, Industry, Growth, Competitive Landscape, Forecast, Segmentation, Value, Outlook, Trends, Share, Analysis, Companies
- Taiwan Food Delivery Platform Market (2026-2032) | Companies, Outlook, Analysis, Trends, Value, Revenue, Segmentation, Share, Forecast, Competitive Landscape, Growth, Size & Forecast
- United Kingdom (UK) Long-term Care Insurance Market (2026-2032) | Growth, Share, Consumer Insights, Drivers, Opportunities, Competition, Pricing Analysis, Segments, Restraints, Companies, Competitive, Value, Outlook, Size, Demand, Analysis, Challenges, Strategic Insights, Investment Trends, Revenue, Trends, Supply, Forecast
- United Kingdom (UK) Long Term Care Market (2026-2032) | Companies, Outlook, Analysis, Trends, Value, Revenue, Segmentation, Share, Forecast, Competitive Landscape, Growth, Size & Forecast
- Iraq Insulation and Waterproofing Market (2026-2032) | Outlook, Drivers, Growth, Size, Share, Industry, Revenue, Trends, Demand, Competitive, Strategic Insights, Opportunities, Segments, Companies, Challenges, Strategy, Consumer Insights, Analysis, Investment Trends, Value, Segmentation, Forecast, Restraints
- India Switchgear Market Outlook (2026-2032) | Size, Share, Trends, Growth, Revenue, Forecast, Analysis, Value, Outlook
- Pakistan Contraceptive Implants Market (2025-2031) | Demand, Growth, Size, Share, Industry, Pricing Analysis, Competitive, Strategic Insights, Strategy, Consumer Insights, Analysis, Investment Trends, Opportunities, Revenue, Segments, Value, Segmentation, Supply, Forecast, Restraints, Outlook, Competition, Drivers, Trends, Companies, Challenges
- Sri Lanka Packaging Market (2026-2032) | Outlook, Competition, Drivers, Trends, Demand, Pricing Analysis, Competitive, Strategic Insights, Companies, Challenges, Strategy, Consumer Insights, Analysis, Investment Trends, Opportunities, Growth, Size, Share, Industry, Revenue, Segments, Value, Segmentation, Supply, Forecast, Restraints
- India Kids Watches Market (2026-2032) | Strategy, Consumer Insights, Analysis, Investment Trends, Opportunities, Growth, Size, Share, Industry, Revenue, Segments, Value, Segmentation, Supply, Forecast, Restraints, Outlook, Competition, Drivers, Trends, Demand, Pricing Analysis, Competitive, Strategic Insights, Companies, Challenges
- Saudi Arabia Core Assurance Service Market (2025-2031) | Strategy, Consumer Insights, Analysis, Investment Trends, Opportunities, Growth, Size, Share, Industry, Revenue, Segments, Value, Segmentation, Supply, Forecast, Restraints, Outlook, Competition, Drivers, Trends, Demand, Pricing Analysis, Competitive, Strategic Insights, Companies, Challenges
Industry Events and Analyst Meet

India EV Show 2026

EV tech India Expo 2026

Auto Tech Asia 2026

Battery Tech India 2026

Smart Production Solutions Guangzhou 2026
Whitepaper
- Middle East & Africa Commercial Security Market Click here to view more.
- Middle East & Africa Fire Safety Systems & Equipment Market Click here to view more.
- GCC Drone Market Click here to view more.
- Middle East Lighting Fixture Market Click here to view more.
- GCC Physical & Perimeter Security Market Click here to view more.
6WResearch In News
- Doha a strategic location for EV manufacturing hub: IPA Qatar
- Demand for luxury TVs surging in the GCC, says Samsung
- Empowering Growth: The Thriving Journey of Bangladesh’s Cable Industry
- Demand for luxury TVs surging in the GCC, says Samsung
- Video call with a traditional healer? Once unthinkable, it’s now common in South Africa
- Intelligent Buildings To Smooth GCC’s Path To Net Zero