Norway Water Market (2026-2032) | Companies, Revenue, Value, Forecast, Demand, Industry, Share, Analysis, Strategy, Consumer Insights, Competition, Drivers, Restraints, Segments, Challenges, Size, Strategic Insights, Trends, Outlook, Segmentation, Opportunities, Pricing Analysis, Supply, Investment Trends, Competitive, Growth
Market Forecast By Type (Bottled Water, Packaged Water, Purified Water, Mineral Water, Distilled Water), By Source Type (Natural Springs, Municipal Supply, Reverse Osmosis, Underground Wells, Steam Distillation), By End User (Consumers, Restaurants, Hospitals, Fitness Centers, Laboratories), By Application (Drinking Water, Food Preparation, Medical Use, Hydration, Scientific Research), By End Use (Professional Tattooing, Tattoo Studios) And Competitive Landscape
| Product Code: ETC11302289 | Publication Date: Apr 2025 | Updated Date: Apr 2026 | Product Type: Market Research Report | |
| Publisher: 6Wresearch | Author: Bhawna Singh | No. of Pages: 65 | No. of Figures: 34 | No. of Tables: 19 |
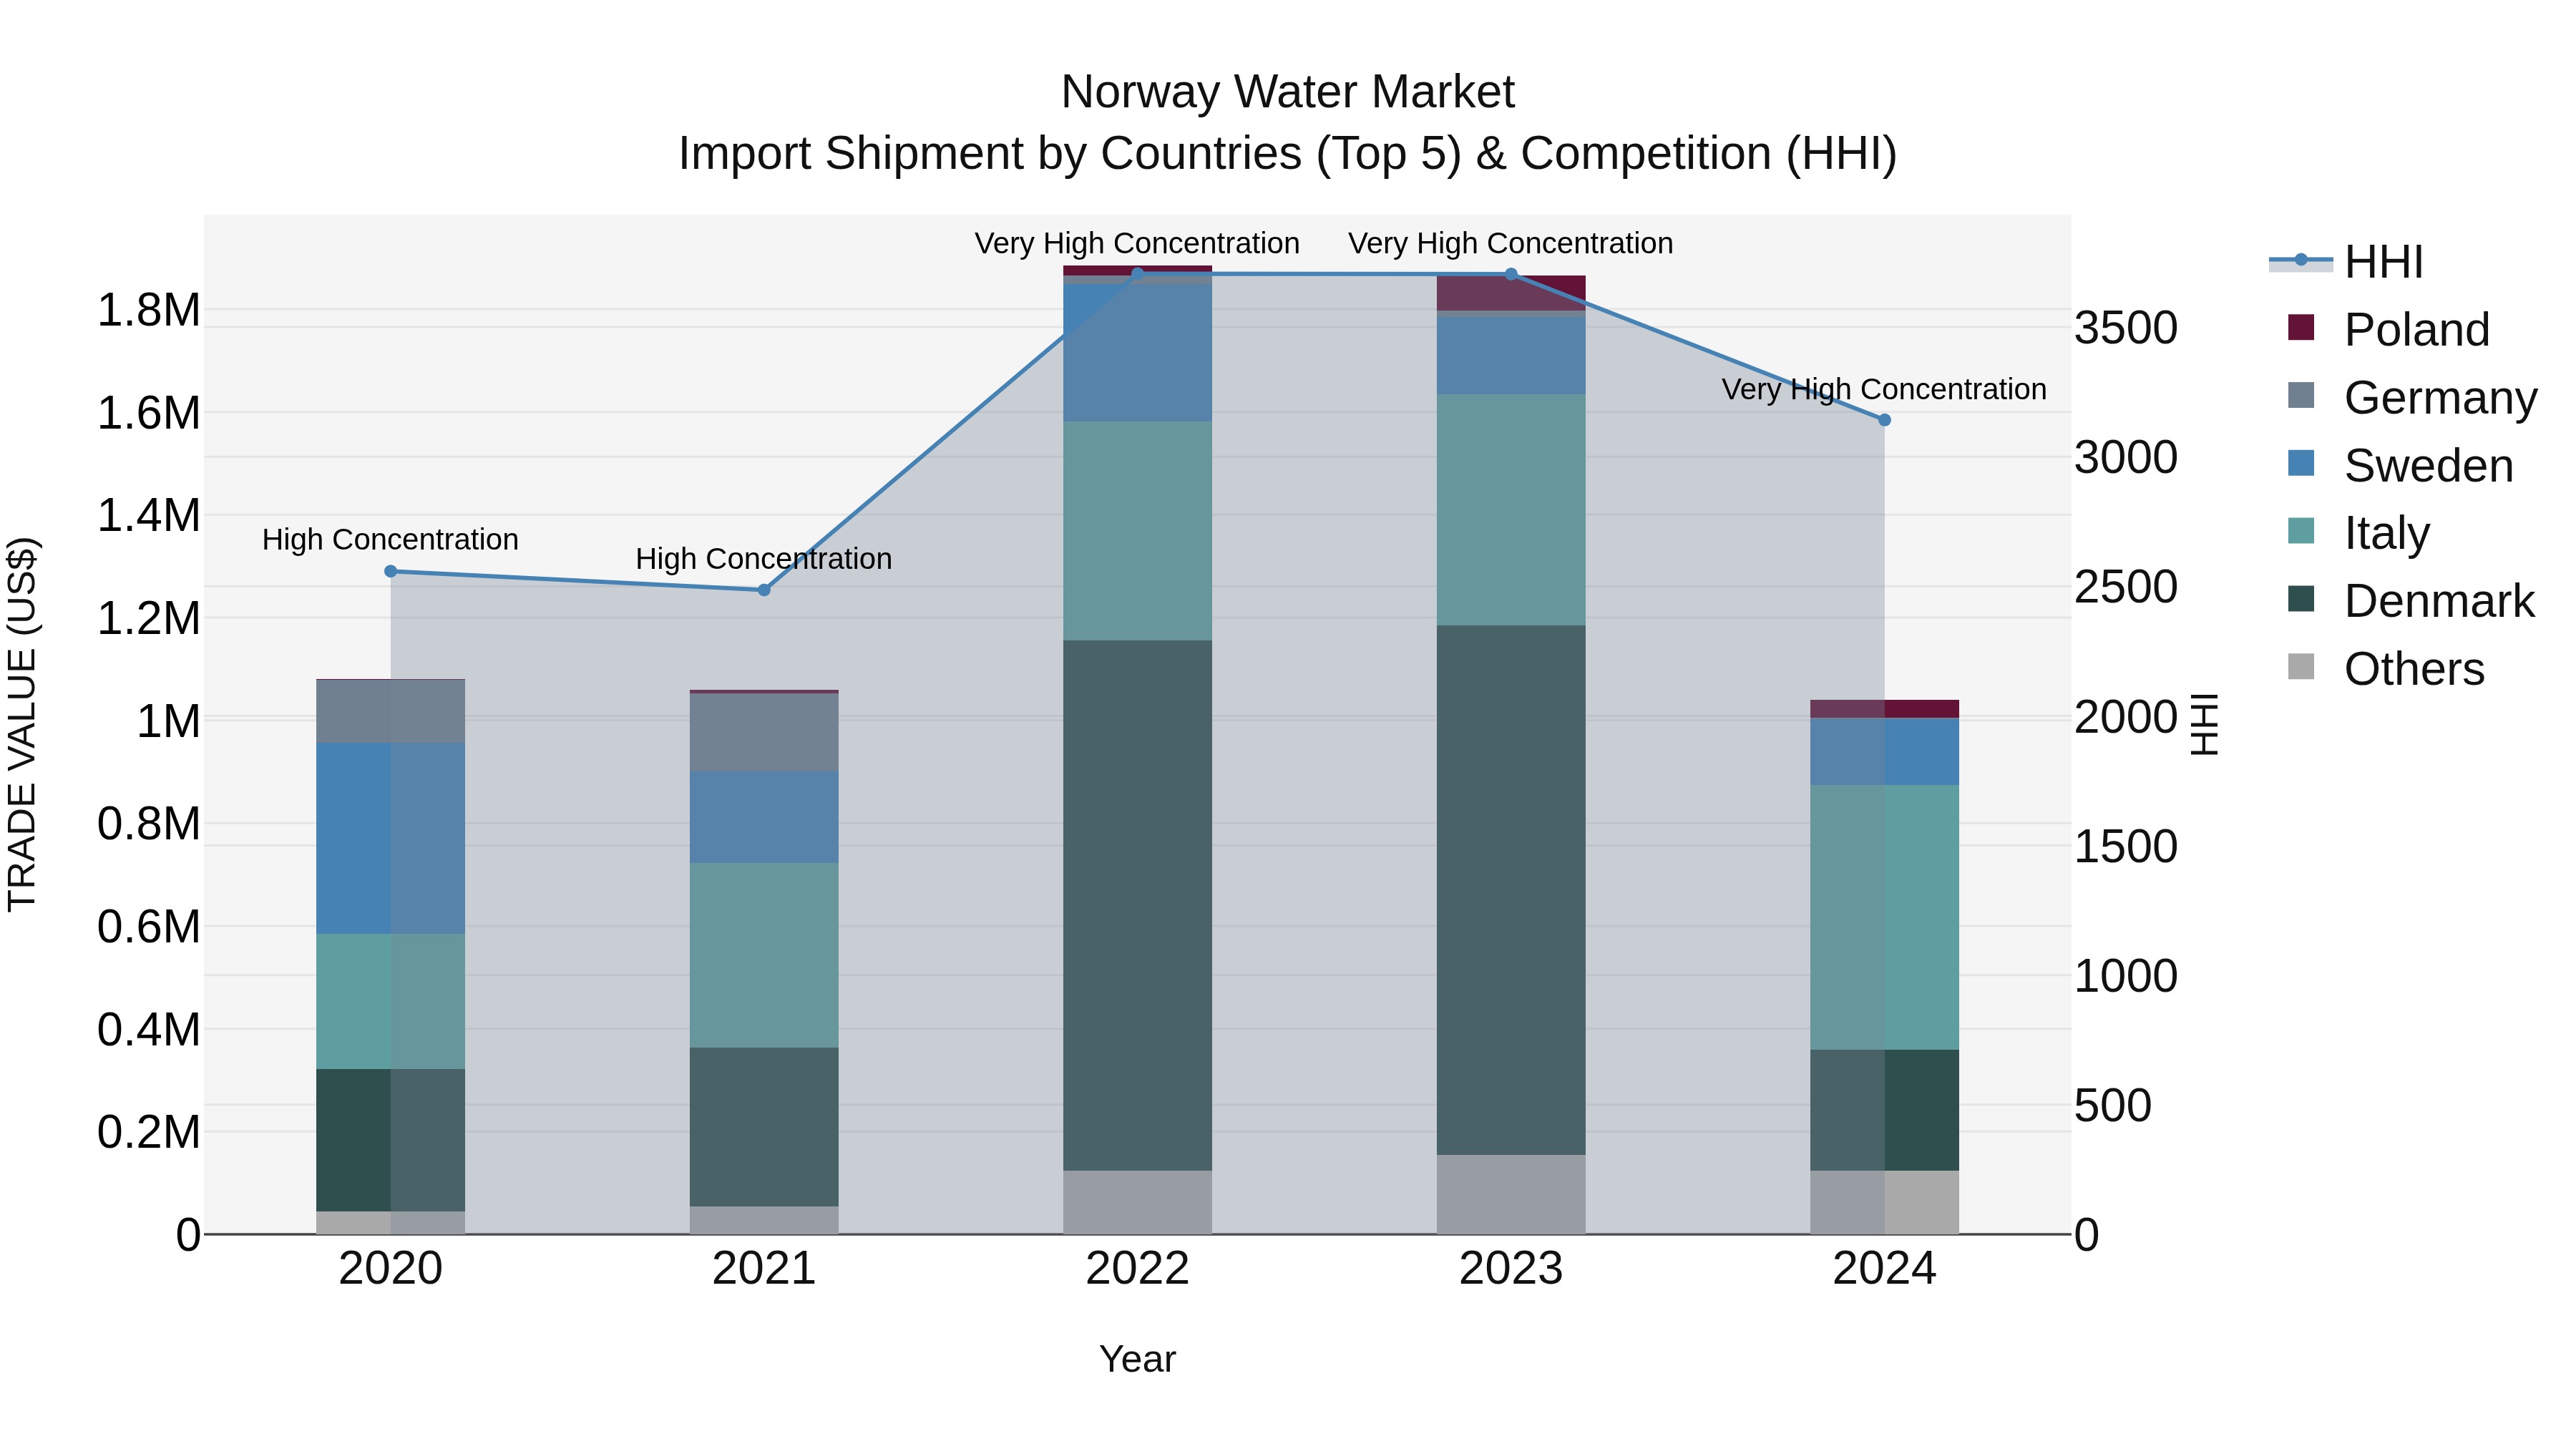
Norway Water Market Top 5 Importing Countries and Market Competition (HHI) Analysis
Norway continues to rely on water imports from key European countries such as Italy, Denmark, Sweden, Poland, and the Netherlands in 2024. The high Herfindahl-Hirschman Index (HHI) indicates a concentrated market. Despite a negative compound annual growth rate (CAGR) from 2020 to 2024, the significant decline in growth rate from 2023 to 2024 suggests a substantial downturn in water import shipments. This trend may prompt further analysis of market dynamics and potential factors influencing the decrease in import demand.
Key Highlights of the Report:
- Norway Water Market Outlook
- Market Size of Norway Water Market, 2025
- Forecast of Norway Water Market, 2032
- Historical Data and Forecast of Norway Water Revenues & Volume for the Period 2022 - 2032F
- Norway Water Market Trend Evolution
- Norway Water Market Drivers and Challenges
- Norway Water Price Trends
- Norway Water Porter's Five Forces
- Norway Water Industry Life Cycle
- Historical Data and Forecast of Norway Water Market Revenues & Volume By Type for the Period 2022 - 2032F
- Historical Data and Forecast of Norway Water Market Revenues & Volume By Bottled Water for the Period 2022 - 2032F
- Historical Data and Forecast of Norway Water Market Revenues & Volume By Packaged Water for the Period 2022 - 2032F
- Historical Data and Forecast of Norway Water Market Revenues & Volume By Purified Water for the Period 2022 - 2032F
- Historical Data and Forecast of Norway Water Market Revenues & Volume By Mineral Water for the Period 2022 - 2032F
- Historical Data and Forecast of Norway Water Market Revenues & Volume By Distilled Water for the Period 2022 - 2032F
- Historical Data and Forecast of Norway Water Market Revenues & Volume By Source Type for the Period 2022 - 2032F
- Historical Data and Forecast of Norway Water Market Revenues & Volume By Natural Springs for the Period 2022 - 2032F
- Historical Data and Forecast of Norway Water Market Revenues & Volume By Municipal Supply for the Period 2022 - 2032F
- Historical Data and Forecast of Norway Water Market Revenues & Volume By Reverse Osmosis for the Period 2022 - 2032F
- Historical Data and Forecast of Norway Water Market Revenues & Volume By Underground Wells for the Period 2022 - 2032F
- Historical Data and Forecast of Norway Water Market Revenues & Volume By Steam Distillation for the Period 2022 - 2032F
- Historical Data and Forecast of Norway Water Market Revenues & Volume By End User for the Period 2022 - 2032F
- Historical Data and Forecast of Norway Water Market Revenues & Volume By Consumers for the Period 2022 - 2032F
- Historical Data and Forecast of Norway Water Market Revenues & Volume By Restaurants for the Period 2022 - 2032F
- Historical Data and Forecast of Norway Water Market Revenues & Volume By Hospitals for the Period 2022 - 2032F
- Historical Data and Forecast of Norway Water Market Revenues & Volume By Fitness Centers for the Period 2022 - 2032F
- Historical Data and Forecast of Norway Water Market Revenues & Volume By Laboratories for the Period 2022 - 2032F
- Historical Data and Forecast of Norway Water Market Revenues & Volume By Application for the Period 2022 - 2032F
- Historical Data and Forecast of Norway Water Market Revenues & Volume By Drinking Water for the Period 2022 - 2032F
- Historical Data and Forecast of Norway Water Market Revenues & Volume By Food Preparation for the Period 2022 - 2032F
- Historical Data and Forecast of Norway Water Market Revenues & Volume By Medical Use for the Period 2022 - 2032F
- Historical Data and Forecast of Norway Water Market Revenues & Volume By Hydration for the Period 2022 - 2032F
- Historical Data and Forecast of Norway Water Market Revenues & Volume By Scientific Research for the Period 2022 - 2032F
- Historical Data and Forecast of Norway Water Market Revenues & Volume By End Use for the Period 2022 - 2032F
- Historical Data and Forecast of Norway Water Market Revenues & Volume By Professional Tattooing for the Period 2022 - 2032F
- Historical Data and Forecast of Norway Water Market Revenues & Volume By Tattoo Studios for the Period 2022 - 2032F
- Norway Water Import Export Trade Statistics
- Market Opportunity Assessment By Type
- Market Opportunity Assessment By Source Type
- Market Opportunity Assessment By End User
- Market Opportunity Assessment By Application
- Market Opportunity Assessment By End Use
- Norway Water Top Companies Market Share
- Norway Water Competitive Benchmarking By Technical and Operational Parameters
- Norway Water Company Profiles
- Norway Water Key Strategic Recommendations
Frequently Asked Questions About the Market Study (FAQs):
6Wresearch actively monitors the Norway Water Market and publishes its comprehensive annual report, highlighting emerging trends, growth drivers, revenue analysis, and forecast outlook. Our insights help businesses to make data-backed strategic decisions with ongoing market dynamics. Our analysts track relevent industries related to the Norway Water Market, allowing our clients with actionable intelligence and reliable forecasts tailored to emerging regional needs.
Yes, we provide customisation as per your requirements. To learn more, feel free to contact us on sales@6wresearch.com
1 Executive Summary |
2 Introduction |
2.1 Key Highlights of the Report |
2.2 Report Description |
2.3 Market Scope & Segmentation |
2.4 Research Methodology |
2.5 Assumptions |
3 Norway Water Market Overview |
3.1 Norway Country Macro Economic Indicators |
3.2 Norway Water Market Revenues & Volume, 2022 & 2032F |
3.3 Norway Water Market - Industry Life Cycle |
3.4 Norway Water Market - Porter's Five Forces |
3.5 Norway Water Market Revenues & Volume Share, By Type, 2022 & 2032F |
3.6 Norway Water Market Revenues & Volume Share, By Source Type, 2022 & 2032F |
3.7 Norway Water Market Revenues & Volume Share, By End User, 2022 & 2032F |
3.8 Norway Water Market Revenues & Volume Share, By Application, 2022 & 2032F |
4 Norway Water Market Dynamics |
4.1 Impact Analysis |
4.2 Market Drivers |
4.2.1 Increasing awareness about the importance of clean and safe drinking water |
4.2.2 Growing concern for environmental sustainability leading to a shift towards reusable water bottles |
4.2.3 Government initiatives promoting water conservation and efficient water management practices |
4.3 Market Restraints |
4.3.1 High competition from other beverage options like juices, sodas, and energy drinks |
4.3.2 Fluctuating raw material costs affecting production and pricing of bottled water |
4.3.3 Stringent regulations and quality standards impacting the production and distribution processes |
5 Norway Water Market Trends |
6 Norway Water Market, By Types |
6.1 Norway Water Market, By Type |
6.1.1 Overview and Analysis |
6.1.2 Norway Water Market Revenues & Volume, By Type, 2022 - 2032F |
6.1.3 Norway Water Market Revenues & Volume, By Bottled Water, 2022 - 2032F |
6.1.4 Norway Water Market Revenues & Volume, By Packaged Water, 2022 - 2032F |
6.1.5 Norway Water Market Revenues & Volume, By Purified Water, 2022 - 2032F |
6.1.6 Norway Water Market Revenues & Volume, By Mineral Water, 2022 - 2032F |
6.1.7 Norway Water Market Revenues & Volume, By Distilled Water, 2022 - 2032F |
6.2 Norway Water Market, By Source Type |
6.2.1 Overview and Analysis |
6.2.2 Norway Water Market Revenues & Volume, By Natural Springs, 2022 - 2032F |
6.2.3 Norway Water Market Revenues & Volume, By Municipal Supply, 2022 - 2032F |
6.2.4 Norway Water Market Revenues & Volume, By Reverse Osmosis, 2022 - 2032F |
6.2.5 Norway Water Market Revenues & Volume, By Underground Wells, 2022 - 2032F |
6.2.6 Norway Water Market Revenues & Volume, By Steam Distillation, 2022 - 2032F |
6.3 Norway Water Market, By End User |
6.3.1 Overview and Analysis |
6.3.2 Norway Water Market Revenues & Volume, By Consumers, 2022 - 2032F |
6.3.3 Norway Water Market Revenues & Volume, By Restaurants, 2022 - 2032F |
6.3.4 Norway Water Market Revenues & Volume, By Hospitals, 2022 - 2032F |
6.3.5 Norway Water Market Revenues & Volume, By Fitness Centers, 2022 - 2032F |
6.3.6 Norway Water Market Revenues & Volume, By Laboratories, 2022 - 2032F |
6.4 Norway Water Market, By Application |
6.4.1 Overview and Analysis |
6.4.2 Norway Water Market Revenues & Volume, By Drinking Water, 2022 - 2032F |
6.4.3 Norway Water Market Revenues & Volume, By Food Preparation, 2022 - 2032F |
6.4.4 Norway Water Market Revenues & Volume, By Medical Use, 2022 - 2032F |
6.4.5 Norway Water Market Revenues & Volume, By Hydration, 2022 - 2032F |
6.4.6 Norway Water Market Revenues & Volume, By Scientific Research, 2022 - 2032F |
7 Norway Water Market Import-Export Trade Statistics |
7.1 Norway Water Market Export to Major Countries |
7.2 Norway Water Market Imports from Major Countries |
8 Norway Water Market Key Performance Indicators |
8.1 Consumer demand for eco-friendly packaging options |
8.2 Adoption rate of water purification technologies |
8.3 Percentage of households with access to clean and safe drinking water |
9 Norway Water Market - Opportunity Assessment |
9.1 Norway Water Market Opportunity Assessment, By Type, 2022 & 2032F |
9.2 Norway Water Market Opportunity Assessment, By Source Type, 2022 & 2032F |
9.3 Norway Water Market Opportunity Assessment, By End User, 2022 & 2032F |
9.4 Norway Water Market Opportunity Assessment, By Application, 2022 & 2032F |
10 Norway Water Market - Competitive Landscape |
10.1 Norway Water Market Revenue Share, By Companies, 2025 |
10.2 Norway Water Market Competitive Benchmarking, By Operating and Technical Parameters |
11 Company Profiles |
12 Recommendations |
13 Disclaimer |
Global Go To Market Strategy - 2030
Export potential enables firms to identify high-growth global markets with greater confidence by combining advanced trade intelligence with a structured quantitative methodology. The framework analyzes emerging demand trends and country-level import patterns while integrating macroeconomic and trade datasets such as GDP and population forecasts, bilateral import–export flows, tariff structures, elasticity differentials between developed and developing economies, geographic distance, and import demand projections. Using weighted trade values from 2020–2024 as the base period to project country-to-country export potential for 2030, these inputs are operationalized through calculated drivers such as gravity model parameters, tariff impact factors, and projected GDP per-capita growth. Through an analysis of hidden potentials, demand hotspots, and market conditions that are most favorable to success, this method enables firms to focus on target countries, maximize returns, and global expansion with data, backed by accuracy.
By factoring in the projected importer demand gap that is currently unmet and could be potential opportunity, it identifies the potential for the Exporter (Country) among 190 countries, against the general trade analysis, which identifies the biggest importer or exporter.
To discover high-growth global markets and optimize your business strategy:
Click Here
Pricing
- Single User License$ 1,995
- Department License$ 2,400
- Site License$ 3,120
- Global License$ 3,795

Leadership Perspectives from Industry Events
Search
Thought Leadership and Analyst Meet


Our Clients
6WResearch In News
- Doha a strategic location for EV manufacturing hub: IPA Qatar
- Demand for luxury TVs surging in the GCC, says Samsung
- Empowering Growth: The Thriving Journey of Bangladesh’s Cable Industry
- Demand for luxury TVs surging in the GCC, says Samsung
- Video call with a traditional healer? Once unthinkable, it’s now common in South Africa
- Intelligent Buildings To Smooth GCC’s Path To Net Zero
Latest Reports
- Taiwan Windshield Projection Systems Market (2026-2032)
- Vietnam Windshield Projection Systems Market (2026-2032)
- Thailand Windshield Projection Systems Market (2026-2032)
- South Korea Windshield Projection Systems Market (2026-2032)
- Romania Windshield Projection Systems Market (2026-2032)
- Qatar Windshield Projection Systems Market (2026-2032)
- Philippines Windshield Projection Systems Market (2026-2032)
- Japan Windshield Projection Systems Market (2026-2032)
- Taiwan Windshield Projection Display Market (2026-2032)
- Vietnam Windshield Projection Display Market (2026-2032)
Industry Events and Analyst Meet

HIMTEX 2026

India Refining Summit 2026

India EV Show 2026

EV tech India Expo 2026

Auto Tech Asia 2026
Whitepaper
- Middle East & Africa Commercial Security Market Click here to view more.
- Middle East & Africa Fire Safety Systems & Equipment Market Click here to view more.
- GCC Drone Market Click here to view more.
- Middle East Lighting Fixture Market Click here to view more.
- GCC Physical & Perimeter Security Market Click here to view more.