Oman Chemotherapy Market (2026-2032) | Value, Size, Revenue, Analysis, Forecast, Companies, Growth, Share, Industry, Outlook & Trends
Market Forecast By Drug Class (Alkylating Agents, Mitotic Inhibitors, Antimetabolites, Topoisomerase Inhibitors, Antitumor Antibiotic), By Indication (Lung Cancer, Breast Cancer, Colorectal Cancer, Prostate Cancer, Stomach Cancer, Lymphoma, Leukemia, Ovarian Cancer), By Route of Drug Administration (Intravenous, Oral, Subcutaneous, Intra-Muscular, Intravesicular, Topical, Intraperitoneal, Intraventricular/Intrathecal), By End-Users (Specialty Centers, Hospitals & Clinics) And Competitive Landscape
| Product Code: ETC044963 | Publication Date: Jan 2021 | Updated Date: Jun 2026 | Product Type: Report | |
| Publisher: 6Wresearch | Author: Sachin Kumar Rai | No. of Pages: 70 | No. of Figures: 35 | No. of Tables: 5 |
Oman Chemotherapy Market Summary
The oman chemotherapy market was estimated at USD 477 Million in 2025 and is projected to reach USD 643 Million by 2032, growing at a CAGR of 5.3% from 2026 to 2032.
Oman Chemotherapy Market Growth Rate Analysis (2021-2032)
The Oman chemotherapy market is experiencing a stable growth pattern, with an average yearly increase of around 5.3% from 2021 through 2024. This upward trend is attributed to rising cancer prevalence and heightened consumer demand for advanced oncological treatments. Notably, a slight decline to 4.9% in 2023 can be linked to temporary supply chain disruptions and regulatory changes. However, the market rebounds with a 5.4% growth forecast for 2024, fueled by increased investments in healthcare infrastructure and the adoption of innovative treatment technologies. By 2032, growth is expected to stabilize around 5.2%, as industry players adapt to evolving healthcare policies and focus on enhancing patient access to chemotherapy services.
Oman Chemotherapy Market Year-wise Growth Rate and Key Drivers
This graph highlights how the Oman Chemotherapy Market has steadily grown over the past five years, supported by major growth factors.
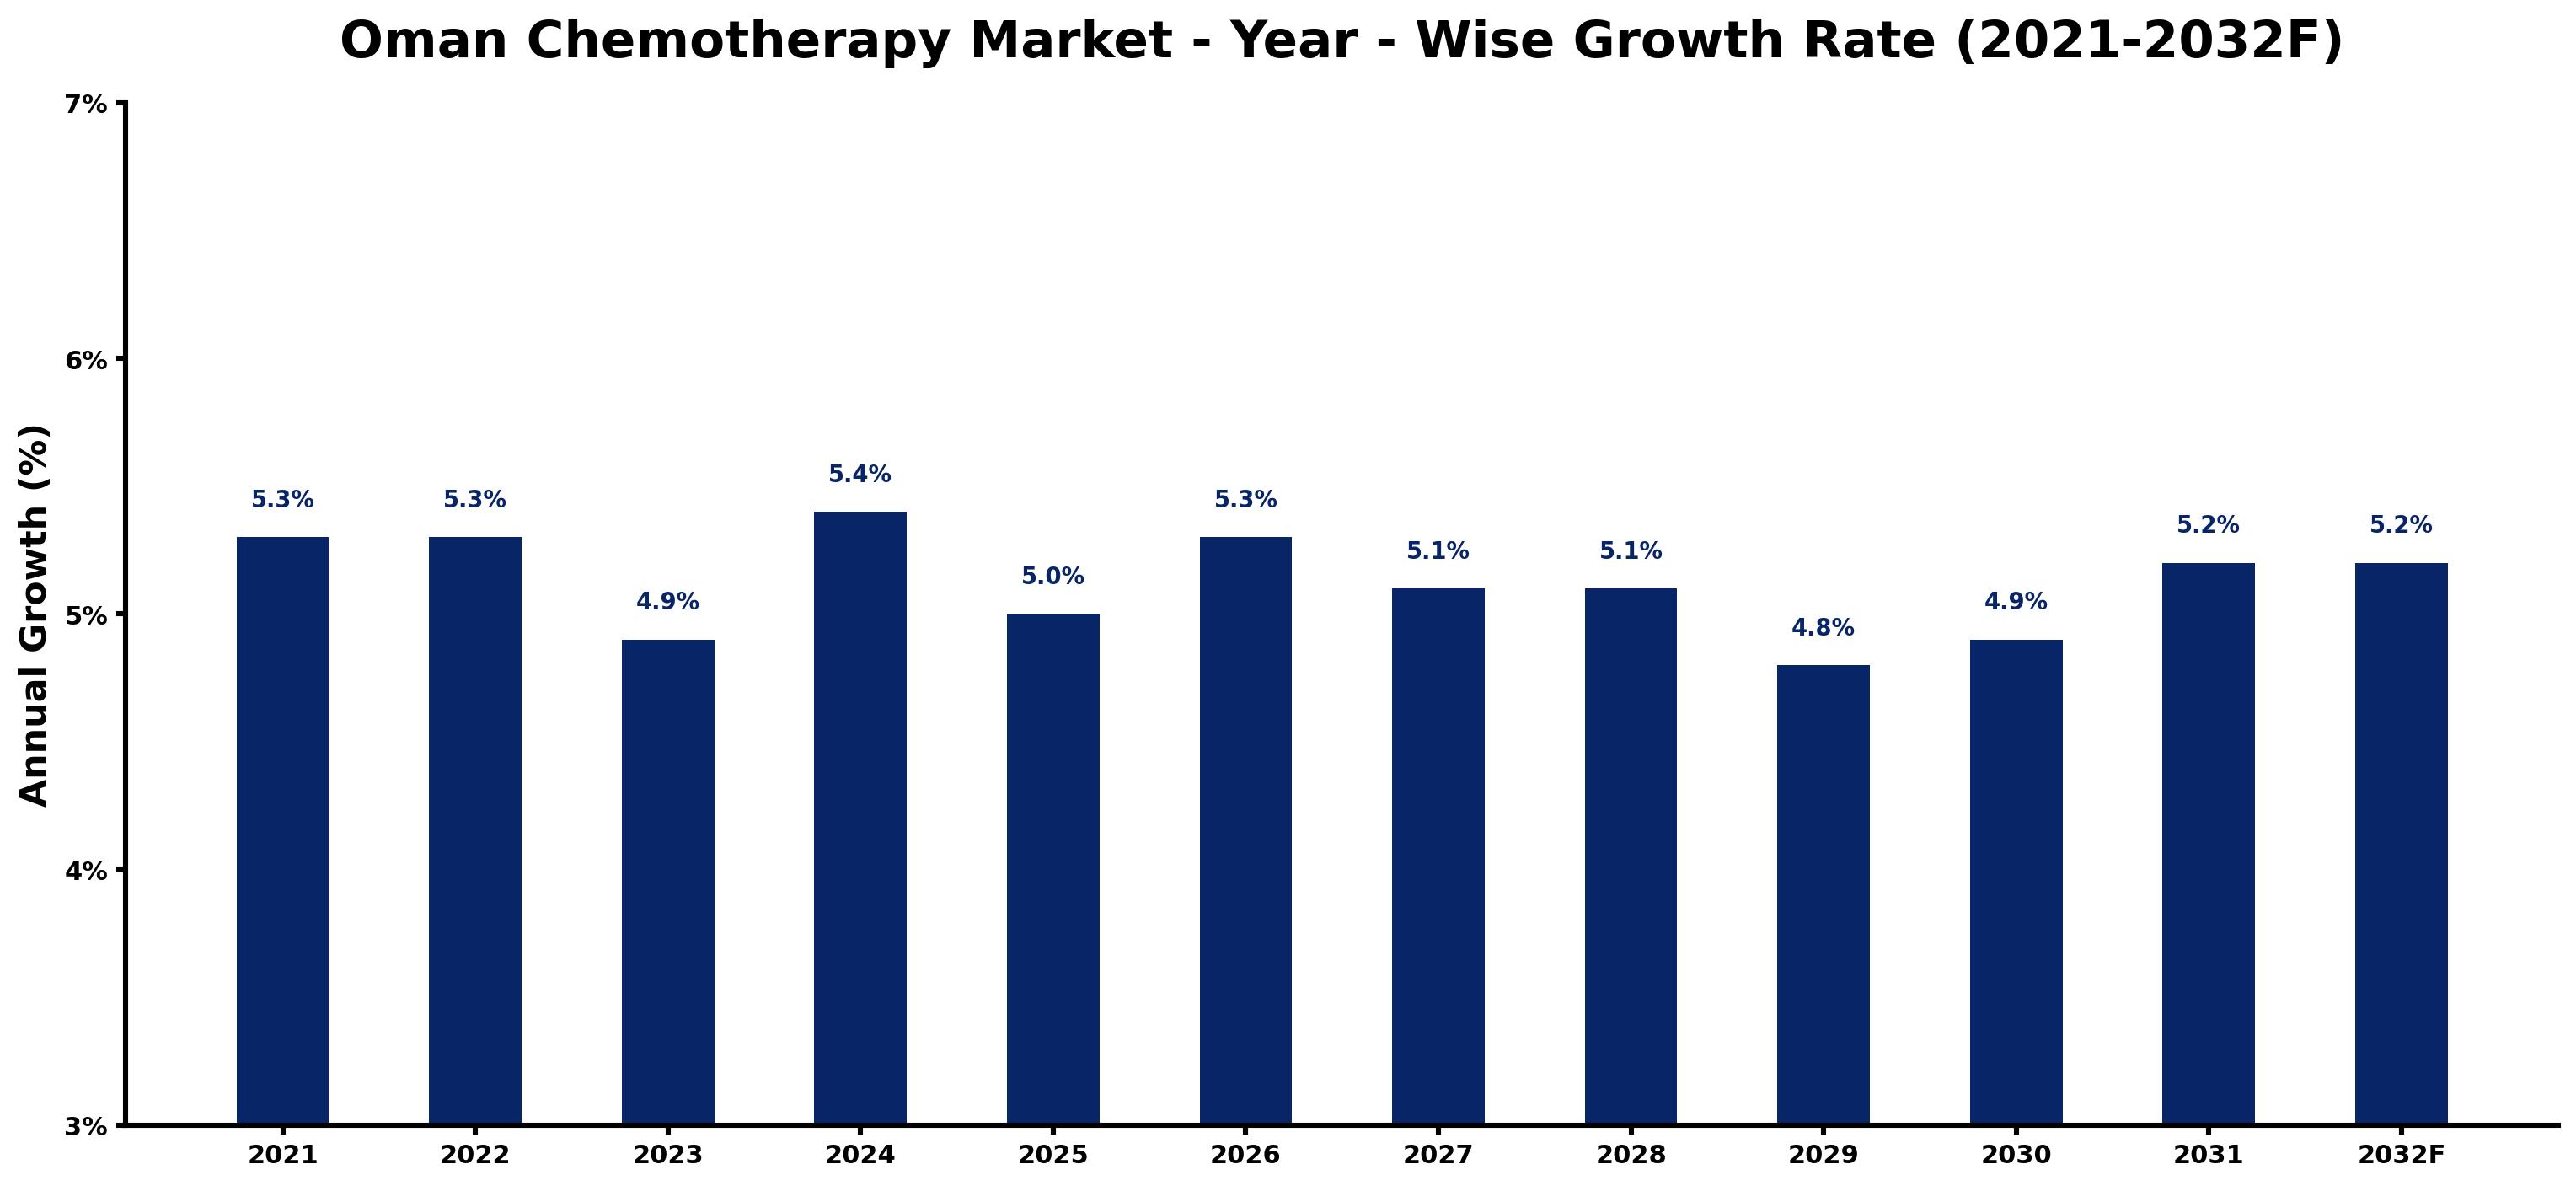
The table below presents the year wise growth rates along with the key drivers influencing the market
| Year | Growth Rate | Major Drivers |
| 2021 | 5.3% | The awareness of cancer treatments in Oman has notably increased, influencing patient choices. |
| 2022 | 5.3% | Healthcare facilities increasingly incorporate advanced chemotherapy options for better patient outcomes. |
| 2023 | 4.9% | Partnerships with global pharma companies enhance access to innovative treatment protocols locally. |
| 2024 | 5.4% | Physician referrals to specialized oncology centers have grown significantly in recent years. |
| 2025 | 5.0% | Oman's aging population correlates with a higher incidence of cancer diagnoses and treatments. |
| 2026 | 5.3% | Investment in biopharmaceuticals fosters local production of chemotherapy drugs within Oman. |
| 2027 | 5.1% | Public health campaigns raise awareness, reducing stigma and encouraging early treatment access. |
| 2028 | 5.1% | Telehealth services expand, making oncology consultations more accessible to rural populations. |
| 2029 | 4.8% | Emerging clinical trials attract international researchers, enhancing local treatment options significantly. |
| 2030 | 4.9% | Insurance coverage expansions improve financial access to oncology treatments for Omani families. |
| 2031 | 5.2% | Integration of holistic approaches alongside chemotherapy improves patient satisfaction and outcomes. |
| 2032 | 5.2% | Local universities enhance oncology research programs, contributing to innovative treatment methodologies. |
Note - Market size estimations and growth projections presented in this report are based on 6Wresearch's advanced forecasting approach, validated with industry datasets as of June 2026.
Oman Chemotherapy Market Synopsis
The Oman Chemotherapy Market is projected to reach 5.3% and witness significant growth during the forecast period (2026-2032). This expansion is attributed to the rising incidence of cancer cases in Oman, where chemotherapy remains a cornerstone of cancer treatment. Various types of cancers predominantly treated with chemotherapy include breast, lung, and colorectal cancer, underscoring the necessity for diverse therapeutic options. The market landscape comprises a wide array of chemotherapy drugs, both branded and generic, reflecting the competitive dynamics and increasing accessibility for patients.
Oman Chemotherapy Market Growth Drivers
The growth of the Oman Chemotherapy Market is propelled by several key factors:
- Increased prevalence of cancer, largely driven by lifestyle changes and an aging population, necessitates effective treatment options.
- Government initiatives aimed at enhancing cancer care infrastructure contribute to improved healthcare services and patient access to chemotherapy.
- Technological advancements in chemotherapy, including the development of novel drug formulations and delivery mechanisms, drive market innovation.
- Rising public awareness about cancer treatment options and the importance of early detection further supports market expansion.
- Collaboration between public health agencies and private sectors encourages investment in oncology services, boosting treatment availability.
Oman Chemotherapy Market Trends and Opportunities
The market is witnessing a number of noteworthy trends that reflect shifts in treatment preferences and healthcare approaches:
- There is an increasing demand for targeted therapies that cater to the unique genetic profiles of patients, improving treatment efficacy.
- Advancements in immunotherapy are gaining traction, providing alternative options alongside traditional chemotherapy.
- Oral chemotherapy medications are being preferred over intravenous treatments due to their convenience for patients.
- Combination therapies are emerging as a trend, designed to enhance effectiveness while reducing side effects associated with single-agent therapies.
- Investment in research and development is being prioritized to address unmet medical needs and innovate treatment solutions, which aligns with global healthcare trends.
Oman Chemotherapy Market Challenges and Restraints
Despite its growth potential, the Oman Chemotherapy Market faces several challenges that could hinder its progress:
- High costs associated with chemotherapy treatments may limit patient access, particularly for those without adequate health insurance.
- Lack of skilled healthcare professionals in oncology creates gaps in treatment availability and patient care quality.
- Limited access to advanced chemotherapy drugs may affect treatment options available to oncologists and their patients.
- Inadequate healthcare infrastructure, including insufficient facilities and equipment, poses challenges to effective service delivery.
- A shortage of comprehensive cancer registries and data collection systems restricts research efforts and complicates targeted treatment strategies.
Oman Chemotherapy Market Investment Opportunities
The Oman Chemotherapy Market offers significant investment opportunities, fueled by the rising demand for cancer treatments:
- The increasing prevalence of cancer creates a consistent need for innovative chemotherapy options, attracting interest from investors.
- Opportunities in pharmaceutical sectors specializing in oncology drugs are promising due to the growing market demand.
- Investments in healthcare facilities providing chemotherapy services can yield long-term returns as treatment needs escalate.
- Exploring partnerships with local healthcare providers can enhance market penetration and improve service delivery.
- Participating in government initiatives aimed at improving cancer care infrastructure presents potential avenues for investment.
Oman Chemotherapy Market Government Investment and Initiatives
Government policies in Oman significantly influence the Chemotherapy Market, focusing on enhancing access to affordable cancer treatment:
The Ministry of Health plays a pivotal role in regulating chemotherapy drug importation and distribution while overseeing the accreditation of healthcare facilities involved in cancer care. Initiatives aimed at public health education emphasize early cancer detection and the importance of treatment adherence. Additionally, efforts to improve training programs for healthcare professionals in oncology are underway, aimed at elevating the standard of care across the nation. These government-led strategies align with overall goals to ensure that citizens receive effective and quality cancer treatment, signifying a proactive approach to public health.
Oman Chemotherapy Market Latest Developments (May 2025 - June 2026)
During the period from May 2025 to June 2026, the Oman Chemotherapy Market has seen various industry developments reflecting broader trends in healthcare. There has been an uptick in collaborative efforts between private and public sectors aimed at enhancing cancer care services. Efforts focus on the integration of advanced technologies and practices in chemotherapy treatment, aligning with global health advancements. Awareness campaigns led by government bodies have improved public knowledge regarding cancer risks and treatment options. Innovations in drug formulations and delivery methods have been gradually adopted, promising to enhance patient outcomes and treatment experiences. The emphasis on precision medicine and individualized treatment plans continues to shape the market dynamics, catering to the growing demand for tailored therapies.
Oman Chemotherapy Market - Key Attractiveness of the Report
- 10 Years of Market Numbers
- Historical Data Starting from 2022 to 2025
- Base Year: 2025
- Forecast Data until 2032
- Key Performance Indicators Impacting the Market
- Major Upcoming Developments and Projects
Key Highlights of the Report:
- Oman Chemotherapy? Market Outlook
- Market Size of Oman Chemotherapy? Market, 2025
- Forecast of Oman Chemotherapy? Market, 2032
- Historical Data and Forecast of Oman Chemotherapy? Revenues & Volume for the Period 2022-2032F
- Oman Chemotherapy? Market Trend Evolution
- Oman Chemotherapy? Market Drivers and Challenges
- Oman Chemotherapy? Price Trends
- Oman Chemotherapy? Porter's Five Forces
- Oman Chemotherapy? Industry Life Cycle
- Historical Data and Forecast of Oman Chemotherapy? Market Revenues & Volume By Drug Class for the Period 2022-2032F
- Historical Data and Forecast of Oman Chemotherapy? Market Revenues & Volume By Alkylating Agents for the Period 2022-2032F
- Historical Data and Forecast of Oman Chemotherapy? Market Revenues & Volume By Mitotic Inhibitors for the Period 2022-2032F
- Historical Data and Forecast of Oman Chemotherapy? Market Revenues & Volume By Antimetabolites for the Period 2022-2032F
- Historical Data and Forecast of Oman Chemotherapy? Market Revenues & Volume By Topoisomerase Inhibitors for the Period 2022-2032F
- Historical Data and Forecast of Oman Chemotherapy? Market Revenues & Volume By Antitumor Antibiotic for the Period 2022-2032F
- Historical Data and Forecast of Oman Chemotherapy? Market Revenues & Volume By Indication for the Period 2022-2032F
- Historical Data and Forecast of Oman Chemotherapy? Market Revenues & Volume By Lung Cancer for the Period 2022-2032F
- Historical Data and Forecast of Oman Chemotherapy? Market Revenues & Volume By Breast Cancer for the Period 2022-2032F
- Historical Data and Forecast of Oman Chemotherapy? Market Revenues & Volume By Colorectal Cancer for the Period 2022-2032F
- Historical Data and Forecast of Oman Chemotherapy? Market Revenues & Volume By Prostate Cancer for the Period 2022-2032F
- Historical Data and Forecast of Oman Chemotherapy? Market Revenues & Volume By Stomach Cancer for the Period 2022-2032F
- Historical Data and Forecast of Oman Chemotherapy? Market Revenues & Volume By Lymphoma for the Period 2022-2032F
- Historical Data and Forecast of Oman Chemotherapy? Market Revenues & Volume By Leukemia for the Period 2022-2032F
- Historical Data and Forecast of Oman Chemotherapy? Market Revenues & Volume By Ovarian Cancer for the Period 2022-2032F
- Historical Data and Forecast of Oman Chemotherapy? Market Revenues & Volume By Route of Drug Administration for the Period 2022-2032F
- Historical Data and Forecast of Oman Chemotherapy? Market Revenues & Volume By Intravenous for the Period 2022-2032F
- Historical Data and Forecast of Oman Chemotherapy? Market Revenues & Volume By Oral for the Period 2022-2032F
- Historical Data and Forecast of Oman Chemotherapy? Market Revenues & Volume By Subcutaneous for the Period 2022-2032F
- Historical Data and Forecast of Oman Chemotherapy? Market Revenues & Volume By Intra-Muscular for the Period 2022-2032F
- Historical Data and Forecast of Oman Chemotherapy? Market Revenues & Volume By Intravesicular for the Period 2022-2032F
- Historical Data and Forecast of Oman Chemotherapy? Market Revenues & Volume By Topical for the Period 2022-2032F
- Historical Data and Forecast of Oman Chemotherapy? Market Revenues & Volume By Intraperitoneal for the Period 2022-2032F
- Historical Data and Forecast of Oman Chemotherapy? Market Revenues & Volume By Intraventricular/Intrathecal for the Period 2022-2032F
- Historical Data and Forecast of Oman Chemotherapy? Market Revenues & Volume By End-Users for the Period 2022-2032F
- Historical Data and Forecast of Oman Chemotherapy? Market Revenues & Volume By Specialty Centers for the Period 2022-2032F
- Historical Data and Forecast of Oman Chemotherapy? Market Revenues & Volume By Hospitals & Clinics for the Period 2022-2032F
- Oman Chemotherapy? Import Export Trade Statistics
- Market Opportunity Assessment By Drug Class
- Market Opportunity Assessment By Indication
- Market Opportunity Assessment By Route of Drug Administration
- Market Opportunity Assessment By End-Users
- Oman Chemotherapy? Top Companies Market Share
- Oman Chemotherapy? Competitive Benchmarking By Technical and Operational Parameters
- Oman Chemotherapy? Company Profiles
- Oman Chemotherapy? Key Strategic Recommendations
Frequently Asked Questions About the Market Study (FAQs):
The primary drivers include the increasing prevalence of cancer, government initiatives to improve healthcare access, advancements in treatment technologies, growing awareness of cancer treatment options, and rising investments in oncology services.
Key challenges include high treatment costs, limited access to advanced drugs, a shortage of trained oncology professionals, inadequate healthcare infrastructure, and a lack of comprehensive data collection systems.
Investors can look into pharmaceutical companies focusing on oncology, healthcare facilities providing chemotherapy, partnerships with local providers, and participation in government initiatives aimed at enhancing cancer care.
The government supports the market through policies that ensure affordable access to treatment, regulate healthcare facilities, and promote public awareness on cancer, alongside enhancing training programs for healthcare professionals.
6Wresearch actively monitors the Oman Chemotherapy Market and publishes its comprehensive annual report, highlighting emerging trends, growth drivers, revenue analysis, and forecast outlook. Our insights help businesses to make data-backed strategic decisions with ongoing market dynamics. Our analysts track relevent industries related to the Oman Chemotherapy Market, allowing our clients with actionable intelligence and reliable forecasts tailored to emerging regional needs.
Yes, we provide customisation as per your requirements. To learn more, feel free to contact us on sales@6wresearch.com
1 Executive Summary |
2 Introduction |
2.1 Key Highlights of the Report |
2.2 Report Description |
2.3 Market Scope & Segmentation |
2.4 Research Methodology |
2.5 Assumptions |
3 Oman Chemotherapy Market Overview |
3.1 Oman Country Macro Economic Indicators |
3.2 Oman Chemotherapy Market Revenues & Volume, 2022 & 2032F |
3.3 Oman Chemotherapy Market - Industry Life Cycle |
3.4 Oman Chemotherapy Market - Porter's Five Forces |
3.5 Oman Chemotherapy Market Revenues & Volume Share, By Drug Class, 2022 & 2032F |
3.6 Oman Chemotherapy Market Revenues & Volume Share, By Indication, 2022 & 2032F |
3.7 Oman Chemotherapy Market Revenues & Volume Share, By Route of Drug Administration, 2022 & 2032F |
3.8 Oman Chemotherapy Market Revenues & Volume Share, By End-Users, 2022 & 2032F |
4 Oman Chemotherapy Market Dynamics |
4.1 Impact Analysis |
4.2 Market Drivers |
4.3 Market Restraints |
5 Oman Chemotherapy Market Trends |
6 Oman Chemotherapy Market, By Types |
6.1 Oman Chemotherapy Market, By Drug Class |
6.1.1 Overview and Analysis |
6.1.2 Oman Chemotherapy Market Revenues & Volume, By Drug Class, 2022-2032F |
6.1.3 Oman Chemotherapy Market Revenues & Volume, By Alkylating Agents, 2022-2032F |
6.1.4 Oman Chemotherapy Market Revenues & Volume, By Mitotic Inhibitors, 2022-2032F |
6.1.5 Oman Chemotherapy Market Revenues & Volume, By Antimetabolites, 2022-2032F |
6.1.6 Oman Chemotherapy Market Revenues & Volume, By Topoisomerase Inhibitors, 2022-2032F |
6.1.7 Oman Chemotherapy Market Revenues & Volume, By Antitumor Antibiotic, 2022-2032F |
6.2 Oman Chemotherapy Market, By Indication |
6.2.1 Overview and Analysis |
6.2.2 Oman Chemotherapy Market Revenues & Volume, By Lung Cancer, 2022-2032F |
6.2.3 Oman Chemotherapy Market Revenues & Volume, By Breast Cancer, 2022-2032F |
6.2.4 Oman Chemotherapy Market Revenues & Volume, By Colorectal Cancer, 2022-2032F |
6.2.5 Oman Chemotherapy Market Revenues & Volume, By Prostate Cancer, 2022-2032F |
6.2.6 Oman Chemotherapy Market Revenues & Volume, By Stomach Cancer, 2022-2032F |
6.2.7 Oman Chemotherapy Market Revenues & Volume, By Lymphoma, 2022-2032F |
6.2.8 Oman Chemotherapy Market Revenues & Volume, By Ovarian Cancer, 2022-2032F |
6.2.9 Oman Chemotherapy Market Revenues & Volume, By Ovarian Cancer, 2022-2032F |
6.3 Oman Chemotherapy Market, By Route of Drug Administration |
6.3.1 Overview and Analysis |
6.3.2 Oman Chemotherapy Market Revenues & Volume, By Intravenous, 2022-2032F |
6.3.3 Oman Chemotherapy Market Revenues & Volume, By Oral, 2022-2032F |
6.3.4 Oman Chemotherapy Market Revenues & Volume, By Subcutaneous, 2022-2032F |
6.3.5 Oman Chemotherapy Market Revenues & Volume, By Intra-Muscular, 2022-2032F |
6.3.6 Oman Chemotherapy Market Revenues & Volume, By Intravesicular, 2022-2032F |
6.3.7 Oman Chemotherapy Market Revenues & Volume, By Topical, 2022-2032F |
6.3.8 Oman Chemotherapy Market Revenues & Volume, By Intraventricular/Intrathecal, 2022-2032F |
6.3.9 Oman Chemotherapy Market Revenues & Volume, By Intraventricular/Intrathecal, 2022-2032F |
6.4 Oman Chemotherapy Market, By End-Users |
6.4.1 Overview and Analysis |
6.4.2 Oman Chemotherapy Market Revenues & Volume, By Specialty Centers, 2022-2032F |
6.4.3 Oman Chemotherapy Market Revenues & Volume, By Hospitals & Clinics, 2022-2032F |
7 Oman Chemotherapy Market Import-Export Trade Statistics |
7.1 Oman Chemotherapy Market Export to Major Countries |
7.2 Oman Chemotherapy Market Imports from Major Countries |
8 Oman Chemotherapy Market Key Performance Indicators |
9 Oman Chemotherapy Market - Opportunity Assessment |
9.1 Oman Chemotherapy Market Opportunity Assessment, By Drug Class, 2022 & 2032F |
9.2 Oman Chemotherapy Market Opportunity Assessment, By Indication, 2022 & 2032F |
9.3 Oman Chemotherapy Market Opportunity Assessment, By Route of Drug Administration, 2022 & 2032F |
9.4 Oman Chemotherapy Market Opportunity Assessment, By End-Users, 2022 & 2032F |
10 Oman Chemotherapy Market - Competitive Landscape |
10.1 Oman Chemotherapy Market Revenue Share, By Companies, 2025 |
10.2 Oman Chemotherapy Market Competitive Benchmarking, By Operating and Technical Parameters |
11 Company Profiles |
12 Recommendations |
13 Disclaimer |
Global Go To Market Strategy - 2030
Export potential enables firms to identify high-growth global markets with greater confidence by combining advanced trade intelligence with a structured quantitative methodology. The framework analyzes emerging demand trends and country-level import patterns while integrating macroeconomic and trade datasets such as GDP and population forecasts, bilateral import–export flows, tariff structures, elasticity differentials between developed and developing economies, geographic distance, and import demand projections. Using weighted trade values from 2020–2024 as the base period to project country-to-country export potential for 2030, these inputs are operationalized through calculated drivers such as gravity model parameters, tariff impact factors, and projected GDP per-capita growth. Through an analysis of hidden potentials, demand hotspots, and market conditions that are most favorable to success, this method enables firms to focus on target countries, maximize returns, and global expansion with data, backed by accuracy.
By factoring in the projected importer demand gap that is currently unmet and could be potential opportunity, it identifies the potential for the Exporter (Country) among 190 countries, against the general trade analysis, which identifies the biggest importer or exporter.
To discover high-growth global markets and optimize your business strategy:
Click Here
Pricing
- Single User License$ 1,995
- Department License$ 2,400
- Site License$ 3,120
- Global License$ 3,795

Leadership Perspectives from Industry Events
Search
Thought Leadership and Analyst Meet


Our Clients
6WResearch In News
- India Air Conditioner Market Set for Strong Rebound in 2026 After Weather-Led Correction and GST-Driven Recovery: 6Wresearch
- ADAS in India: How Automatic Emergency Braking, Blind Spot Detection & Driver Monitoring are Transforming Road Safety
- Doha a strategic location for EV manufacturing hub: IPA Qatar
- Demand for luxury TVs surging in the GCC, says Samsung
- Empowering Growth: The Thriving Journey of Bangladesh’s Cable Industry
- Demand for luxury TVs surging in the GCC, says Samsung
Latest Reports
- Poland Fire Protection Systems Market (2026-2032)
- Cape Verde Portable Hand-Thrown Extinguisher Market (2026-2032)
- Canada Portable Hand-Thrown Extinguisher Market (2026-2032)
- Cameroon Portable Hand-Thrown Extinguisher Market (2026-2032)
- Burundi Portable Hand-Thrown Extinguisher Market (2026-2032)
- Burkina Faso Portable Hand-Thrown Extinguisher Market (2026-2032)
- Bulgaria Portable Hand-Thrown Extinguisher Market (2026-2032)
- Brunei Portable Hand-Thrown Extinguisher Market (2026-2032)
- Botswana Portable Hand-Thrown Extinguisher Market (2026-2032)
- Bosnia and Herzegovina Portable Hand-Thrown Extinguisher Market (2026-2032)
Industry Events and Analyst Meet

HIMTEX 2026

India Refining Summit 2026

India EV Show 2026

EV tech India Expo 2026

Auto Tech Asia 2026
Whitepaper
- Middle East & Africa Commercial Security Market Click here to view more.
- Middle East & Africa Fire Safety Systems & Equipment Market Click here to view more.
- GCC Drone Market Click here to view more.
- Middle East Lighting Fixture Market Click here to view more.
- GCC Physical & Perimeter Security Market Click here to view more.