Oman Tables Market (2026-2032) | Share, Size, Trends, Companies, Outlook, Forecast, Growth, Industry, Value, Analysis, Revenue
Market Forecast By Types (Fabric, Leather, Metal, Wooden, Others), By Applications (Family, Office, Others) And Competitive Landscape
| Product Code: ETC034683 | Publication Date: Oct 2020 | Updated Date: Jun 2026 | Product Type: Report | |
| Publisher: 6Wresearch | Author: Sachin Kumar Rai | No. of Pages: 70 | No. of Figures: 35 | No. of Tables: 5 |
Oman Tables Market Summary
The oman tables market was estimated at USD 1103 Million in 2025 and is projected to reach USD 1595 Million by 2032, growing at a CAGR of 6.6% from 2026 to 2032.
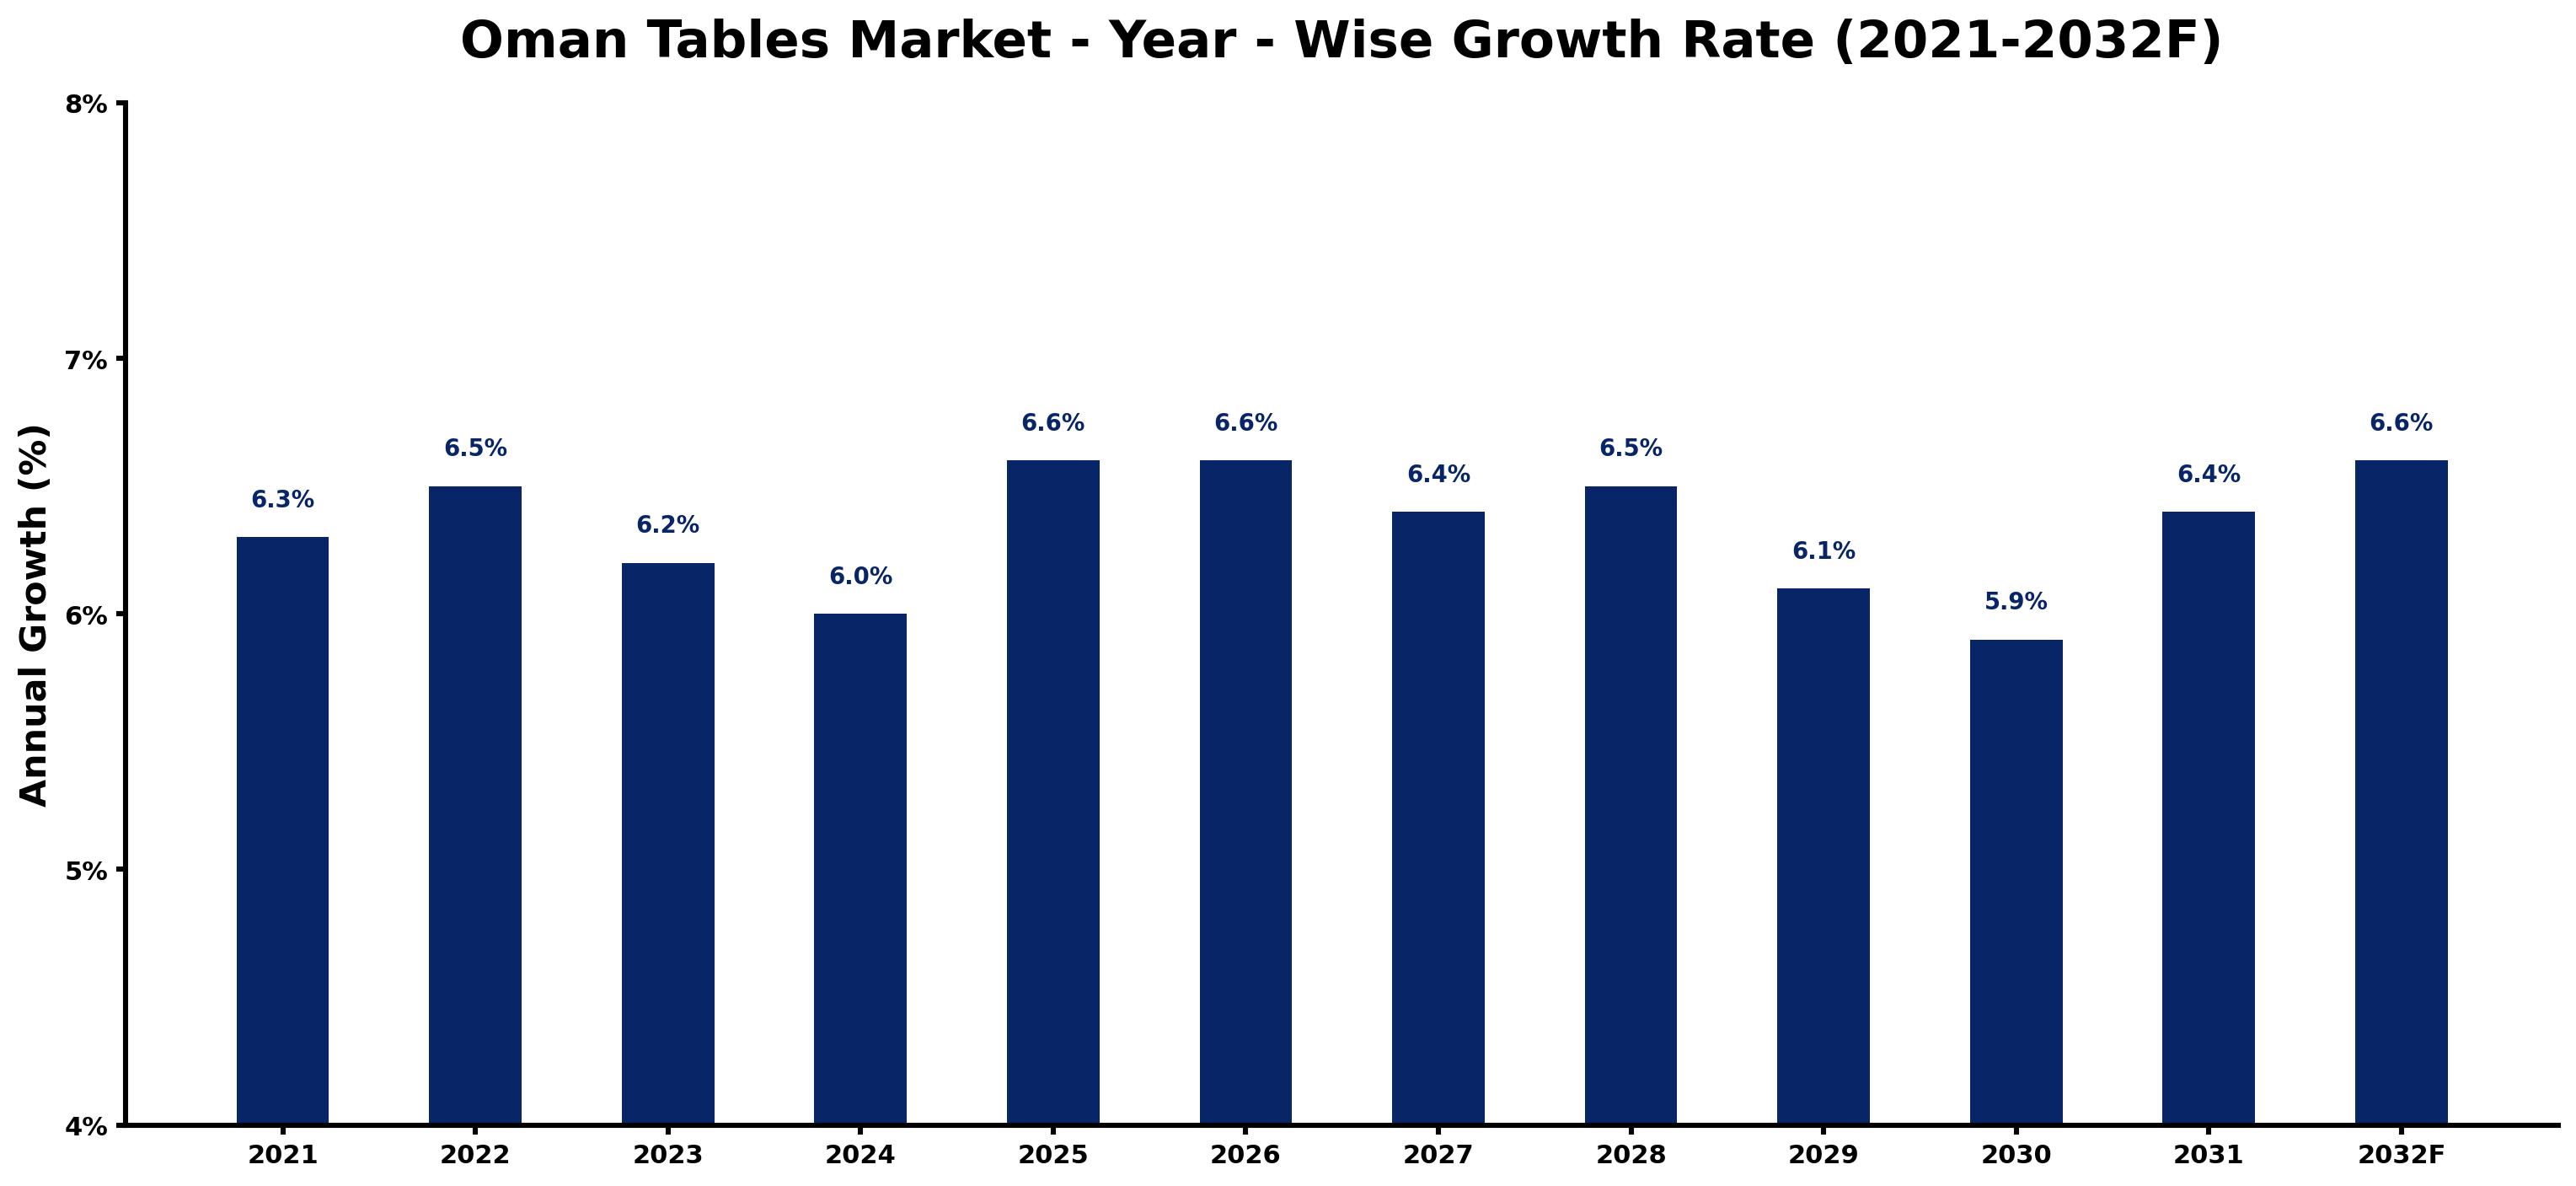
Oman Tables Market Growth Rate Analysis (2021-2032)
The Oman Tables market has experienced stable growth, with annual increases ranging from 6.0% to 6.6% over the period from 2021 to 2032. In 2021, growth was recorded at 6.3%, escalating to 6.5% in 2022 due to rising consumer demand and investments in innovative designs that appealed to both residential and commercial sectors. However, a slight decline to 6.2% in 2023 can be attributed to global supply chain disruptions and fluctuating material costs. Nevertheless, recovery is anticipated from 2024, with a projected growth rate of 6.6% in 2025, driven by robust infrastructure developments and an increasing emphasis on sustainable materials in response to energy transition initiatives.
Oman Tables Market Year-wise Growth Rate and Key Drivers
This graph highlights how the Oman Tables Market has steadily grown over the past five years, supported by major growth factors.
The table below presents the year wise growth rates along with the key drivers influencing the market
| Year | Growth Rate | Major Drivers |
| 2021 | 6.3% | Oman's economy began recovering, boosting consumer spending on home furnishings including tables. |
| 2022 | 6.5% | Increased urbanization in Muscat led to higher demand for functional living spaces. |
| 2023 | 6.2% | The construction sector's expansion created more housing developments needing stylish furniture solutions. |
| 2024 | 6.0% | Emerging trends in interior design emphasized minimalist and multifunctional furniture pieces. |
| 2025 | 6.6% | The influx of expatriates contributed to a growing appetite for diverse table designs. |
| 2026 | 6.6% | Sustainable materials gained traction, influencing consumer preferences toward eco-friendly table options. |
| 2027 | 6.4% | E-commerce platforms provided wider access to unique table designs, fostering market competition. |
| 2028 | 6.5% | Cultural events and festivals highlighted local craftsmanship, boosting traditional table sales. |
| 2029 | 6.1% | Rising disposable incomes encouraged investment in premium and luxury furniture items. |
| 2030 | 5.9% | Collaborations between local artisans and international brands elevated design innovation in tables. |
| 2031 | 6.4% | Health-conscious consumers drove demand for ergonomic and adaptive table solutions. |
| 2032 | 6.6% | Smart home technology integration began to redefine functionality and appeal of dining tables. |
Note - Market size estimations and growth projections presented in this report are based on 6Wresearch's advanced forecasting approach, validated with industry datasets as of June 2026.
Oman Tables Market Synopsis
The Oman Tables Market is projected to reach 6.6% and witness significant growth during the forecast period (2026-2032). This growth is primarily driven by factors such as increasing urbanization, rising disposable income, and evolving consumer preferences that tilt towards stylish and functional furniture. The market encompasses a diverse array of tables, including dining tables, coffee tables, side tables, and study tables, all of which cater to the varied needs of consumers. Wood remains the dominant material in table manufacturing due to its combination of durability and aesthetic appeal, although there is a notable rise in demand for eco-friendly and sustainable options.
Oman Tables Market Growth Drivers
The ongoing expansion of the Oman Tables Market can be attributed to several key growth drivers:
- The urbanization trend in Oman is propelling demand for stylish and space-efficient furniture, as urban residents seek to optimize their living environments.
- Increased disposable income levels are allowing consumers to invest in high-quality and aesthetically pleasing table designs, reflecting a growing focus on home decor.
- Changing consumer preferences towards multifunctional and versatile furniture are creating opportunities for innovative table designs catering to modern lifestyles.
- The growing emphasis on sustainable living is pushing consumers to prioritize tables made from eco-friendly materials, contributing to market growth.
- With an expanding tourism sector, there is heightened demand for tables in hospitality venues, which further fuels the overall market for quality furniture.
Oman Tables Market Trends and Opportunities
The Oman Tables Market is witnessing notable trends that present opportunities for growth:
- There is a rising preference for multifunctional furniture solutions, such as extendable dining tables that maximize space while providing versatility.
- Consumers are increasingly gravitating towards sustainable and durable materials, which presents an opportunity for manufacturers to innovate with eco-friendly options.
- Design aesthetics are shifting towards a fusion of traditional craftsmanship with modern design elements, appealing to a broad range of consumer tastes.
- Online sales channels are becoming more significant, enabling furniture retailers to reach a wider audience and adapt to changing shopping behaviors.
- Investment in product customization options is growing, allowing consumers to tailor furniture to their specific preferences and style, enhancing customer satisfaction.
Oman Tables Market Challenges and Restraints
While the Oman Tables Market presents various opportunities, there are challenges and restraints that market players must navigate:
- Intense competition among both local and international brands creates pressure to maintain quality and affordable pricing strategies.
- Fluctuating raw material prices can significantly impact production costs, requiring companies to manage their supply chains effectively.
- Changes in consumer preferences towards modern designs necessitate continuous innovation, posing challenges for manufacturers to stay relevant.
- Economic uncertainties and fluctuations in the real estate sector can influence overall furniture demand, including tables.
- The need for traditional retail outlets to adapt to digital marketing trends and expand their distribution channels can be a significant hurdle.
Oman Tables Market Government Investment and Initiatives
Government policies in Oman are increasingly focused on enhancing the local furniture manufacturing sector, including the tables market. Initiatives aimed at promoting local production and supporting small and medium-sized enterprises (SMEs) are particularly noteworthy. The government provides various incentives to encourage domestic manufacturing, ensuring that quality standards and safety measures are persistently met in the furniture industry.
Furthermore, there is a concerted emphasis on sustainable practices, including the use of eco-friendly materials, which aligns with global environmental standards. Policies aimed at bolstering the local tables market are expected to create employment opportunities and enhance the competitiveness of Omani manufacturers within both domestic and international boundaries.
Oman Tables Market Latest Developments (May 2025 - June 2026)
Recent developments within the Oman Tables Market reflect a shift in industry dynamics, responding to evolving consumer preferences and market conditions. Throughout this period, there has been an increased focus on product innovation, with manufacturers experimenting with new materials and designs that align with the burgeoning demand for sustainable furniture.
Additionally, online retail platforms have seen significant growth, as consumers increasingly favor the convenience of shopping from home. This transition has prompted traditional retailers to enhance their digital presence in order to remain competitive. Collaborative efforts among local manufacturers have also become more common, aiming to consolidate capabilities and ensure better supply chain efficiencies. As the market evolves, these trends suggest a robust trajectory for the Oman Tables Market.
Oman Tables Market - Key Attractiveness of the Report
- 10 Years of Market Numbers
- Historical Data Starting from 2022 to 2025
- Base Year: 2025
- Forecast Data until 2032
- Key Performance Indicators Impacting the Market
- Major Upcoming Developments and Projects
Key Highlights of the Report:
- Oman Tables Market Outlook
- Market Size of Oman Tables Market, 2025
- Forecast of Oman Tables Market, 2032F
- Historical Data and Forecast of Oman Tables Revenues & Volume for the Period 2022-2032F
- Oman Tables Market Trend Evolution
- Oman Tables Market Drivers and Challenges
- Oman Tables Price Trends
- Oman Tables Porter's Five Forces
- Oman Tables Industry Life Cycle
- Historical Data and Forecast of Oman Tables Market Revenues & Volume By Types for the Period 2022-2032F
- Historical Data and Forecast of Oman Tables Market Revenues & Volume By Fabric for the Period 2022-2032F
- Historical Data and Forecast of Oman Tables Market Revenues & Volume By Leather for the Period 2022-2032F
- Historical Data and Forecast of Oman Tables Market Revenues & Volume By Metal for the Period 2022-2032F
- Historical Data and Forecast of Oman Tables Market Revenues & Volume By Wooden for the Period 2022-2032F
- Historical Data and Forecast of Oman Tables Market Revenues & Volume By Others for the Period 2022-2032F
- Historical Data and Forecast of Oman Tables Market Revenues & Volume By Applications for the Period 2022-2032F
- Historical Data and Forecast of Oman Tables Market Revenues & Volume By Family for the Period 2022-2032F
- Historical Data and Forecast of Oman Tables Market Revenues & Volume By Office for the Period 2022-2032F
- Historical Data and Forecast of Oman Tables Market Revenues & Volume By Others for the Period 2022-2032F
- Oman Tables Import Export Trade Statistics
- Market Opportunity Assessment By Types
- Market Opportunity Assessment By Applications
- Oman Tables Top Companies Market Share
- Oman Tables Competitive Benchmarking By Technical and Operational Parameters
- Oman Tables Company Profiles
- Oman Tables Key Strategic Recommendations
Frequently Asked Questions About the Market Study (FAQs):
The growth is primarily driven by rising urbanization, increased disposable income, and shifting consumer preferences towards functional and stylish furniture.
Manufacturers face challenges such as intense competition, fluctuating raw material prices, and the necessity to adapt to modern design trends and digital marketing strategies.
The government supports the market by promoting local manufacturing, providing financial incentives for SMEs, and emphasizing sustainable practices in furniture production.
Future trends include increased demand for multifunctional furniture, a focus on sustainability, and a shift towards higher-end and customizable table options.
6Wresearch actively monitors the Oman Tables Market and publishes its comprehensive annual report, highlighting emerging trends, growth drivers, revenue analysis, and forecast outlook. Our insights help businesses to make data-backed strategic decisions with ongoing market dynamics. Our analysts track relevent industries related to the Oman Tables Market, allowing our clients with actionable intelligence and reliable forecasts tailored to emerging regional needs.
Yes, we provide customisation as per your requirements. To learn more, feel free to contact us on sales@6wresearch.com
1 Executive Summary |
2 Introduction |
2.1 Key Highlights of the Report |
2.2 Report Description |
2.3 Market Scope & Segmentation |
2.4 Research Methodology |
2.5 Assumptions |
3 Oman Tables Market Overview |
3.1 Oman Country Macro Economic Indicators |
3.2 Oman Tables Market Revenues & Volume, 2022 & 2032F |
3.3 Oman Tables Market - Industry Life Cycle |
3.4 Oman Tables Market - Porter's Five Forces |
3.5 Oman Tables Market Revenues & Volume Share, By Types, 2022 & 2032F |
3.6 Oman Tables Market Revenues & Volume Share, By Applications, 2022 & 2032F |
4 Oman Tables Market Dynamics |
4.1 Impact Analysis |
4.2 Market Drivers |
4.3 Market Restraints |
5 Oman Tables Market Trends |
6 Oman Tables Market, By Types |
6.1 Oman Tables Market, By Types |
6.1.1 Overview and Analysis |
6.1.2 Oman Tables Market Revenues & Volume, By Types, 2022-2032F |
6.1.3 Oman Tables Market Revenues & Volume, By Fabric, 2022-2032F |
6.1.4 Oman Tables Market Revenues & Volume, By Leather, 2022-2032F |
6.1.5 Oman Tables Market Revenues & Volume, By Metal, 2022-2032F |
6.1.6 Oman Tables Market Revenues & Volume, By Wooden, 2022-2032F |
6.1.7 Oman Tables Market Revenues & Volume, By Others, 2022-2032F |
6.2 Oman Tables Market, By Applications |
6.2.1 Overview and Analysis |
6.2.2 Oman Tables Market Revenues & Volume, By Family, 2022-2032F |
6.2.3 Oman Tables Market Revenues & Volume, By Office, 2022-2032F |
6.2.4 Oman Tables Market Revenues & Volume, By Others, 2022-2032F |
7 Oman Tables Market Import-Export Trade Statistics |
7.1 Oman Tables Market Export to Major Countries |
7.2 Oman Tables Market Imports from Major Countries |
8 Oman Tables Market Key Performance Indicators |
9 Oman Tables Market - Opportunity Assessment |
9.1 Oman Tables Market Opportunity Assessment, By Types, 2022 & 2032F |
9.2 Oman Tables Market Opportunity Assessment, By Applications, 2022 & 2032F |
10 Oman Tables Market - Competitive Landscape |
10.1 Oman Tables Market Revenue Share, By Companies, 2025 |
10.2 Oman Tables Market Competitive Benchmarking, By Operating and Technical Parameters |
11 Company Profiles |
12 Recommendations |
13 Disclaimer |
Global Go To Market Strategy - 2030
Export potential enables firms to identify high-growth global markets with greater confidence by combining advanced trade intelligence with a structured quantitative methodology. The framework analyzes emerging demand trends and country-level import patterns while integrating macroeconomic and trade datasets such as GDP and population forecasts, bilateral import–export flows, tariff structures, elasticity differentials between developed and developing economies, geographic distance, and import demand projections. Using weighted trade values from 2020–2024 as the base period to project country-to-country export potential for 2030, these inputs are operationalized through calculated drivers such as gravity model parameters, tariff impact factors, and projected GDP per-capita growth. Through an analysis of hidden potentials, demand hotspots, and market conditions that are most favorable to success, this method enables firms to focus on target countries, maximize returns, and global expansion with data, backed by accuracy.
By factoring in the projected importer demand gap that is currently unmet and could be potential opportunity, it identifies the potential for the Exporter (Country) among 190 countries, against the general trade analysis, which identifies the biggest importer or exporter.
To discover high-growth global markets and optimize your business strategy:
Click Here
Pricing
- Single User License$ 1,995
- Department License$ 2,400
- Site License$ 3,120
- Global License$ 3,795

Leadership Perspectives from Industry Events
Search
Thought Leadership and Analyst Meet


Our Clients
6WResearch In News
- India Air Conditioner Market Set for Strong Rebound in 2026 After Weather-Led Correction and GST-Driven Recovery: 6Wresearch
- ADAS in India: How Automatic Emergency Braking, Blind Spot Detection & Driver Monitoring are Transforming Road Safety
- Doha a strategic location for EV manufacturing hub: IPA Qatar
- Demand for luxury TVs surging in the GCC, says Samsung
- Empowering Growth: The Thriving Journey of Bangladesh’s Cable Industry
- Demand for luxury TVs surging in the GCC, says Samsung
Latest Reports
- Nicaragua RPG Gaming Market (2026-2032)
- New Zealand RPG Gaming Market (2026-2032)
- Netherlands RPG Gaming Market (2026-2032)
- Nauru RPG Gaming Market (2026-2032)
- Namibia RPG Gaming Market (2026-2032)
- Mozambique RPG Gaming Market (2026-2032)
- Montenegro RPG Gaming Market (2026-2032)
- Mongolia RPG Gaming Market (2026-2032)
- Monaco RPG Gaming Market (2026-2032)
- Micronesia RPG Gaming Market (2026-2032)
Industry Events and Analyst Meet

HIMTEX 2026

India Refining Summit 2026

India EV Show 2026

EV tech India Expo 2026

Auto Tech Asia 2026
Whitepaper
- Middle East & Africa Commercial Security Market Click here to view more.
- Middle East & Africa Fire Safety Systems & Equipment Market Click here to view more.
- GCC Drone Market Click here to view more.
- Middle East Lighting Fixture Market Click here to view more.
- GCC Physical & Perimeter Security Market Click here to view more.