Pakistan Catalyst Carriers Market (2026-2032) Outlook | Forecast, Share, Value, Industry, Analysis, Companies, Size, Growth, Revenue & Trends
Market Forecast By Product Type (Ceramics, Activated Carbon, Zeolites), By Shape/Composition (Sphere, Porous, Ring, Extrudate, Honeycomb), By End Use Industry (Oil & Gas, Chemical Manufacturing, Automotive, Petrochemicals, Pharmaceuticals, Agrochemicals, Others), By Material Type (Alumina, Titania, Zirconia, Silicone Carbide, Silica, Others), By Surface Area (Low, Intermediate, High) And Competitive Landscape
| Product Code: ETC4478558 | Publication Date: Jul 2023 | Updated Date: Mar 2026 | Product Type: Report | |
| Publisher: 6Wresearch | Author: Dhaval Chaurasia | No. of Pages: 85 | No. of Figures: 45 | No. of Tables: 25 |
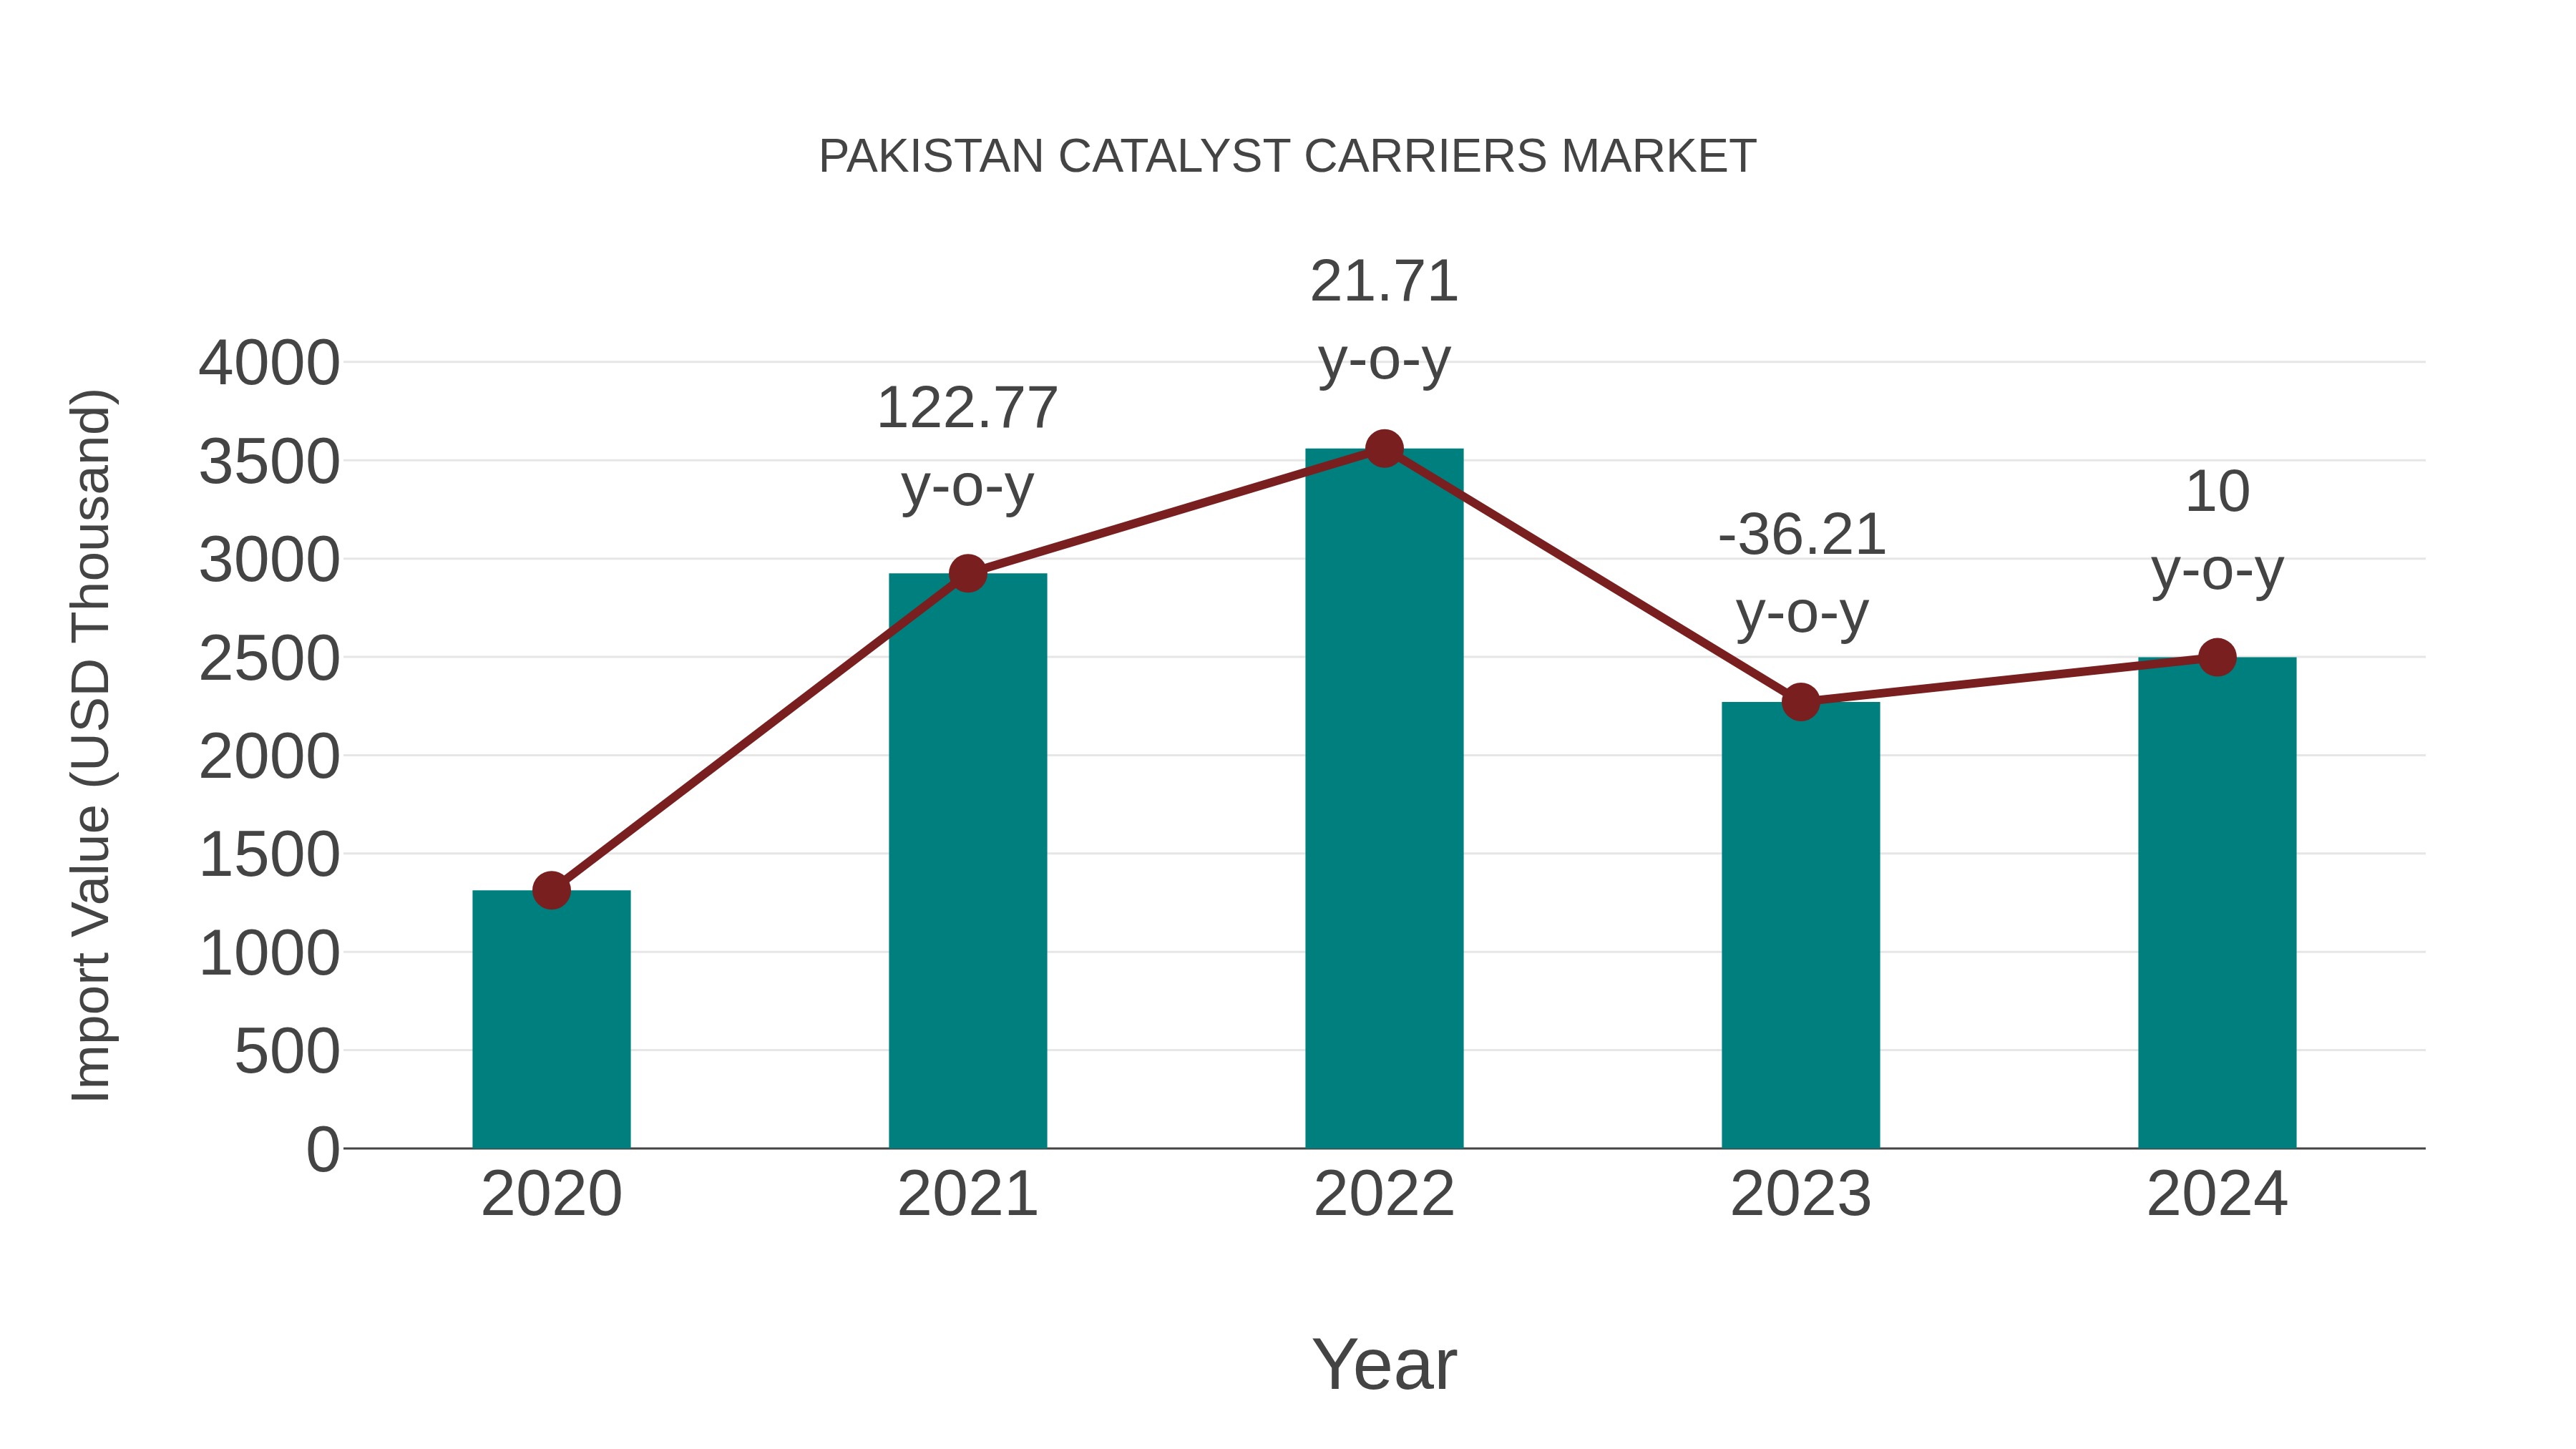
Pakistan Catalyst Carriers Market: Import Trend Analysis
Pakistan import trend for catalyst carriers in 2024 exhibited a growth rate of 10.0% compared to the previous year, with a compound annual growth rate (CAGR) of 17.44% from 2020 to 2024. This surge in imports can be attributed to the increasing demand for catalyst carriers in various industries, reflecting a positive market momentum driven by evolving industrial needs and trade dynamics.
Pakistan Catalyst Carriers Market Overview
The catalyst carriers market in Pakistan is expanding, driven by the country`s industrial and chemical sectors. Catalyst carriers are materials that support and enhance the performance of catalysts used in various chemical reactions. They are crucial in industries such as petrochemicals, refining, and environmental protection. The demand for efficient and environmentally friendly processes is boosting the use of advanced catalyst carriers, which improve reaction rates and selectivity while reducing energy consumption and waste.
Drivers of the market
The expanding chemical and petrochemical industries in Pakistan are driving the demand for catalyst carriers. These carriers play a crucial role in enhancing the efficiency of catalytic processes used in various industrial applications. The rising focus on improving production efficiency and reducing operational costs is further propelling the market.
Challenges of the market
The catalyst carriers market is constrained by technological limitations in producing advanced catalyst materials. Additionally, regulatory constraints and environmental considerations impact the adoption of catalyst carriers in industrial applications.
Government Policy of the market
As part of efforts to promote industrial development and innovation, the Pakistani government implements policies to support the catalyst carriers market. These policies aim to foster research and development in catalyst materials, encourage investment in manufacturing facilities, and promote collaboration between academia, industry, and research institutions. Regulatory frameworks ensure quality standards and environmental sustainability in the production and use of catalyst carriers. Government incentives such as tax breaks, subsidies, and grants may also be available to attract investment and stimulate growth in this strategic market segment.
Key Highlights of the Report:
- Pakistan Catalyst Carriers Market Outlook
- Market Size of Pakistan Catalyst Carriers Market, 2025
- Forecast of Pakistan Catalyst Carriers Market, 2032
- Historical Data and Forecast of Pakistan Catalyst Carriers Revenues & Volume for the Period 2022-2032F
- Pakistan Catalyst Carriers Market Trend Evolution
- Pakistan Catalyst Carriers Market Drivers and Challenges
- Pakistan Catalyst Carriers Price Trends
- Pakistan Catalyst Carriers Porter's Five Forces
- Pakistan Catalyst Carriers Industry Life Cycle
- Historical Data and Forecast of Pakistan Catalyst Carriers Market Revenues & Volume By Product Type for the Period 2022-2032F
- Historical Data and Forecast of Pakistan Catalyst Carriers Market Revenues & Volume By Ceramics for the Period 2022-2032F
- Historical Data and Forecast of Pakistan Catalyst Carriers Market Revenues & Volume By Activated Carbon for the Period 2022-2032F
- Historical Data and Forecast of Pakistan Catalyst Carriers Market Revenues & Volume By Zeolites for the Period 2022-2032F
- Historical Data and Forecast of Pakistan Catalyst Carriers Market Revenues & Volume By Shape/Composition for the Period 2022-2032F
- Historical Data and Forecast of Pakistan Catalyst Carriers Market Revenues & Volume By Sphere for the Period 2022-2032F
- Historical Data and Forecast of Pakistan Catalyst Carriers Market Revenues & Volume By Porous for the Period 2022-2032F
- Historical Data and Forecast of Pakistan Catalyst Carriers Market Revenues & Volume By Ring for the Period 2022-2032F
- Historical Data and Forecast of Pakistan Catalyst Carriers Market Revenues & Volume By Extrudate for the Period 2022-2032F
- Historical Data and Forecast of Pakistan Catalyst Carriers Market Revenues & Volume By Honeycomb for the Period 2022-2032F
- Historical Data and Forecast of Pakistan Catalyst Carriers Market Revenues & Volume By End Use Industry for the Period 2022-2032F
- Historical Data and Forecast of Pakistan Catalyst Carriers Market Revenues & Volume By Oil & Gas for the Period 2022-2032F
- Historical Data and Forecast of Pakistan Catalyst Carriers Market Revenues & Volume By Chemical Manufacturing for the Period 2022-2032F
- Historical Data and Forecast of Pakistan Catalyst Carriers Market Revenues & Volume By Automotive for the Period 2022-2032F
- Historical Data and Forecast of Pakistan Catalyst Carriers Market Revenues & Volume By Petrochemicals for the Period 2022-2032F
- Historical Data and Forecast of Pakistan Catalyst Carriers Market Revenues & Volume By Pharmaceuticals for the Period 2022-2032F
- Historical Data and Forecast of Pakistan Catalyst Carriers Market Revenues & Volume By Agrochemicals for the Period 2022-2032F
- Historical Data and Forecast of Pakistan Catalyst Carriers Market Revenues & Volume By Others for the Period 2022-2032F
- Historical Data and Forecast of Pakistan Catalyst Carriers Market Revenues & Volume By Material Type for the Period 2022-2032F
- Historical Data and Forecast of Pakistan Catalyst Carriers Market Revenues & Volume By Alumina for the Period 2022-2032F
- Historical Data and Forecast of Pakistan Catalyst Carriers Market Revenues & Volume By Titania for the Period 2022-2032F
- Historical Data and Forecast of Pakistan Catalyst Carriers Market Revenues & Volume By Zirconia for the Period 2022-2032F
- Historical Data and Forecast of Pakistan Catalyst Carriers Market Revenues & Volume By Silicone Carbide for the Period 2022-2032F
- Historical Data and Forecast of Pakistan Catalyst Carriers Market Revenues & Volume By Silica for the Period 2022-2032F
- Historical Data and Forecast of Pakistan Catalyst Carriers Market Revenues & Volume By Others for the Period 2022-2032F
- Historical Data and Forecast of Pakistan Catalyst Carriers Market Revenues & Volume By Surface Area for the Period 2022-2032F
- Historical Data and Forecast of Pakistan Catalyst Carriers Market Revenues & Volume By Low for the Period 2022-2032F
- Historical Data and Forecast of Pakistan Catalyst Carriers Market Revenues & Volume By Intermediate for the Period 2022-2032F
- Historical Data and Forecast of Pakistan Catalyst Carriers Market Revenues & Volume By High for the Period 2022-2032F
- Pakistan Catalyst Carriers Import Export Trade Statistics
- Market Opportunity Assessment By Product Type
- Market Opportunity Assessment By Shape/Composition
- Market Opportunity Assessment By End Use Industry
- Market Opportunity Assessment By Material Type
- Market Opportunity Assessment By Surface Area
- Pakistan Catalyst Carriers Top Companies Market Share
- Pakistan Catalyst Carriers Competitive Benchmarking By Technical and Operational Parameters
- Pakistan Catalyst Carriers Company Profiles
- Pakistan Catalyst Carriers Key Strategic Recommendations
Pakistan Catalyst Carriers Market (2026-2032): FAQs
6Wresearch actively monitors the Pakistan Catalyst Carriers Market and publishes its comprehensive annual report, highlighting emerging trends, growth drivers, revenue analysis, and forecast outlook. Our insights help businesses to make data-backed strategic decisions with ongoing market dynamics. Our analysts track relevent industries related to the Pakistan Catalyst Carriers Market, allowing our clients with actionable intelligence and reliable forecasts tailored to emerging regional needs.
Yes, we provide customisation as per your requirements. To learn more, feel free to contact us on sales@6wresearch.com
1 Executive Summary |
2 Introduction |
2.1 Key Highlights of the Report |
2.2 Report Description |
2.3 Market Scope & Segmentation |
2.4 Research Methodology |
2.5 Assumptions |
3 Pakistan Catalyst Carriers Market Overview |
3.1 Pakistan Country Macro Economic Indicators |
3.2 Pakistan Catalyst Carriers Market Revenues & Volume, 2022 & 2032F |
3.3 Pakistan Catalyst Carriers Market - Industry Life Cycle |
3.4 Pakistan Catalyst Carriers Market - Porter's Five Forces |
3.5 Pakistan Catalyst Carriers Market Revenues & Volume Share, By Product Type, 2022 & 2032F |
3.6 Pakistan Catalyst Carriers Market Revenues & Volume Share, By Shape/Composition, 2022 & 2032F |
3.7 Pakistan Catalyst Carriers Market Revenues & Volume Share, By End Use Industry, 2022 & 2032F |
3.8 Pakistan Catalyst Carriers Market Revenues & Volume Share, By Material Type, 2022 & 2032F |
3.9 Pakistan Catalyst Carriers Market Revenues & Volume Share, By Surface Area, 2022 & 2032F |
4 Pakistan Catalyst Carriers Market Dynamics |
4.1 Impact Analysis |
4.2 Market Drivers |
4.2.1 Increasing demand for catalyst carriers in Pakistan's petrochemical industry |
4.2.2 Growing focus on environmental regulations and sustainability driving the adoption of catalyst carriers |
4.2.3 Rising investments in infrastructure and industrial development in Pakistan |
4.3 Market Restraints |
4.3.1 High initial investment costs associated with catalyst carriers |
4.3.2 Limited technological advancements in the catalyst carrier industry in Pakistan |
4.3.3 Fluctuating raw material prices impacting the production costs of catalyst carriers |
5 Pakistan Catalyst Carriers Market Trends |
6 Pakistan Catalyst Carriers Market, By Types |
6.1 Pakistan Catalyst Carriers Market, By Product Type |
6.1.1 Overview and Analysis |
6.1.2 Pakistan Catalyst Carriers Market Revenues & Volume, By Product Type, 2022-2032F |
6.1.3 Pakistan Catalyst Carriers Market Revenues & Volume, By Ceramics, 2022-2032F |
6.1.4 Pakistan Catalyst Carriers Market Revenues & Volume, By Activated Carbon, 2022-2032F |
6.1.5 Pakistan Catalyst Carriers Market Revenues & Volume, By Zeolites, 2022-2032F |
6.2 Pakistan Catalyst Carriers Market, By Shape/Composition |
6.2.1 Overview and Analysis |
6.2.2 Pakistan Catalyst Carriers Market Revenues & Volume, By Sphere, 2022-2032F |
6.2.3 Pakistan Catalyst Carriers Market Revenues & Volume, By Porous, 2022-2032F |
6.2.4 Pakistan Catalyst Carriers Market Revenues & Volume, By Ring, 2022-2032F |
6.2.5 Pakistan Catalyst Carriers Market Revenues & Volume, By Extrudate, 2022-2032F |
6.2.6 Pakistan Catalyst Carriers Market Revenues & Volume, By Honeycomb, 2022-2032F |
6.3 Pakistan Catalyst Carriers Market, By End Use Industry |
6.3.1 Overview and Analysis |
6.3.2 Pakistan Catalyst Carriers Market Revenues & Volume, By Oil & Gas, 2022-2032F |
6.3.3 Pakistan Catalyst Carriers Market Revenues & Volume, By Chemical Manufacturing, 2022-2032F |
6.3.4 Pakistan Catalyst Carriers Market Revenues & Volume, By Automotive, 2022-2032F |
6.3.5 Pakistan Catalyst Carriers Market Revenues & Volume, By Petrochemicals, 2022-2032F |
6.3.6 Pakistan Catalyst Carriers Market Revenues & Volume, By Pharmaceuticals, 2022-2032F |
6.3.7 Pakistan Catalyst Carriers Market Revenues & Volume, By Agrochemicals, 2022-2032F |
6.4 Pakistan Catalyst Carriers Market, By Material Type |
6.4.1 Overview and Analysis |
6.4.2 Pakistan Catalyst Carriers Market Revenues & Volume, By Alumina, 2022-2032F |
6.4.3 Pakistan Catalyst Carriers Market Revenues & Volume, By Titania, 2022-2032F |
6.4.4 Pakistan Catalyst Carriers Market Revenues & Volume, By Zirconia, 2022-2032F |
6.4.5 Pakistan Catalyst Carriers Market Revenues & Volume, By Silicone Carbide, 2022-2032F |
6.4.6 Pakistan Catalyst Carriers Market Revenues & Volume, By Silica, 2022-2032F |
6.4.7 Pakistan Catalyst Carriers Market Revenues & Volume, By Others, 2022-2032F |
6.5 Pakistan Catalyst Carriers Market, By Surface Area |
6.5.1 Overview and Analysis |
6.5.2 Pakistan Catalyst Carriers Market Revenues & Volume, By Low, 2022-2032F |
6.5.3 Pakistan Catalyst Carriers Market Revenues & Volume, By Intermediate, 2022-2032F |
6.5.4 Pakistan Catalyst Carriers Market Revenues & Volume, By High, 2022-2032F |
7 Pakistan Catalyst Carriers Market Import-Export Trade Statistics |
7.1 Pakistan Catalyst Carriers Market Export to Major Countries |
7.2 Pakistan Catalyst Carriers Market Imports from Major Countries |
8 Pakistan Catalyst Carriers Market Key Performance Indicators |
8.1 Percentage increase in the adoption of catalyst carriers by the petrochemical industry in Pakistan |
8.2 Number of new environmental regulations implemented impacting the catalyst carrier market |
8.3 Investment trends in infrastructure projects that require catalyst carriers in Pakistan |
9 Pakistan Catalyst Carriers Market - Opportunity Assessment |
9.1 Pakistan Catalyst Carriers Market Opportunity Assessment, By Product Type, 2022 & 2032F |
9.2 Pakistan Catalyst Carriers Market Opportunity Assessment, By Shape/Composition, 2022 & 2032F |
9.3 Pakistan Catalyst Carriers Market Opportunity Assessment, By End Use Industry, 2022 & 2032F |
9.4 Pakistan Catalyst Carriers Market Opportunity Assessment, By Material Type, 2022 & 2032F |
9.5 Pakistan Catalyst Carriers Market Opportunity Assessment, By Surface Area, 2022 & 2032F |
10 Pakistan Catalyst Carriers Market - Competitive Landscape |
10.1 Pakistan Catalyst Carriers Market Revenue Share, By Companies, 2025 |
10.2 Pakistan Catalyst Carriers Market Competitive Benchmarking, By Operating and Technical Parameters |
11 Company Profiles |
12 Recommendations |
13 Disclaimer |
Global Go To Market Strategy - 2030
Export potential enables firms to identify high-growth global markets with greater confidence by combining advanced trade intelligence with a structured quantitative methodology. The framework analyzes emerging demand trends and country-level import patterns while integrating macroeconomic and trade datasets such as GDP and population forecasts, bilateral import–export flows, tariff structures, elasticity differentials between developed and developing economies, geographic distance, and import demand projections. Using weighted trade values from 2020–2024 as the base period to project country-to-country export potential for 2030, these inputs are operationalized through calculated drivers such as gravity model parameters, tariff impact factors, and projected GDP per-capita growth. Through an analysis of hidden potentials, demand hotspots, and market conditions that are most favorable to success, this method enables firms to focus on target countries, maximize returns, and global expansion with data, backed by accuracy.
By factoring in the projected importer demand gap that is currently unmet and could be potential opportunity, it identifies the potential for the Exporter (Country) among 190 countries, against the general trade analysis, which identifies the biggest importer or exporter.
To discover high-growth global markets and optimize your business strategy:
Click Here
Pricing
- Single User License$ 1,995
- Department License$ 2,400
- Site License$ 3,120
- Global License$ 3,795

Leadership Perspectives from Industry Events
Search
Thought Leadership and Analyst Meet


Our Clients
6WResearch In News
- Doha a strategic location for EV manufacturing hub: IPA Qatar
- Demand for luxury TVs surging in the GCC, says Samsung
- Empowering Growth: The Thriving Journey of Bangladesh’s Cable Industry
- Demand for luxury TVs surging in the GCC, says Samsung
- Video call with a traditional healer? Once unthinkable, it’s now common in South Africa
- Intelligent Buildings To Smooth GCC’s Path To Net Zero
Latest Reports
- Taiwan Airport Wireless Infrastructure Market (2026-2032)
- Vietnam Airport Wireless Infrastructure Market (2026-2032)
- Thailand Airport Wireless Infrastructure Market (2026-2032)
- South Korea Airport Wireless Infrastructure Market (2026-2032)
- Romania Airport Wireless Infrastructure Market (2026-2032)
- Qatar Airport Wireless Infrastructure Market (2026-2032)
- Philippines Airport Wireless Infrastructure Market (2026-2032)
- Japan Airport Wireless Infrastructure Market (2026-2032)
- Taiwan Airport Winter Services Market (2026-2032)
- Vietnam Airport Winter Services Market (2026-2032)
Industry Events and Analyst Meet

HIMTEX 2026

India Refining Summit 2026

India EV Show 2026

EV tech India Expo 2026

Auto Tech Asia 2026
Whitepaper
- Middle East & Africa Commercial Security Market Click here to view more.
- Middle East & Africa Fire Safety Systems & Equipment Market Click here to view more.
- GCC Drone Market Click here to view more.
- Middle East Lighting Fixture Market Click here to view more.
- GCC Physical & Perimeter Security Market Click here to view more.