Peru Activated Carbon Market Outlook | Trends, Industry, Value, Analysis, COVID-19 IMPACT, Growth, Forecast, Revenue, Share, Size & Companies
Market Forecast By Product (Powdered, Granular, Others), By Application (Liquid Phase, Gas Phase), By End-use (Water Treatment, Food & Beverage Processing, Pharmaceutical & Medical, Automotive, Air Purification, Others) And Competitive Landscape
| Product Code: ETC082585 | Publication Date: Jun 2021 | Updated Date: Nov 2025 | Product Type: Report | |
| Publisher: 6Wresearch | Author: Sachin Kumar Rai | No. of Pages: 70 | No. of Figures: 35 | No. of Tables: 5 |
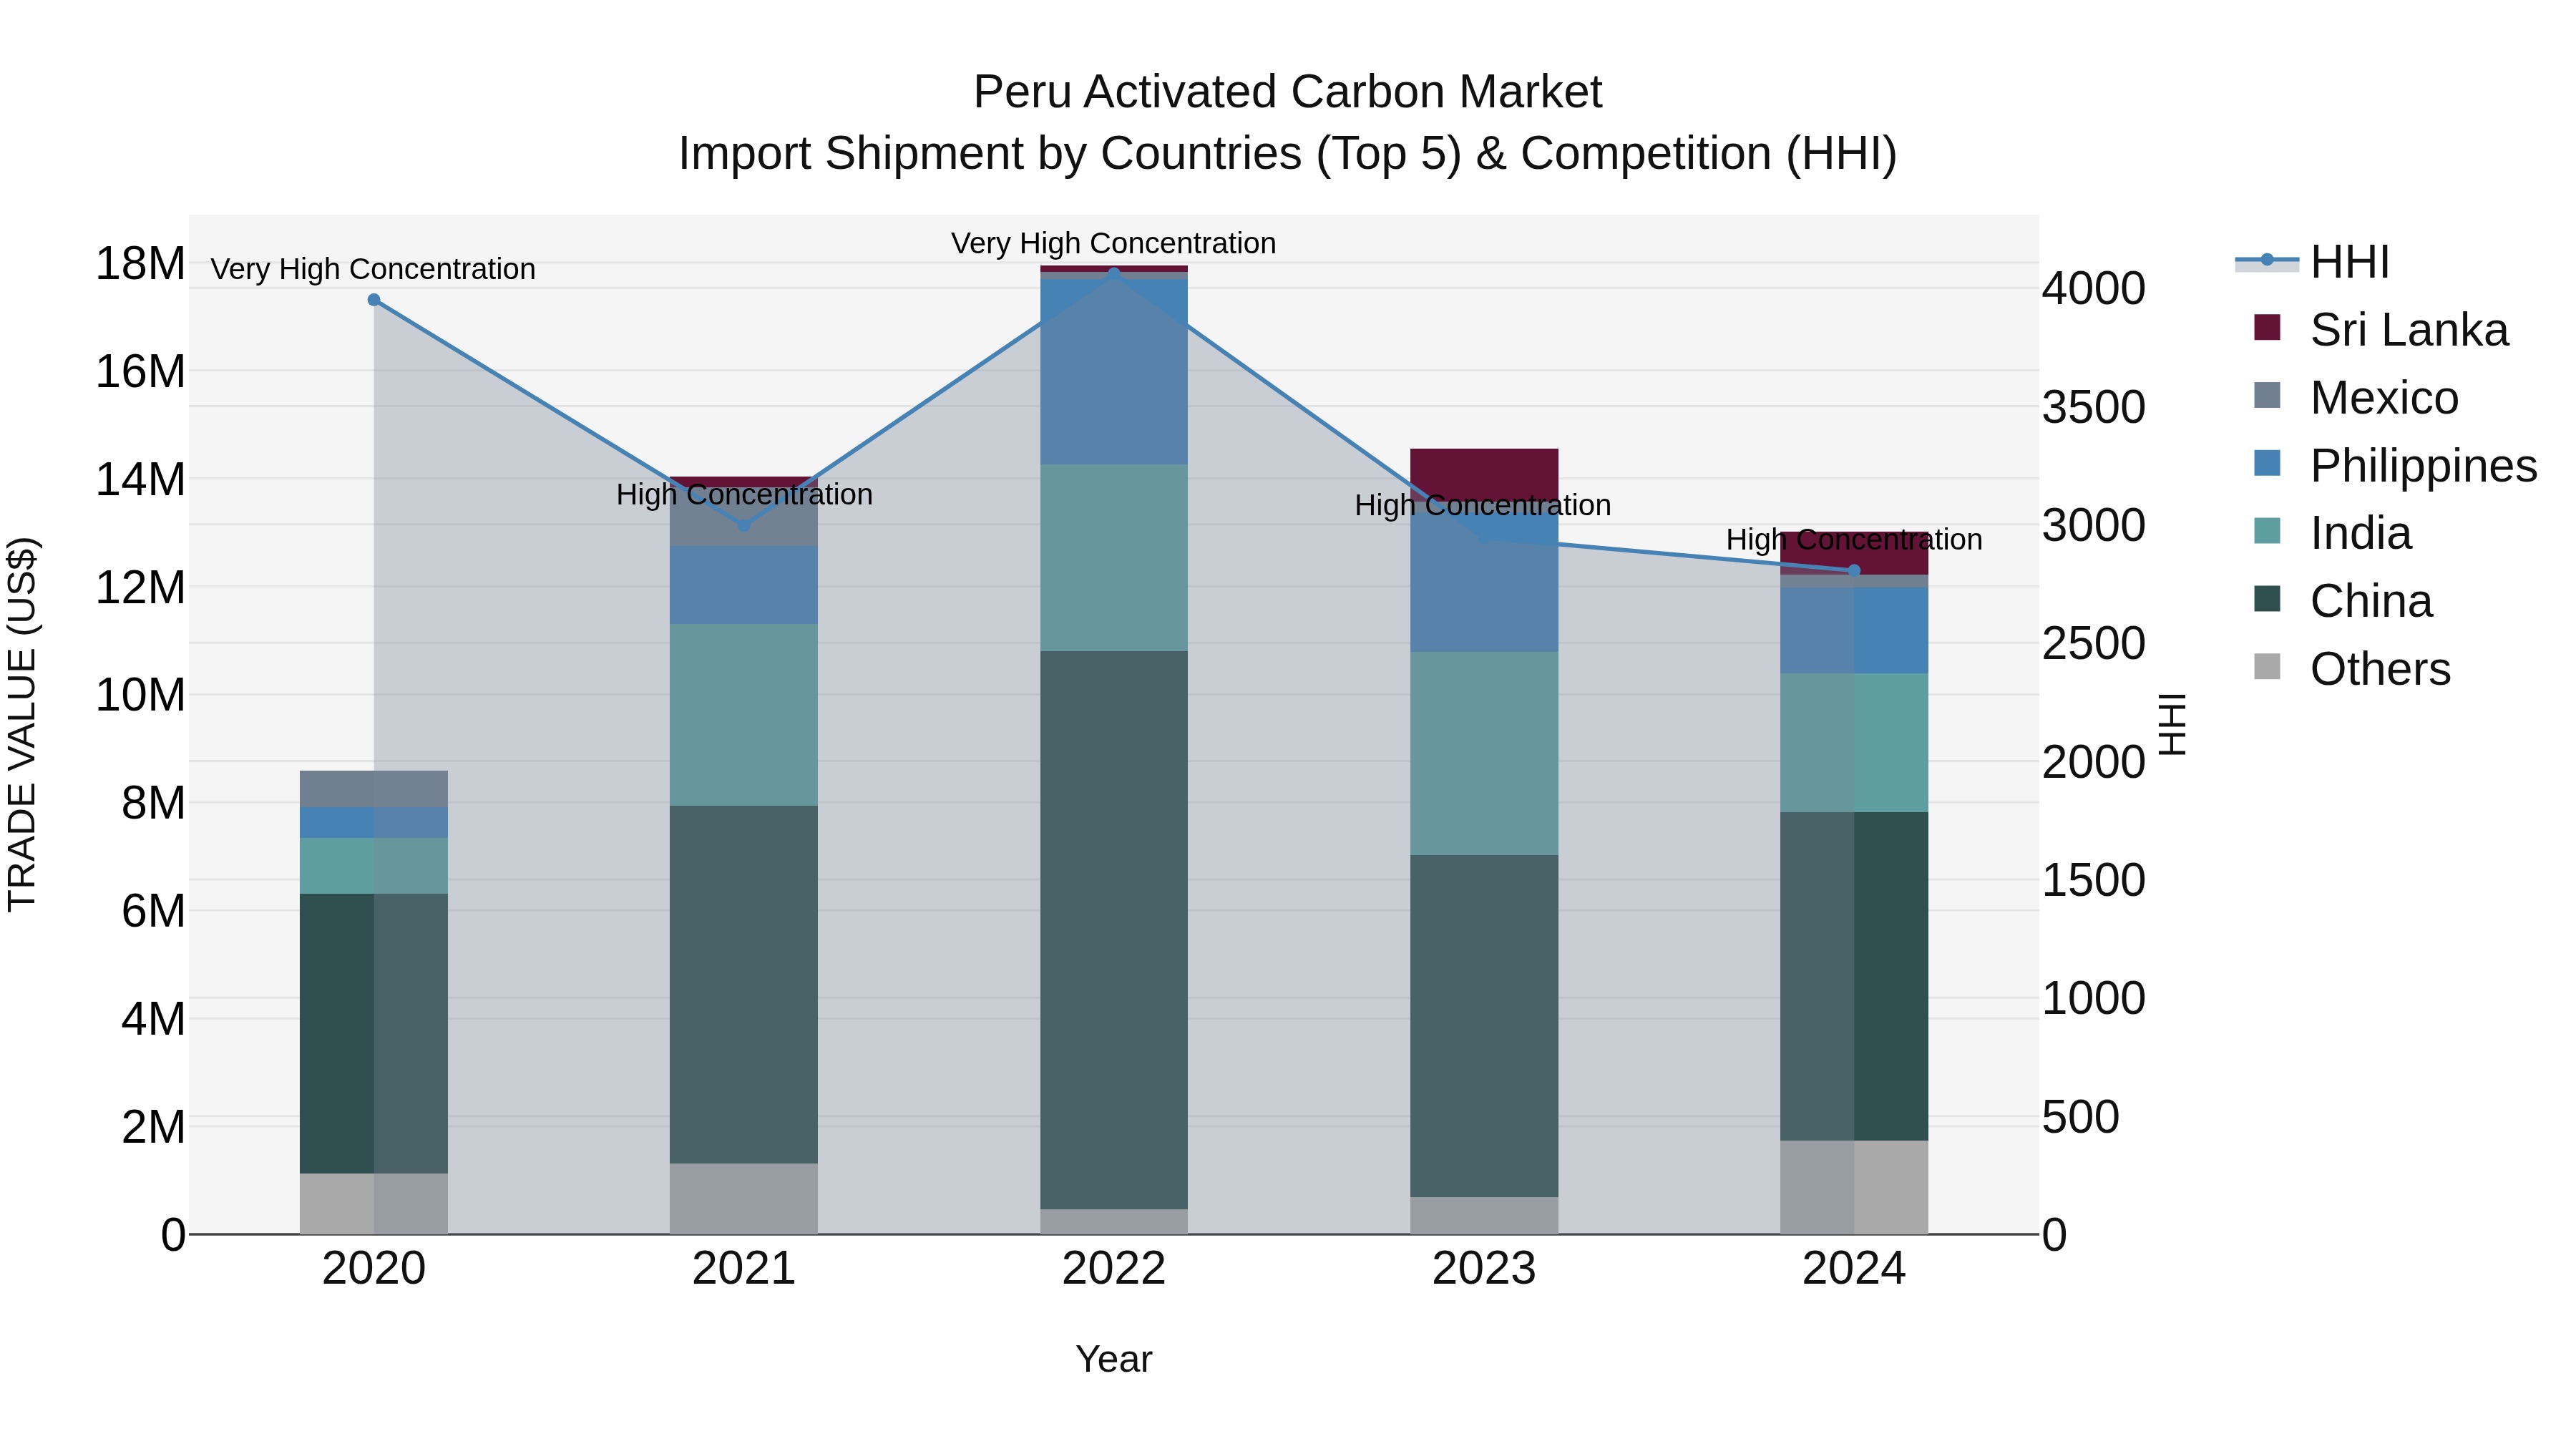
Peru Activated Carbon Market Top 5 Importing Countries and Market Competition (HHI) Analysis
In 2024, Peru continued to rely on key suppliers such as China, India, Philippines, Sri Lanka, and Uruguay for activated carbon imports. The high Herfindahl-Hirschman Index (HHI) suggests a concentrated market, while the impressive compound annual growth rate (CAGR) of 10.95% from 2020 to 2024 indicates sustained demand. However, the slight decline in growth rate from 2023 to 2024 at -10.61% could signal a temporary market adjustment or changing dynamics. Monitoring these trends closely will be crucial for stakeholders in the activated carbon import industry in Peru.
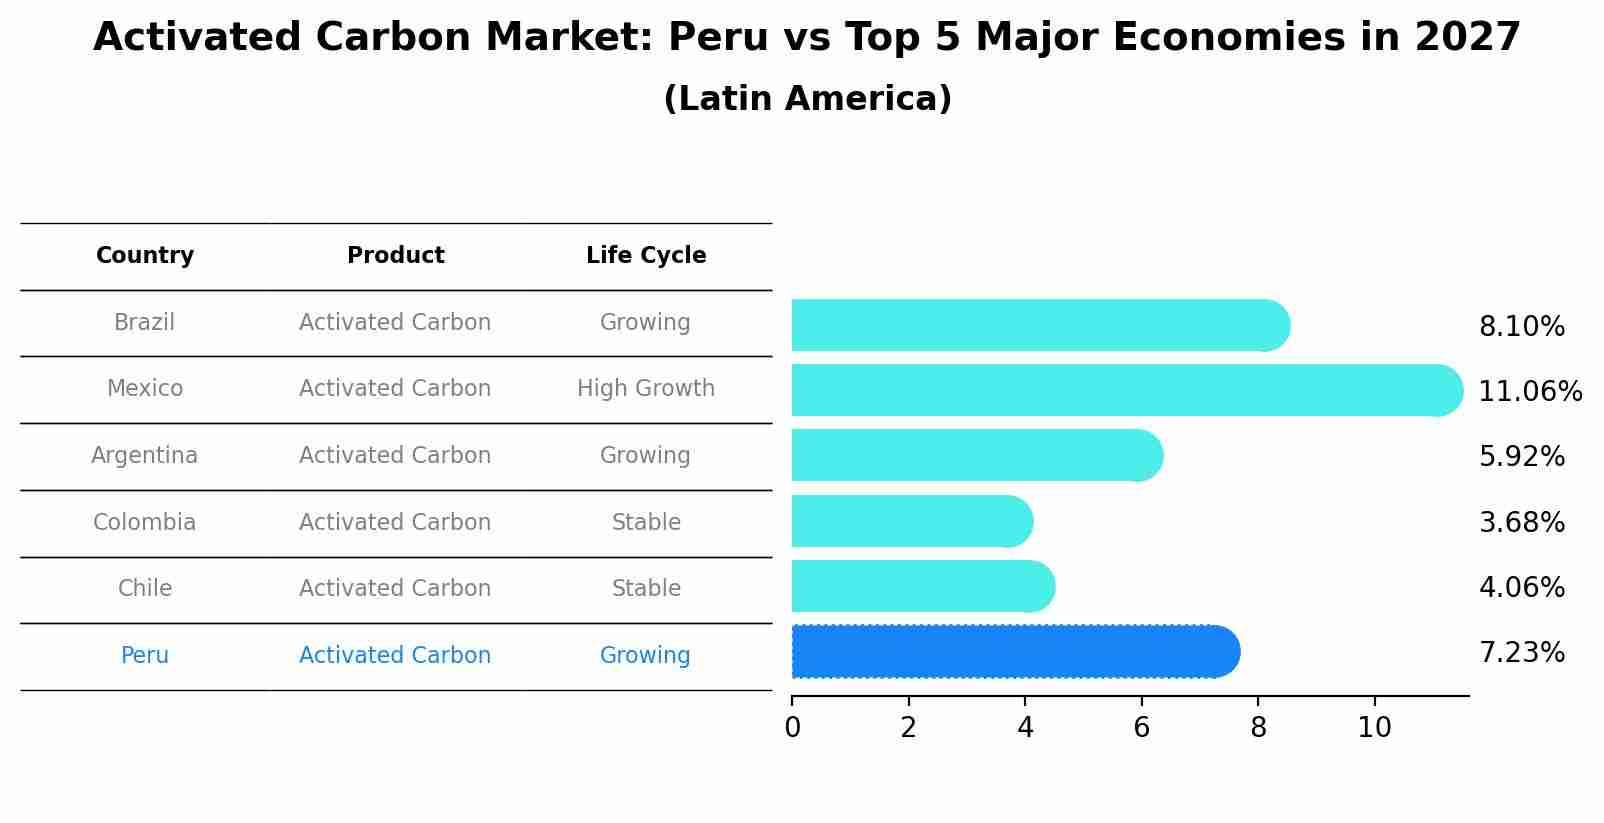
Activated Carbon Market: Peru vs Top 5 Major Economies in 2027 (Latin America)
The Activated Carbon market in Peru is projected to grow at a growing growth rate of 7.23% by 2027, highlighting the country's increasing focus on advanced technologies within the Latin America region, where Brazil holds the dominant position, followed closely by Mexico, Argentina, Colombia and Chile, shaping overall regional demand.
Peru Activated Carbon Market Overview
The Peru activated carbon market is experiencing steady growth driven by increasing adoption across various industries such as water treatment, air purification, and mining. The growing awareness of the importance of environmental sustainability and regulations promoting the use of activated carbon for pollution control are key factors contributing to market expansion. Additionally, the mining sector`s reliance on activated carbon for gold recovery processes further fuels market demand. Key players in the Peru activated carbon market include both domestic manufacturers and international companies, offering a range of products to cater to diverse industry requirements. With a focus on technological advancements and product innovation, the market is expected to continue its growth trajectory in the coming years, presenting opportunities for investment and strategic partnerships.
Peru Activated Carbon Market Trends
In the Peru Activated Carbon Market, there is a growing demand for activated carbon due to its diverse applications across industries such as water treatment, air purification, and food and beverage processing. One of the key trends in the market is the increasing focus on sustainable and eco-friendly activated carbon production methods to meet the rising environmental regulations and consumer preferences. Additionally, the market is witnessing a shift towards the development of specialized activated carbon products tailored for specific applications, such as gas phase filtration and pharmaceutical manufacturing. Market players are also investing in research and development activities to enhance the efficiency and performance of activated carbon products, driving innovation in the market. Overall, the Peru Activated Carbon Market is poised for steady growth driven by increasing awareness of environmental concerns and expanding industrial applications.
Peru Activated Carbon Market Challenges
In the Peru activated carbon market, some challenges include increasing competition from international suppliers, fluctuating prices of raw materials, and the need for continuous innovation to meet environmental regulations. Local manufacturers may struggle to keep up with the technological advancements of global competitors, impacting their market share. Additionally, the reliance on imported raw materials exposes companies to currency exchange risks and supply chain disruptions. Ensuring product quality and consistency while managing production costs is another key challenge faced by players in the Peru activated carbon market. Overall, navigating these challenges requires a strategic approach that includes investing in research and development, fostering strong supplier relationships, and staying informed about industry trends and regulatory requirements.
Peru Activated Carbon Market Investment Opportunities
The Peru Activated Carbon Market presents promising investment opportunities due to the growing demand for activated carbon across various industries such as water treatment, air purification, and mining. The increasing focus on environmental regulations and sustainability initiatives in Peru is driving the need for effective filtration solutions, thereby boosting the demand for activated carbon. Investors can explore opportunities in supplying activated carbon products to industries, investing in manufacturing facilities, or providing consulting services for companies looking to adopt activated carbon solutions. Additionally, with the rise of eco-friendly practices in Peru, there is potential for investments in research and development for innovative and sustainable activated carbon products to cater to the evolving market needs.
Peru Activated Carbon Market Government Policy
The Peruvian government has implemented various policies and regulations related to the activated carbon market to promote sustainable development and environmental protection. Some of these policies include the National Environmental Policy, which aims to ensure the sustainable use of natural resources and the reduction of environmental impact through stricter regulations and enforcement mechanisms. Additionally, Peru has established the National Environmental Quality Standards, which set limits for air and water pollution levels to safeguard public health and the environment. Furthermore, the government has implemented measures to promote the sustainable production and use of activated carbon, such as providing incentives for companies to adopt eco-friendly practices and technologies. Overall, these policies aim to support the growth of the activated carbon market in Peru while ensuring environmental sustainability and compliance with international standards.
Peru Activated Carbon Market Future Outlook
The future outlook for the Peru Activated Carbon Market appears promising, driven by increasing environmental regulations focusing on water and air purification, as well as growing industrial applications across various sectors such as pharmaceuticals, food and beverage, and mining. The market is expected to witness steady growth due to rising awareness about the importance of clean water and air, leading to a higher demand for activated carbon products. Additionally, advancements in technology and the development of new and innovative activated carbon products are likely to further boost market growth. With a focus on sustainability and increasing investments in research and development, the Peru Activated Carbon Market is poised for expansion in the coming years.
Key Highlights of the Report:
- Peru Activated Carbon Market Outlook
- Market Size of Peru Activated Carbon Market, 2021
- Forecast of Peru Activated Carbon Market, 2027
- Historical Data and Forecast of Peru Activated Carbon Revenues & Volume for the Period 2018 - 2027
- Peru Activated Carbon Market Trend Evolution
- Peru Activated Carbon Market Drivers and Challenges
- Peru Activated Carbon Price Trends
- Peru Activated Carbon Porter's Five Forces
- Peru Activated Carbon Industry Life Cycle
- Historical Data and Forecast of Peru Activated Carbon Market Revenues & Volume By Product for the Period 2018 - 2027
- Historical Data and Forecast of Peru Activated Carbon Market Revenues & Volume By Powdered for the Period 2018 - 2027
- Historical Data and Forecast of Peru Activated Carbon Market Revenues & Volume By Granular for the Period 2018 - 2027
- Historical Data and Forecast of Peru Activated Carbon Market Revenues & Volume By Others for the Period 2018 - 2027
- Historical Data and Forecast of Peru Activated Carbon Market Revenues & Volume By Application for the Period 2018 - 2027
- Historical Data and Forecast of Peru Activated Carbon Market Revenues & Volume By Liquid Phase for the Period 2018 - 2027
- Historical Data and Forecast of Peru Activated Carbon Market Revenues & Volume By Gas Phase for the Period 2018 - 2027
- Historical Data and Forecast of Peru Activated Carbon Market Revenues & Volume By End-use for the Period 2018 - 2027
- Historical Data and Forecast of Peru Activated Carbon Market Revenues & Volume By Water Treatment for the Period 2018 - 2027
- Historical Data and Forecast of Peru Activated Carbon Market Revenues & Volume By Food & Beverage Processing for the Period 2018 - 2027
- Historical Data and Forecast of Peru Activated Carbon Market Revenues & Volume By Pharmaceutical & Medical for the Period 2018 - 2027
- Historical Data and Forecast of Peru Activated Carbon Market Revenues & Volume By Automotive for the Period 2018 - 2027
- Historical Data and Forecast of Peru Activated Carbon Market Revenues & Volume By Air Purification for the Period 2018 - 2027
- Historical Data and Forecast of Peru Activated Carbon Market Revenues & Volume By Others for the Period 2018 - 2027
- Peru Activated Carbon Import Export Trade Statistics
- Market Opportunity Assessment By Product
- Market Opportunity Assessment By Application
- Market Opportunity Assessment By End-use
- Peru Activated Carbon Top Companies Market Share
- Peru Activated Carbon Competitive Benchmarking By Technical and Operational Parameters
- Peru Activated Carbon Company Profiles
- Peru Activated Carbon Key Strategic Recommendations
Frequently Asked Questions About the Market Study (FAQs):
6Wresearch actively monitors the Peru Activated Carbon Market and publishes its comprehensive annual report, highlighting emerging trends, growth drivers, revenue analysis, and forecast outlook. Our insights help businesses to make data-backed strategic decisions with ongoing market dynamics. Our analysts track relevent industries related to the Peru Activated Carbon Market, allowing our clients with actionable intelligence and reliable forecasts tailored to emerging regional needs.
Yes, we provide customisation as per your requirements. To learn more, feel free to contact us on sales@6wresearch.com
| 1 Executive Summary |
| 2 Introduction |
| 2.1 Key Highlights of the Report |
| 2.2 Report Description |
| 2.3 Market Scope & Segmentation |
| 2.4 Research Methodology |
| 2.5 Assumptions |
| 3 Peru Activated Carbon Market Overview |
| 3.1 Peru Country Macro Economic Indicators |
| 3.2 Peru Activated Carbon Market Revenues & Volume, 2021 & 2027F |
| 3.3 Peru Activated Carbon Market - Industry Life Cycle |
| 3.4 Peru Activated Carbon Market - Porter's Five Forces |
| 3.5 Peru Activated Carbon Market Revenues & Volume Share, By Product, 2021 & 2027F |
| 3.6 Peru Activated Carbon Market Revenues & Volume Share, By Application, 2021 & 2027F |
| 3.7 Peru Activated Carbon Market Revenues & Volume Share, By End-use, 2021 & 2027F |
| 4 Peru Activated Carbon Market Dynamics |
| 4.1 Impact Analysis |
| 4.2 Market Drivers |
| 4.3 Market Restraints |
| 5 Peru Activated Carbon Market Trends |
| 6 Peru Activated Carbon Market, By Types |
| 6.1 Peru Activated Carbon Market, By Product |
| 6.1.1 Overview and Analysis |
| 6.1.2 Peru Activated Carbon Market Revenues & Volume, By Product, 2018 - 2027F |
| 6.1.3 Peru Activated Carbon Market Revenues & Volume, By Powdered, 2018 - 2027F |
| 6.1.4 Peru Activated Carbon Market Revenues & Volume, By Granular, 2018 - 2027F |
| 6.1.5 Peru Activated Carbon Market Revenues & Volume, By Others, 2018 - 2027F |
| 6.2 Peru Activated Carbon Market, By Application |
| 6.2.1 Overview and Analysis |
| 6.2.2 Peru Activated Carbon Market Revenues & Volume, By Liquid Phase, 2018 - 2027F |
| 6.2.3 Peru Activated Carbon Market Revenues & Volume, By Gas Phase, 2018 - 2027F |
| 6.3 Peru Activated Carbon Market, By End-use |
| 6.3.1 Overview and Analysis |
| 6.3.2 Peru Activated Carbon Market Revenues & Volume, By Water Treatment, 2018 - 2027F |
| 6.3.3 Peru Activated Carbon Market Revenues & Volume, By Food & Beverage Processing, 2018 - 2027F |
| 6.3.4 Peru Activated Carbon Market Revenues & Volume, By Pharmaceutical & Medical, 2018 - 2027F |
| 6.3.5 Peru Activated Carbon Market Revenues & Volume, By Automotive, 2018 - 2027F |
| 6.3.6 Peru Activated Carbon Market Revenues & Volume, By Air Purification, 2018 - 2027F |
| 6.3.7 Peru Activated Carbon Market Revenues & Volume, By Others, 2018 - 2027F |
| 7 Peru Activated Carbon Market Import-Export Trade Statistics |
| 7.1 Peru Activated Carbon Market Export to Major Countries |
| 7.2 Peru Activated Carbon Market Imports from Major Countries |
| 8 Peru Activated Carbon Market Key Performance Indicators |
| 9 Peru Activated Carbon Market - Opportunity Assessment |
| 9.1 Peru Activated Carbon Market Opportunity Assessment, By Product, 2021 & 2027F |
| 9.2 Peru Activated Carbon Market Opportunity Assessment, By Application, 2021 & 2027F |
| 9.3 Peru Activated Carbon Market Opportunity Assessment, By End-use, 2021 & 2027F |
| 10 Peru Activated Carbon Market - Competitive Landscape |
| 10.1 Peru Activated Carbon Market Revenue Share, By Companies, 2021 |
| 10.2 Peru Activated Carbon Market Competitive Benchmarking, By Operating and Technical Parameters |
| 11 Company Profiles |
| 12 Recommendations |
| 13 Disclaimer |
Global Go To Market Strategy - 2030
Export potential enables firms to identify high-growth global markets with greater confidence by combining advanced trade intelligence with a structured quantitative methodology. The framework analyzes emerging demand trends and country-level import patterns while integrating macroeconomic and trade datasets such as GDP and population forecasts, bilateral import–export flows, tariff structures, elasticity differentials between developed and developing economies, geographic distance, and import demand projections. Using weighted trade values from 2020–2024 as the base period to project country-to-country export potential for 2030, these inputs are operationalized through calculated drivers such as gravity model parameters, tariff impact factors, and projected GDP per-capita growth. Through an analysis of hidden potentials, demand hotspots, and market conditions that are most favorable to success, this method enables firms to focus on target countries, maximize returns, and global expansion with data, backed by accuracy.
By factoring in the projected importer demand gap that is currently unmet and could be potential opportunity, it identifies the potential for the Exporter (Country) among 190 countries, against the general trade analysis, which identifies the biggest importer or exporter.
To discover high-growth global markets and optimize your business strategy:
Click Here
Pricing
- Single User License$ 1,995
- Department License$ 2,400
- Site License$ 3,120
- Global License$ 3,795

Leadership Perspectives from Industry Events
Search
Thought Leadership and Analyst Meet


Our Clients
6WResearch In News
- India Air Conditioner Market Set for Strong Rebound in 2026 After Weather-Led Correction and GST-Driven Recovery: 6Wresearch
- ADAS in India: How Automatic Emergency Braking, Blind Spot Detection & Driver Monitoring are Transforming Road Safety
- Doha a strategic location for EV manufacturing hub: IPA Qatar
- Demand for luxury TVs surging in the GCC, says Samsung
- Empowering Growth: The Thriving Journey of Bangladesh’s Cable Industry
- Demand for luxury TVs surging in the GCC, says Samsung
Latest Reports
- Nicaragua RPG Gaming Market (2026-2032)
- New Zealand RPG Gaming Market (2026-2032)
- Netherlands RPG Gaming Market (2026-2032)
- Nauru RPG Gaming Market (2026-2032)
- Namibia RPG Gaming Market (2026-2032)
- Mozambique RPG Gaming Market (2026-2032)
- Montenegro RPG Gaming Market (2026-2032)
- Mongolia RPG Gaming Market (2026-2032)
- Monaco RPG Gaming Market (2026-2032)
- Micronesia RPG Gaming Market (2026-2032)
Industry Events and Analyst Meet

HIMTEX 2026

India Refining Summit 2026

India EV Show 2026

EV tech India Expo 2026

Auto Tech Asia 2026
Whitepaper
- Middle East & Africa Commercial Security Market Click here to view more.
- Middle East & Africa Fire Safety Systems & Equipment Market Click here to view more.
- GCC Drone Market Click here to view more.
- Middle East Lighting Fixture Market Click here to view more.
- GCC Physical & Perimeter Security Market Click here to view more.