Peru Direct Thermal Ticket Paper Market (2026-2032) | Competitive Landscape, Size & Revenue, Growth, Analysis, Forecast, Segmentation, Share, Industry, Outlook, Companies, Trends, Value
Market Forecast By Thickness (Up to 70 GSM, 70 GSM to 90 GSM, 90 GSM to 120 GSM, Above 120 GSM), By Paper Type (Top-coated Paper, Non Top-coated Paper), By Application (Admission or Events Tickets, Lottery Tickets, Bill Tickets, Tote & Gaming Tickets, Valet Parking Tickets, Barcode Tickets, Baggage Counter Tickets, Other Custom Ticketing Applications) And Competitive Landscape
| Product Code: ETC8817945 | Publication Date: Sep 2024 | Updated Date: Apr 2026 | Product Type: Market Research Report | |
| Publisher: 6Wresearch | Author: Sumit Sagar | No. of Pages: 75 | No. of Figures: 35 | No. of Tables: 20 |
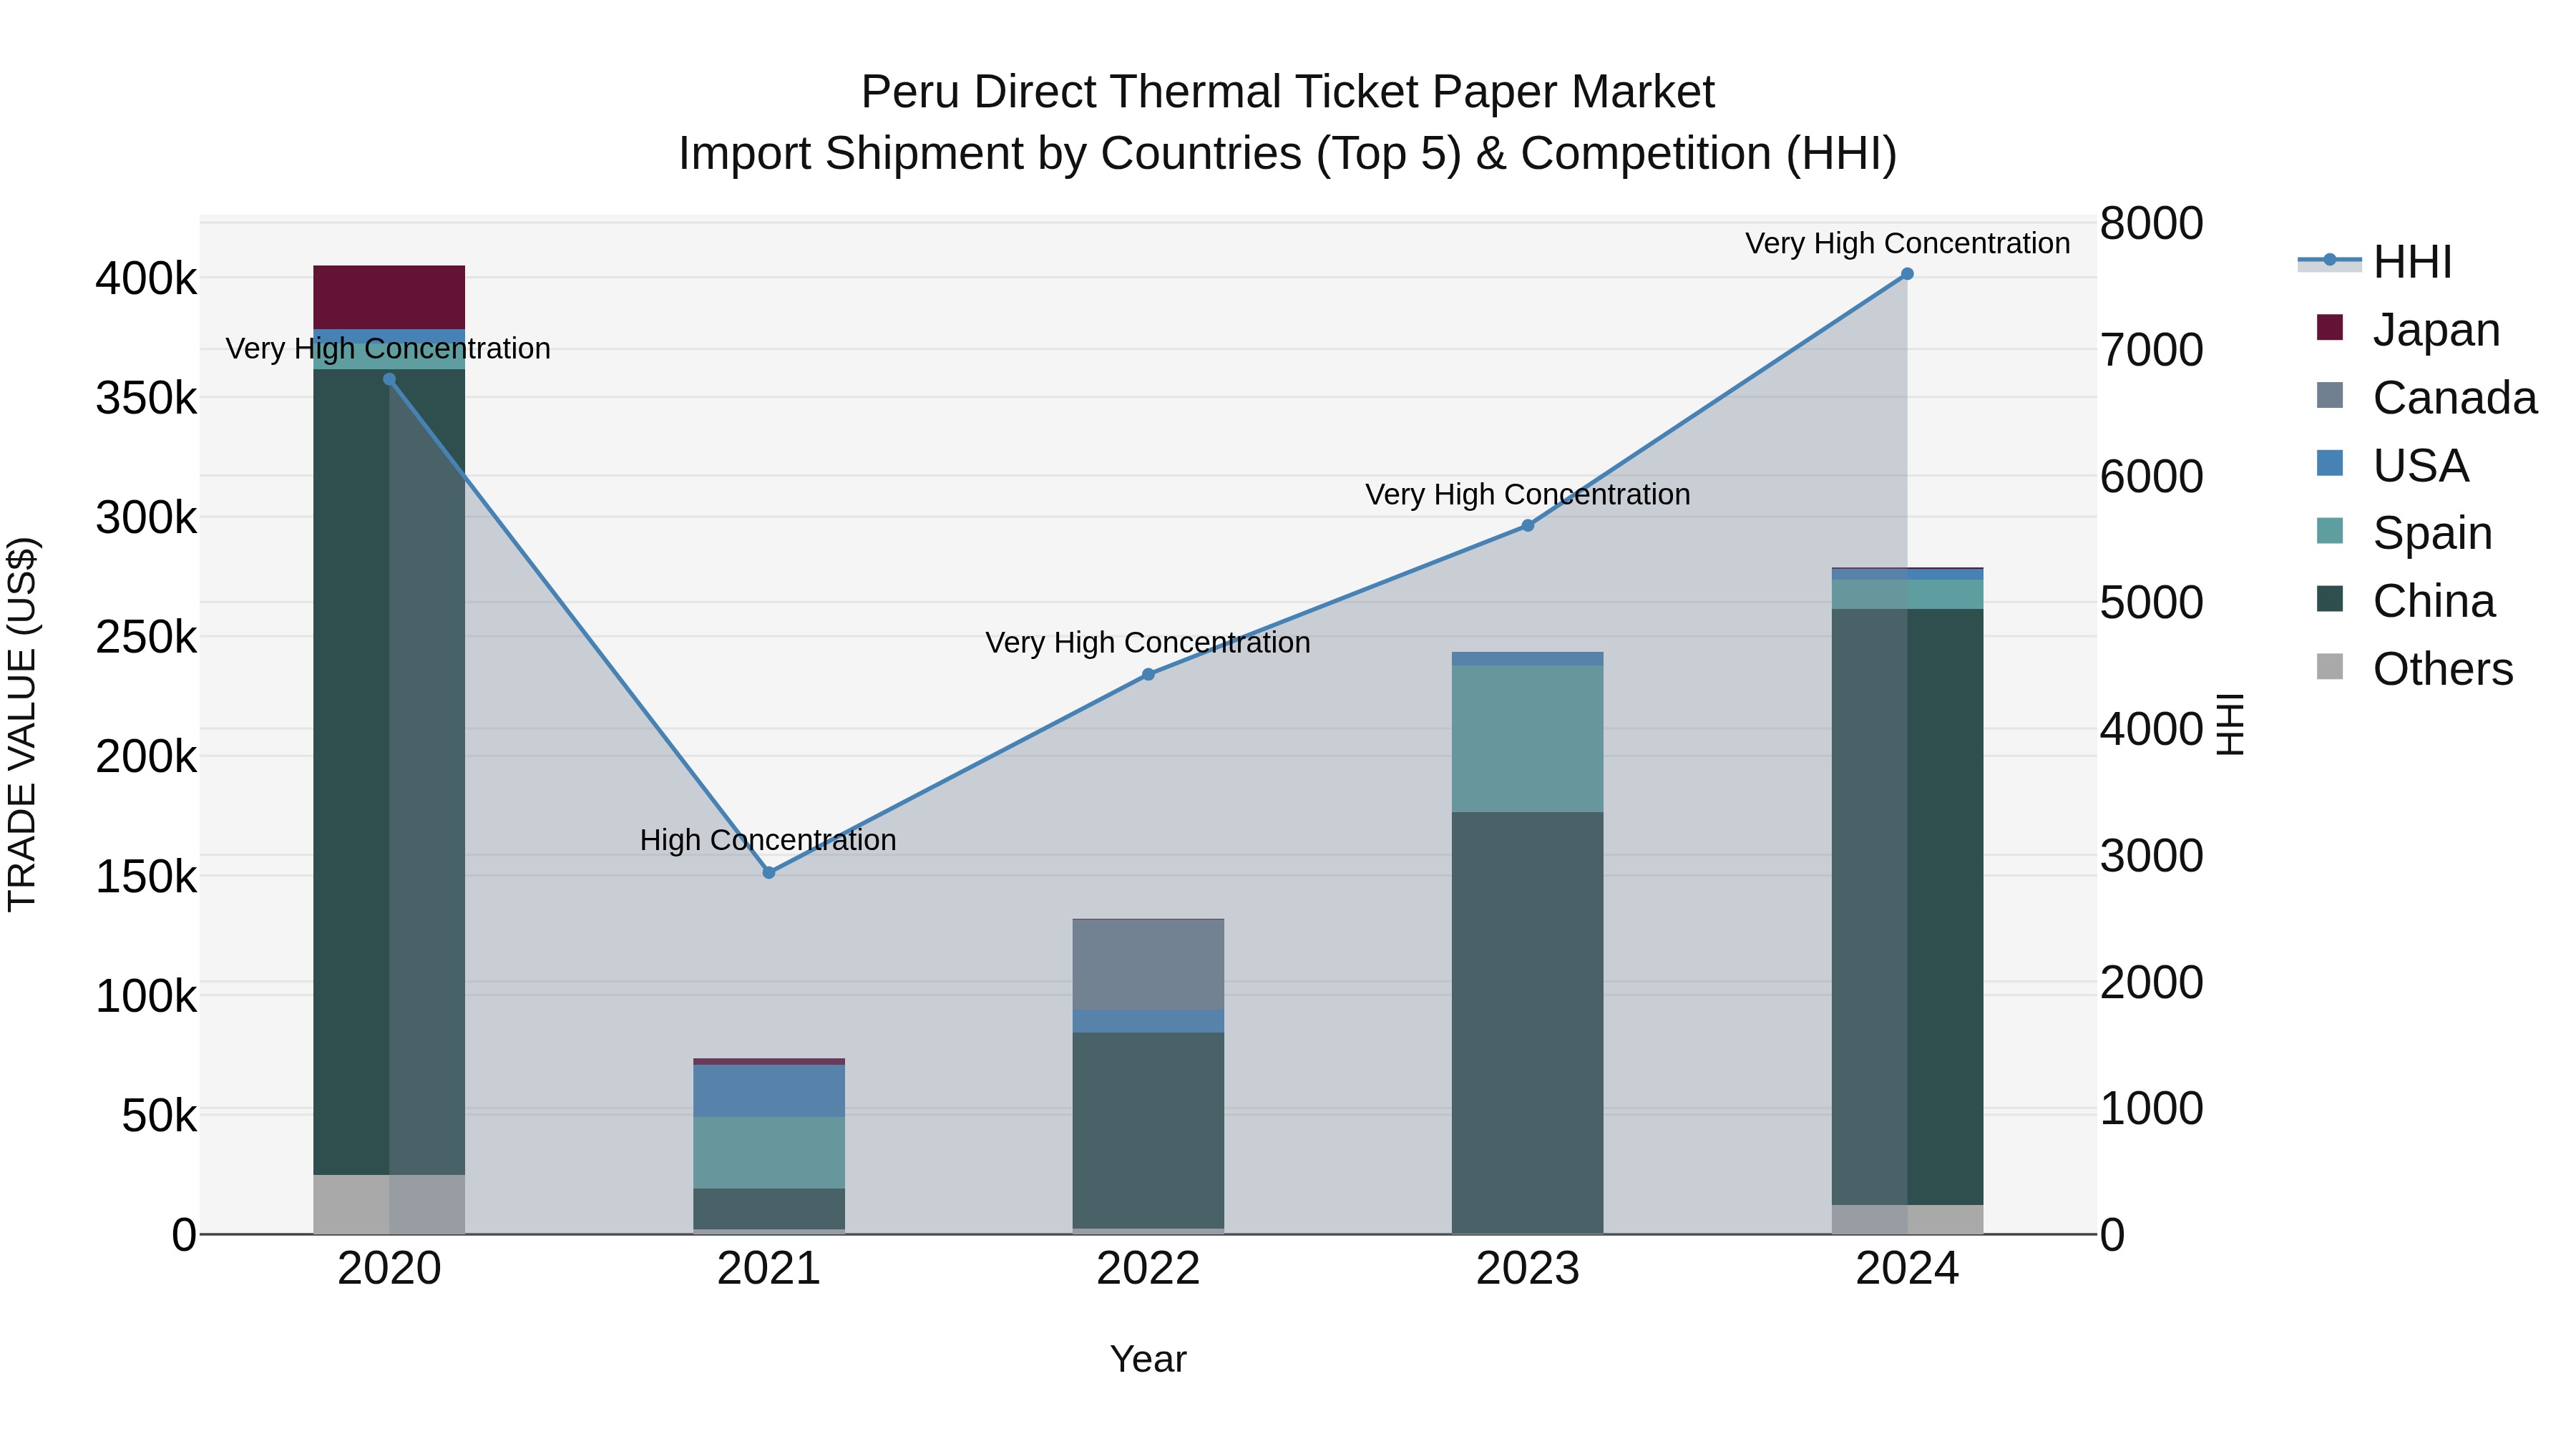
Peru Direct Thermal Ticket Paper Market Top 5 Importing Countries and Market Competition (HHI) Analysis
In 2024, Peru continued to import direct thermal ticket paper primarily from China, Spain, South Korea, USA, and Japan. The market showed high concentration with a high Herfindahl-Hirschman Index (HHI). Despite a negative compound annual growth rate (CAGR) from 2020 to 2024 at -8.92%, the industry experienced a notable growth spurt in 2024 with a growth rate of 14.45% compared to the previous year. This suggests potential shifts in market dynamics and opportunities for further exploration in the direct thermal ticket paper import sector in Peru.
Key Highlights of the Report:
- Peru Direct Thermal Ticket Paper Market Outlook
- Market Size of Peru Direct Thermal Ticket Paper Market, 2025
- Forecast of Peru Direct Thermal Ticket Paper Market, 2032
- Historical Data and Forecast of Peru Direct Thermal Ticket Paper Revenues & Volume for the Period 2022 - 2032
- Peru Direct Thermal Ticket Paper Market Trend Evolution
- Peru Direct Thermal Ticket Paper Market Drivers and Challenges
- Peru Direct Thermal Ticket Paper Price Trends
- Peru Direct Thermal Ticket Paper Porter's Five Forces
- Peru Direct Thermal Ticket Paper Industry Life Cycle
- Historical Data and Forecast of Peru Direct Thermal Ticket Paper Market Revenues & Volume By Thickness for the Period 2022 - 2032
- Historical Data and Forecast of Peru Direct Thermal Ticket Paper Market Revenues & Volume By Up to 70 GSM for the Period 2022 - 2032
- Historical Data and Forecast of Peru Direct Thermal Ticket Paper Market Revenues & Volume By 70 GSM to 90 GSM for the Period 2022 - 2032
- Historical Data and Forecast of Peru Direct Thermal Ticket Paper Market Revenues & Volume By 90 GSM to 120 GSM for the Period 2022 - 2032
- Historical Data and Forecast of Peru Direct Thermal Ticket Paper Market Revenues & Volume By Above 120 GSM for the Period 2022 - 2032
- Historical Data and Forecast of Peru Direct Thermal Ticket Paper Market Revenues & Volume By Paper Type for the Period 2022 - 2032
- Historical Data and Forecast of Peru Direct Thermal Ticket Paper Market Revenues & Volume By Top-coated Paper for the Period 2022 - 2032
- Historical Data and Forecast of Peru Direct Thermal Ticket Paper Market Revenues & Volume By Non Top-coated Paper for the Period 2022 - 2032
- Historical Data and Forecast of Peru Direct Thermal Ticket Paper Market Revenues & Volume By Application for the Period 2022 - 2032
- Historical Data and Forecast of Peru Direct Thermal Ticket Paper Market Revenues & Volume By Admission or Events Tickets for the Period 2022 - 2032
- Historical Data and Forecast of Peru Direct Thermal Ticket Paper Market Revenues & Volume By Lottery Tickets for the Period 2022 - 2032
- Historical Data and Forecast of Peru Direct Thermal Ticket Paper Market Revenues & Volume By Bill Tickets for the Period 2022 - 2032
- Historical Data and Forecast of Peru Direct Thermal Ticket Paper Market Revenues & Volume By Tote & Gaming Tickets for the Period 2022 - 2032
- Historical Data and Forecast of Peru Direct Thermal Ticket Paper Market Revenues & Volume By Valet Parking Tickets for the Period 2022 - 2032
- Historical Data and Forecast of Peru Direct Thermal Ticket Paper Market Revenues & Volume By Barcode Tickets for the Period 2022 - 2032
- Historical Data and Forecast of Peru Direct Thermal Ticket Paper Market Revenues & Volume By Baggage Counter Tickets for the Period 2022 - 2032
- Historical Data and Forecast of Peru Direct Thermal Ticket Paper Market Revenues & Volume By Other Custom Ticketing Applications for the Period 2022 - 2032
- Peru Direct Thermal Ticket Paper Import Export Trade Statistics
- Market Opportunity Assessment By Thickness
- Market Opportunity Assessment By Paper Type
- Market Opportunity Assessment By Application
- Peru Direct Thermal Ticket Paper Top Companies Market Share
- Peru Direct Thermal Ticket Paper Competitive Benchmarking By Technical and Operational Parameters
- Peru Direct Thermal Ticket Paper Company Profiles
- Peru Direct Thermal Ticket Paper Key Strategic Recommendations
Frequently Asked Questions About the Market Study (FAQs):
6Wresearch actively monitors the Peru Direct Thermal Ticket Paper Market and publishes its comprehensive annual report, highlighting emerging trends, growth drivers, revenue analysis, and forecast outlook. Our insights help businesses to make data-backed strategic decisions with ongoing market dynamics. Our analysts track relevent industries related to the Peru Direct Thermal Ticket Paper Market, allowing our clients with actionable intelligence and reliable forecasts tailored to emerging regional needs.
Yes, we provide customisation as per your requirements. To learn more, feel free to contact us on sales@6wresearch.com
1 Executive Summary |
2 Introduction |
2.1 Key Highlights of the Report |
2.2 Report Description |
2.3 Market Scope & Segmentation |
2.4 Research Methodology |
2.5 Assumptions |
3 Peru Direct Thermal Ticket Paper Market Overview |
3.1 Peru Country Macro Economic Indicators |
3.2 Peru Direct Thermal Ticket Paper Market Revenues & Volume, 2022 & 2032F |
3.3 Peru Direct Thermal Ticket Paper Market - Industry Life Cycle |
3.4 Peru Direct Thermal Ticket Paper Market - Porter's Five Forces |
3.5 Peru Direct Thermal Ticket Paper Market Revenues & Volume Share, By Thickness, 2022 & 2032F |
3.6 Peru Direct Thermal Ticket Paper Market Revenues & Volume Share, By Paper Type, 2022 & 2032F |
3.7 Peru Direct Thermal Ticket Paper Market Revenues & Volume Share, By Application, 2022 & 2032F |
4 Peru Direct Thermal Ticket Paper Market Dynamics |
4.1 Impact Analysis |
4.2 Market Drivers |
4.2.1 Increasing adoption of direct thermal ticket paper in various industries such as transportation, entertainment, and retail due to its cost-effectiveness and ease of use. |
4.2.2 Growing demand for secure and tamper-evident ticketing solutions to prevent fraud and counterfeiting. |
4.2.3 Technological advancements in direct thermal printing technology leading to improved print quality and durability of tickets. |
4.3 Market Restraints |
4.3.1 Environmental concerns related to the use of thermal paper containing chemicals such as BPA (Bisphenol A). |
4.3.2 Competition from digital ticketing solutions and electronic ticketing systems impacting the demand for direct thermal ticket paper. |
4.3.3 Fluctuations in raw material prices affecting the production cost of direct thermal ticket paper. |
5 Peru Direct Thermal Ticket Paper Market Trends |
6 Peru Direct Thermal Ticket Paper Market, By Types |
6.1 Peru Direct Thermal Ticket Paper Market, By Thickness |
6.1.1 Overview and Analysis |
6.1.2 Peru Direct Thermal Ticket Paper Market Revenues & Volume, By Thickness, 2022 - 2032F |
6.1.3 Peru Direct Thermal Ticket Paper Market Revenues & Volume, By Up to 70 GSM, 2022 - 2032F |
6.1.4 Peru Direct Thermal Ticket Paper Market Revenues & Volume, By 70 GSM to 90 GSM, 2022 - 2032F |
6.1.5 Peru Direct Thermal Ticket Paper Market Revenues & Volume, By 90 GSM to 120 GSM, 2022 - 2032F |
6.1.6 Peru Direct Thermal Ticket Paper Market Revenues & Volume, By Above 120 GSM, 2022 - 2032F |
6.2 Peru Direct Thermal Ticket Paper Market, By Paper Type |
6.2.1 Overview and Analysis |
6.2.2 Peru Direct Thermal Ticket Paper Market Revenues & Volume, By Top-coated Paper, 2022 - 2032F |
6.2.3 Peru Direct Thermal Ticket Paper Market Revenues & Volume, By Non Top-coated Paper, 2022 - 2032F |
6.3 Peru Direct Thermal Ticket Paper Market, By Application |
6.3.1 Overview and Analysis |
6.3.2 Peru Direct Thermal Ticket Paper Market Revenues & Volume, By Admission or Events Tickets, 2022 - 2032F |
6.3.3 Peru Direct Thermal Ticket Paper Market Revenues & Volume, By Lottery Tickets, 2022 - 2032F |
6.3.4 Peru Direct Thermal Ticket Paper Market Revenues & Volume, By Bill Tickets, 2022 - 2032F |
6.3.5 Peru Direct Thermal Ticket Paper Market Revenues & Volume, By Tote & Gaming Tickets, 2022 - 2032F |
6.3.6 Peru Direct Thermal Ticket Paper Market Revenues & Volume, By Valet Parking Tickets, 2022 - 2032F |
6.3.7 Peru Direct Thermal Ticket Paper Market Revenues & Volume, By Barcode Tickets, 2022 - 2032F |
6.3.8 Peru Direct Thermal Ticket Paper Market Revenues & Volume, By Other Custom Ticketing Applications, 2022 - 2032F |
6.3.9 Peru Direct Thermal Ticket Paper Market Revenues & Volume, By Other Custom Ticketing Applications, 2022 - 2032F |
7 Peru Direct Thermal Ticket Paper Market Import-Export Trade Statistics |
7.1 Peru Direct Thermal Ticket Paper Market Export to Major Countries |
7.2 Peru Direct Thermal Ticket Paper Market Imports from Major Countries |
8 Peru Direct Thermal Ticket Paper Market Key Performance Indicators |
8.1 Average selling price (ASP) of direct thermal ticket paper. |
8.2 Adoption rate of direct thermal ticket paper in new industries or applications. |
8.3 Percentage of repeat purchases from existing customers for direct thermal ticket paper. |
8.4 Customer satisfaction and feedback scores related to the quality and performance of direct thermal ticket paper. |
8.5 Number of new product developments or innovations in direct thermal ticket paper technology. |
9 Peru Direct Thermal Ticket Paper Market - Opportunity Assessment |
9.1 Peru Direct Thermal Ticket Paper Market Opportunity Assessment, By Thickness, 2022 & 2032F |
9.2 Peru Direct Thermal Ticket Paper Market Opportunity Assessment, By Paper Type, 2022 & 2032F |
9.3 Peru Direct Thermal Ticket Paper Market Opportunity Assessment, By Application, 2022 & 2032F |
10 Peru Direct Thermal Ticket Paper Market - Competitive Landscape |
10.1 Peru Direct Thermal Ticket Paper Market Revenue Share, By Companies, 2025 |
10.2 Peru Direct Thermal Ticket Paper Market Competitive Benchmarking, By Operating and Technical Parameters |
11 Company Profiles |
12 Recommendations |
13 Disclaimer |
Export potential assessment - trade Analytics for 2030
Export potential enables firms to identify high-growth global markets with greater confidence by combining advanced trade intelligence with a structured quantitative methodology. The framework analyzes emerging demand trends and country-level import patterns while integrating macroeconomic and trade datasets such as GDP and population forecasts, bilateral import–export flows, tariff structures, elasticity differentials between developed and developing economies, geographic distance, and import demand projections. Using weighted trade values from 2020–2024 as the base period to project country-to-country export potential for 2030, these inputs are operationalized through calculated drivers such as gravity model parameters, tariff impact factors, and projected GDP per-capita growth. Through an analysis of hidden potentials, demand hotspots, and market conditions that are most favorable to success, this method enables firms to focus on target countries, maximize returns, and global expansion with data, backed by accuracy.
By factoring in the projected importer demand gap that is currently unmet and could be potential opportunity, it identifies the potential for the Exporter (Country) among 190 countries, against the general trade analysis, which identifies the biggest importer or exporter.
To discover high-growth global markets and optimize your business strategy:
Click Here
Pricing
- Single User License$ 1,995
- Department License$ 2,400
- Site License$ 3,120
- Global License$ 3,795

Search
Thought Leadership and Analyst Meet


Our Clients
Latest Reports
- Philippines Polyhydroxybutyrate-co-Hydroxyvalerate Market (2026-2032) | Trends, Insights, Challenges, Restraints, Competition, Size, Value, Forecast, Pricing, Share, Outlook, Revenue, Investment Opportunities, Strategy, Drivers, Demand, Growth, segmentation, Analysis, Companies
- Peru Polyhydroxybutyrate-co-Hydroxyvalerate Market (2026-2032) | Growth, Demand, Challenges, Share, Trends, Analysis, Pricing, Investment Opportunities, Drivers, Value, Forecast, Competition, Size, Companies, Insights, Outlook, Restraints, segmentation, Revenue, Strategy
- Pakistan Polyhydroxybutyrate-co-Hydroxyvalerate Market (2026-2032) | Restraints, segmentation, Pricing, Forecast, Share, Strategy, Competition, Trends, Insights, Drivers, Challenges, Growth, Revenue, Outlook, Value, Investment Opportunities, Companies, Size, Analysis, Demand
- Oman Polyhydroxybutyrate-co-Hydroxyvalerate Market (2026-2032) | Drivers, segmentation, Insights, Competition, Pricing, Outlook, Size, Revenue, Challenges, Forecast, Analysis, Growth, Value, Share, Trends, Investment Opportunities, Strategy, Restraints, Companies, Demand
- Nigeria Polyhydroxybutyrate-co-Hydroxyvalerate Market (2026-2032) | Value, Investment Opportunities, Analysis, Revenue, Restraints, Pricing, Outlook, Competition, Demand, Growth, Forecast, Companies, Trends, Challenges, segmentation, Drivers, Insights, Share, Size, Strategy
- Nepal Polyhydroxybutyrate-co-Hydroxyvalerate Market (2026-2032) | Insights, Analysis, Drivers, Share, Revenue, Demand, segmentation, Investment Opportunities, Competition, Forecast, Growth, Pricing, Companies, Strategy, Trends, Restraints, Challenges, Outlook, Size, Value
- Myanmar Polyhydroxybutyrate-co-Hydroxyvalerate Market (2026-2032) | Outlook, Revenue, Strategy, Restraints, Drivers, segmentation, Share, Forecast, Competition, Insights, Growth, Pricing, Size, Demand, Value, Companies, Trends, Challenges, Investment Opportunities, Analysis
- Morocco Polyhydroxybutyrate-co-Hydroxyvalerate Market (2026-2032) | Outlook, Investment Opportunities, Restraints, Strategy, Forecast, Challenges, Drivers, Growth, Companies, segmentation, Trends, Size, Competition, Revenue, Demand, Insights, Share, Analysis, Value, Pricing
- Mexico Polyhydroxybutyrate-co-Hydroxyvalerate Market (2026-2032) | Size, Drivers, Outlook, Share, Strategy, Growth, Pricing, Challenges, Companies, Demand, Value, Investment Opportunities, Restraints, Trends, Forecast, segmentation, Analysis, Insights, Competition, Revenue
- Malaysia Polyhydroxybutyrate-co-Hydroxyvalerate Market (2026-2032) | Share, segmentation, Size, Companies, Analysis, Insights, Forecast, Value, Revenue, Drivers, Restraints, Challenges, Investment Opportunities, Trends, Competition, Strategy, Demand, Growth, Outlook, Pricing
Industry Events and Analyst Meet

HIMTEX 2026

India Refining Summit 2026

India EV Show 2026

EV tech India Expo 2026

Auto Tech Asia 2026
Whitepaper
- Middle East & Africa Commercial Security Market Click here to view more.
- Middle East & Africa Fire Safety Systems & Equipment Market Click here to view more.
- GCC Drone Market Click here to view more.
- Middle East Lighting Fixture Market Click here to view more.
- GCC Physical & Perimeter Security Market Click here to view more.
6WResearch In News
- Doha a strategic location for EV manufacturing hub: IPA Qatar
- Demand for luxury TVs surging in the GCC, says Samsung
- Empowering Growth: The Thriving Journey of Bangladesh’s Cable Industry
- Demand for luxury TVs surging in the GCC, says Samsung
- Video call with a traditional healer? Once unthinkable, it’s now common in South Africa
- Intelligent Buildings To Smooth GCC’s Path To Net Zero