Peru Personal Care Products Market (2026-2032) | Value, Strategy, Segments, Outlook, Share, Consumer Insights, Supply, Investment Trends, Companies, Segmentation, Opportunities, Challenges, Size, Revenue, Competition, Drivers, Demand, Pricing Analysis, Forecast, Trends, Industry, Restraints, Analysis, Strategic Insights, Competitive, Growth
Market Forecast By Product Type (Skincare, Haircare, Oral Care, Deodorants, Fragrances), By Function (Hydration, Strengthening, Whitening, Odor Control, Long-Lasting), By Consumer Preference (Organic, Vegan, Sensitive Skin, Aluminum-Free, Natural), By Distribution Channel (Online Retail, Supermarkets, Pharmacies, Convenience Stores, Department Stores), By Target Demographic (Women, Unisex, Adults, Men, Teens) And Competitive Landscape
| Product Code: ETC10776288 | Publication Date: Apr 2025 | Updated Date: Apr 2026 | Product Type: Market Research Report | |
| Publisher: 6Wresearch | No. of Pages: 65 | No. of Figures: 34 | No. of Tables: 19 | |
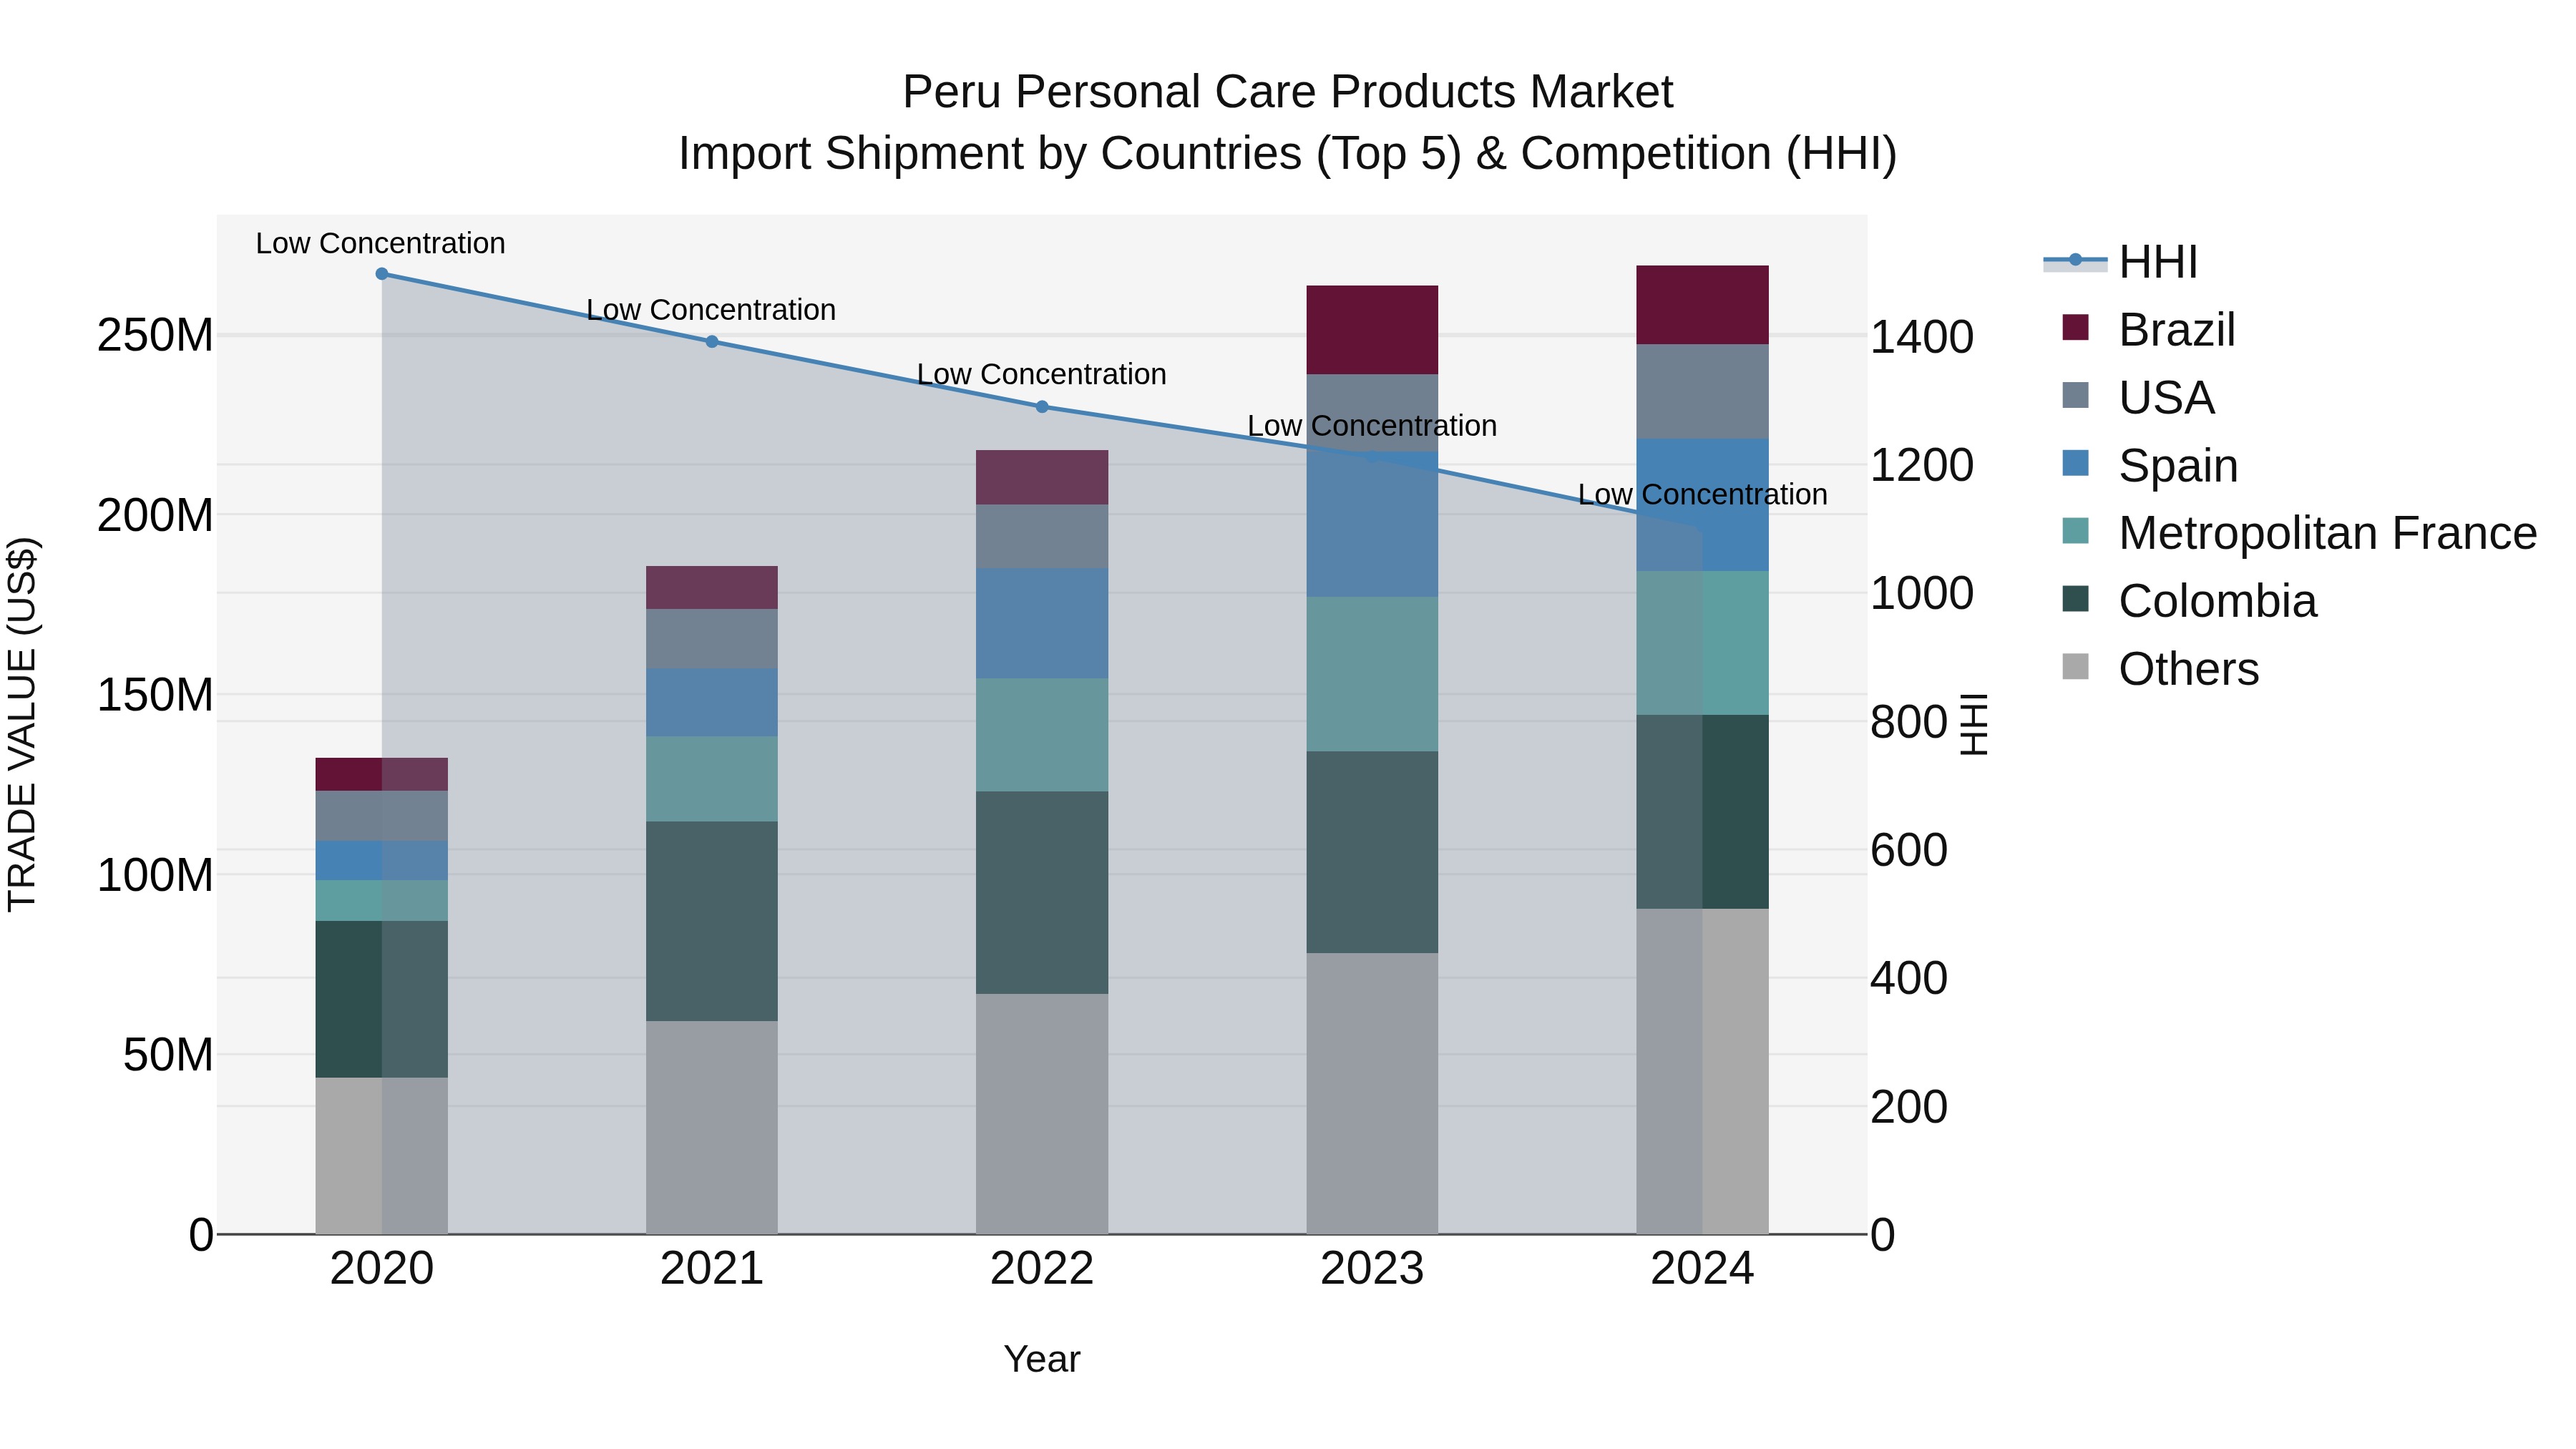
Peru Personal Care Products Market Top 5 Importing Countries and Market Competition (HHI) Analysis
Peru`s personal care products import market continues to thrive with a diverse range of suppliers. In 2024, top exporting countries such as Colombia, Metropolitan France, Spain, USA, and China have captured significant shares. The low concentration indicated by the Herfindahl-Hirschman Index (HHI) suggests a competitive landscape. The impressive compound annual growth rate (CAGR) of 19.4% from 2020 to 2024 reflects sustained market expansion. Additionally, the growth rate of 2.09% from 2023 to 2024 indicates a steady upward trajectory for the import shipments of personal care products in Peru.
Key Highlights of the Report:
- Peru Personal Care Products Market Outlook
- Market Size of Peru Personal Care Products Market, 2025
- Forecast of Peru Personal Care Products Market, 2032
- Historical Data and Forecast of Peru Personal Care Products Revenues & Volume for the Period 2022 - 2032F
- Peru Personal Care Products Market Trend Evolution
- Peru Personal Care Products Market Drivers and Challenges
- Peru Personal Care Products Price Trends
- Peru Personal Care Products Porter's Five Forces
- Peru Personal Care Products Industry Life Cycle
- Historical Data and Forecast of Peru Personal Care Products Market Revenues & Volume By Product Type for the Period 2022 - 2032F
- Historical Data and Forecast of Peru Personal Care Products Market Revenues & Volume By Skincare for the Period 2022 - 2032F
- Historical Data and Forecast of Peru Personal Care Products Market Revenues & Volume By Haircare for the Period 2022 - 2032F
- Historical Data and Forecast of Peru Personal Care Products Market Revenues & Volume By Oral Care for the Period 2022 - 2032F
- Historical Data and Forecast of Peru Personal Care Products Market Revenues & Volume By Deodorants for the Period 2022 - 2032F
- Historical Data and Forecast of Peru Personal Care Products Market Revenues & Volume By Fragrances for the Period 2022 - 2032F
- Historical Data and Forecast of Peru Personal Care Products Market Revenues & Volume By Function for the Period 2022 - 2032F
- Historical Data and Forecast of Peru Personal Care Products Market Revenues & Volume By Hydration for the Period 2022 - 2032F
- Historical Data and Forecast of Peru Personal Care Products Market Revenues & Volume By Strengthening for the Period 2022 - 2032F
- Historical Data and Forecast of Peru Personal Care Products Market Revenues & Volume By Whitening for the Period 2022 - 2032F
- Historical Data and Forecast of Peru Personal Care Products Market Revenues & Volume By Odor Control for the Period 2022 - 2032F
- Historical Data and Forecast of Peru Personal Care Products Market Revenues & Volume By Long-Lasting for the Period 2022 - 2032F
- Historical Data and Forecast of Peru Personal Care Products Market Revenues & Volume By Consumer Preference for the Period 2022 - 2032F
- Historical Data and Forecast of Peru Personal Care Products Market Revenues & Volume By Organic for the Period 2022 - 2032F
- Historical Data and Forecast of Peru Personal Care Products Market Revenues & Volume By Vegan for the Period 2022 - 2032F
- Historical Data and Forecast of Peru Personal Care Products Market Revenues & Volume By Sensitive Skin for the Period 2022 - 2032F
- Historical Data and Forecast of Peru Personal Care Products Market Revenues & Volume By Aluminum-Free for the Period 2022 - 2032F
- Historical Data and Forecast of Peru Personal Care Products Market Revenues & Volume By Natural for the Period 2022 - 2032F
- Historical Data and Forecast of Peru Personal Care Products Market Revenues & Volume By Distribution Channel for the Period 2022 - 2032F
- Historical Data and Forecast of Peru Personal Care Products Market Revenues & Volume By Online Retail for the Period 2022 - 2032F
- Historical Data and Forecast of Peru Personal Care Products Market Revenues & Volume By Supermarkets for the Period 2022 - 2032F
- Historical Data and Forecast of Peru Personal Care Products Market Revenues & Volume By Pharmacies for the Period 2022 - 2032F
- Historical Data and Forecast of Peru Personal Care Products Market Revenues & Volume By Convenience Stores for the Period 2022 - 2032F
- Historical Data and Forecast of Peru Personal Care Products Market Revenues & Volume By Department Stores for the Period 2022 - 2032F
- Historical Data and Forecast of Peru Personal Care Products Market Revenues & Volume By Target Demographic for the Period 2022 - 2032F
- Historical Data and Forecast of Peru Personal Care Products Market Revenues & Volume By Women for the Period 2022 - 2032F
- Historical Data and Forecast of Peru Personal Care Products Market Revenues & Volume By Unisex for the Period 2022 - 2032F
- Historical Data and Forecast of Peru Personal Care Products Market Revenues & Volume By Adults for the Period 2022 - 2032F
- Historical Data and Forecast of Peru Personal Care Products Market Revenues & Volume By Men for the Period 2022 - 2032F
- Historical Data and Forecast of Peru Personal Care Products Market Revenues & Volume By Teens for the Period 2022 - 2032F
- Peru Personal Care Products Import Export Trade Statistics
- Market Opportunity Assessment By Product Type
- Market Opportunity Assessment By Function
- Market Opportunity Assessment By Consumer Preference
- Market Opportunity Assessment By Distribution Channel
- Market Opportunity Assessment By Target Demographic
- Peru Personal Care Products Top Companies Market Share
- Peru Personal Care Products Competitive Benchmarking By Technical and Operational Parameters
- Peru Personal Care Products Company Profiles
- Peru Personal Care Products Key Strategic Recommendations
Frequently Asked Questions About the Market Study (FAQs):
6Wresearch actively monitors the Peru Personal Care Products Market and publishes its comprehensive annual report, highlighting emerging trends, growth drivers, revenue analysis, and forecast outlook. Our insights help businesses to make data-backed strategic decisions with ongoing market dynamics. Our analysts track relevent industries related to the Peru Personal Care Products Market, allowing our clients with actionable intelligence and reliable forecasts tailored to emerging regional needs.
Yes, we provide customisation as per your requirements. To learn more, feel free to contact us on sales@6wresearch.com
1 Executive Summary |
2 Introduction |
2.1 Key Highlights of the Report |
2.2 Report Description |
2.3 Market Scope & Segmentation |
2.4 Research Methodology |
2.5 Assumptions |
3 Peru Personal Care Products Market Overview |
3.1 Peru Country Macro Economic Indicators |
3.2 Peru Personal Care Products Market Revenues & Volume, 2022 & 2032F |
3.3 Peru Personal Care Products Market - Industry Life Cycle |
3.4 Peru Personal Care Products Market - Porter's Five Forces |
3.5 Peru Personal Care Products Market Revenues & Volume Share, By Product Type, 2022 & 2032F |
3.6 Peru Personal Care Products Market Revenues & Volume Share, By Function, 2022 & 2032F |
3.7 Peru Personal Care Products Market Revenues & Volume Share, By Consumer Preference, 2022 & 2032F |
3.8 Peru Personal Care Products Market Revenues & Volume Share, By Distribution Channel, 2022 & 2032F |
3.9 Peru Personal Care Products Market Revenues & Volume Share, By Target Demographic, 2022 & 2032F |
4 Peru Personal Care Products Market Dynamics |
4.1 Impact Analysis |
4.2 Market Drivers |
4.2.1 Increasing disposable income in Peru leading to higher spending on personal care products |
4.2.2 Growing awareness about personal grooming and hygiene among the population |
4.2.3 Expansion of distribution channels such as e-commerce, making personal care products more accessible |
4.3 Market Restraints |
4.3.1 Economic uncertainty impacting consumer spending on non-essential items like personal care products |
4.3.2 Competition from counterfeit products affecting the market reputation and consumer trust |
4.3.3 Stringent regulations and compliance requirements for personal care product manufacturers |
5 Peru Personal Care Products Market Trends |
6 Peru Personal Care Products Market, By Types |
6.1 Peru Personal Care Products Market, By Product Type |
6.1.1 Overview and Analysis |
6.1.2 Peru Personal Care Products Market Revenues & Volume, By Product Type, 2022 - 2032F |
6.1.3 Peru Personal Care Products Market Revenues & Volume, By Skincare, 2022 - 2032F |
6.1.4 Peru Personal Care Products Market Revenues & Volume, By Haircare, 2022 - 2032F |
6.1.5 Peru Personal Care Products Market Revenues & Volume, By Oral Care, 2022 - 2032F |
6.1.6 Peru Personal Care Products Market Revenues & Volume, By Deodorants, 2022 - 2032F |
6.1.7 Peru Personal Care Products Market Revenues & Volume, By Fragrances, 2022 - 2032F |
6.2 Peru Personal Care Products Market, By Function |
6.2.1 Overview and Analysis |
6.2.2 Peru Personal Care Products Market Revenues & Volume, By Hydration, 2022 - 2032F |
6.2.3 Peru Personal Care Products Market Revenues & Volume, By Strengthening, 2022 - 2032F |
6.2.4 Peru Personal Care Products Market Revenues & Volume, By Whitening, 2022 - 2032F |
6.2.5 Peru Personal Care Products Market Revenues & Volume, By Odor Control, 2022 - 2032F |
6.2.6 Peru Personal Care Products Market Revenues & Volume, By Long-Lasting, 2022 - 2032F |
6.3 Peru Personal Care Products Market, By Consumer Preference |
6.3.1 Overview and Analysis |
6.3.2 Peru Personal Care Products Market Revenues & Volume, By Organic, 2022 - 2032F |
6.3.3 Peru Personal Care Products Market Revenues & Volume, By Vegan, 2022 - 2032F |
6.3.4 Peru Personal Care Products Market Revenues & Volume, By Sensitive Skin, 2022 - 2032F |
6.3.5 Peru Personal Care Products Market Revenues & Volume, By Aluminum-Free, 2022 - 2032F |
6.3.6 Peru Personal Care Products Market Revenues & Volume, By Natural, 2022 - 2032F |
6.4 Peru Personal Care Products Market, By Distribution Channel |
6.4.1 Overview and Analysis |
6.4.2 Peru Personal Care Products Market Revenues & Volume, By Online Retail, 2022 - 2032F |
6.4.3 Peru Personal Care Products Market Revenues & Volume, By Supermarkets, 2022 - 2032F |
6.4.4 Peru Personal Care Products Market Revenues & Volume, By Pharmacies, 2022 - 2032F |
6.4.5 Peru Personal Care Products Market Revenues & Volume, By Convenience Stores, 2022 - 2032F |
6.4.6 Peru Personal Care Products Market Revenues & Volume, By Department Stores, 2022 - 2032F |
6.5 Peru Personal Care Products Market, By Target Demographic |
6.5.1 Overview and Analysis |
6.5.2 Peru Personal Care Products Market Revenues & Volume, By Women, 2022 - 2032F |
6.5.3 Peru Personal Care Products Market Revenues & Volume, By Unisex, 2022 - 2032F |
6.5.4 Peru Personal Care Products Market Revenues & Volume, By Adults, 2022 - 2032F |
6.5.5 Peru Personal Care Products Market Revenues & Volume, By Men, 2022 - 2032F |
6.5.6 Peru Personal Care Products Market Revenues & Volume, By Teens, 2022 - 2032F |
7 Peru Personal Care Products Market Import-Export Trade Statistics |
7.1 Peru Personal Care Products Market Export to Major Countries |
7.2 Peru Personal Care Products Market Imports from Major Countries |
8 Peru Personal Care Products Market Key Performance Indicators |
8.1 Consumer engagement metrics such as website traffic, social media followers, and email newsletter subscriptions |
8.2 Product innovation rate, measured by the number of new product launches or improvements in existing products |
8.3 Customer satisfaction and retention rates, reflecting the quality and effectiveness of personal care products |
8.4 Sustainability metrics like packaging recyclability, use of eco-friendly ingredients, and carbon footprint reduction efforts |
9 Peru Personal Care Products Market - Opportunity Assessment |
9.1 Peru Personal Care Products Market Opportunity Assessment, By Product Type, 2022 & 2032F |
9.2 Peru Personal Care Products Market Opportunity Assessment, By Function, 2022 & 2032F |
9.3 Peru Personal Care Products Market Opportunity Assessment, By Consumer Preference, 2022 & 2032F |
9.4 Peru Personal Care Products Market Opportunity Assessment, By Distribution Channel, 2022 & 2032F |
9.5 Peru Personal Care Products Market Opportunity Assessment, By Target Demographic, 2022 & 2032F |
10 Peru Personal Care Products Market - Competitive Landscape |
10.1 Peru Personal Care Products Market Revenue Share, By Companies, 2025 |
10.2 Peru Personal Care Products Market Competitive Benchmarking, By Operating and Technical Parameters |
11 Company Profiles |
12 Recommendations |
13 Disclaimer |
Global Go To Market Strategy - 2030
Export potential enables firms to identify high-growth global markets with greater confidence by combining advanced trade intelligence with a structured quantitative methodology. The framework analyzes emerging demand trends and country-level import patterns while integrating macroeconomic and trade datasets such as GDP and population forecasts, bilateral import–export flows, tariff structures, elasticity differentials between developed and developing economies, geographic distance, and import demand projections. Using weighted trade values from 2020–2024 as the base period to project country-to-country export potential for 2030, these inputs are operationalized through calculated drivers such as gravity model parameters, tariff impact factors, and projected GDP per-capita growth. Through an analysis of hidden potentials, demand hotspots, and market conditions that are most favorable to success, this method enables firms to focus on target countries, maximize returns, and global expansion with data, backed by accuracy.
By factoring in the projected importer demand gap that is currently unmet and could be potential opportunity, it identifies the potential for the Exporter (Country) among 190 countries, against the general trade analysis, which identifies the biggest importer or exporter.
To discover high-growth global markets and optimize your business strategy:
Click Here
Pricing
- Single User License$ 1,995
- Department License$ 2,400
- Site License$ 3,120
- Global License$ 3,795

Leadership Perspectives from Industry Events
Search
Thought Leadership and Analyst Meet


Our Clients
6WResearch In News
- Doha a strategic location for EV manufacturing hub: IPA Qatar
- Demand for luxury TVs surging in the GCC, says Samsung
- Empowering Growth: The Thriving Journey of Bangladesh’s Cable Industry
- Demand for luxury TVs surging in the GCC, says Samsung
- Video call with a traditional healer? Once unthinkable, it’s now common in South Africa
- Intelligent Buildings To Smooth GCC’s Path To Net Zero
Latest Reports
- Taiwan Airport Wireless Infrastructure Market (2026-2032)
- Vietnam Airport Wireless Infrastructure Market (2026-2032)
- Thailand Airport Wireless Infrastructure Market (2026-2032)
- South Korea Airport Wireless Infrastructure Market (2026-2032)
- Romania Airport Wireless Infrastructure Market (2026-2032)
- Qatar Airport Wireless Infrastructure Market (2026-2032)
- Philippines Airport Wireless Infrastructure Market (2026-2032)
- Japan Airport Wireless Infrastructure Market (2026-2032)
- Taiwan Airport Winter Services Market (2026-2032)
- Vietnam Airport Winter Services Market (2026-2032)
Industry Events and Analyst Meet

HIMTEX 2026

India Refining Summit 2026

India EV Show 2026

EV tech India Expo 2026

Auto Tech Asia 2026
Whitepaper
- Middle East & Africa Commercial Security Market Click here to view more.
- Middle East & Africa Fire Safety Systems & Equipment Market Click here to view more.
- GCC Drone Market Click here to view more.
- Middle East Lighting Fixture Market Click here to view more.
- GCC Physical & Perimeter Security Market Click here to view more.