Peru Plastic Seals, Closures and Caps Market (2026-2032) | Companies, Trends, Share, Size, Outlook, Growth, Revenue, Analysis, COVID-19 IMPACT, Industry, Forecast & Value
Market Forecast By Product Type (Screw-on caps, Dispensing caps, Others), By Container Type (Plastic, Glass), By Technology Type (Compression molding, Injection molding, Post-mold TE band), By Raw Material (PP, HDPE, LDPE, Others), By End-User (Beverages, Food, Pharmaceuticals & healthcare, Personal & homecare, Others) And Competitive Landscape
| Product Code: ETC034166 | Publication Date: Jun 2023 | Updated Date: Jun 2026 | Product Type: Report | |
| Publisher: 6Wresearch | Author: Ravi Bhandari | No. of Pages: 70 | No. of Figures: 35 | No. of Tables: 5 |
Peru Plastic Seals, Closures and Caps Market Summary
The peru plastic seals, closures and caps market was estimated at USD 267 Million in 2025 and is projected to reach USD 367 Million by 2032, growing at a CAGR of 5.6% from 2026 to 2032.
Peru Plastic Seals, Closures and Caps Market Growth Rate Analysis (2021-2032)
The Peru plastic seals, closures, and caps market has exhibited a stable growth pattern, with yearly increases averaging between 5.2% and 5.7% from 2021 to 2032. This growth can be attributed to rising consumer demand driven by the booming food and beverage sector, coupled with advancements in manufacturing technologies that enhance product quality and sustainability. For instance, in 2024 and 2025, growth is projected at 5.5%, reflecting significant investments in eco-friendly materials as businesses adapt to stricter environmental regulations and consumer preferences for sustainable packaging. The fluctuations, particularly the slight dip to 5.2% in 2028, may reflect broader economic conditions or market saturation, but overall, the sector remains robust as it benefits from ongoing digitalization and infrastructure development.
Peru Plastic Seals, Closures and Caps Market Year-wise Growth Rate and Key Drivers
This graph highlights how the Peru Plastic Seals, Closures and Caps Market has steadily grown over the past five years, supported by major growth factors.
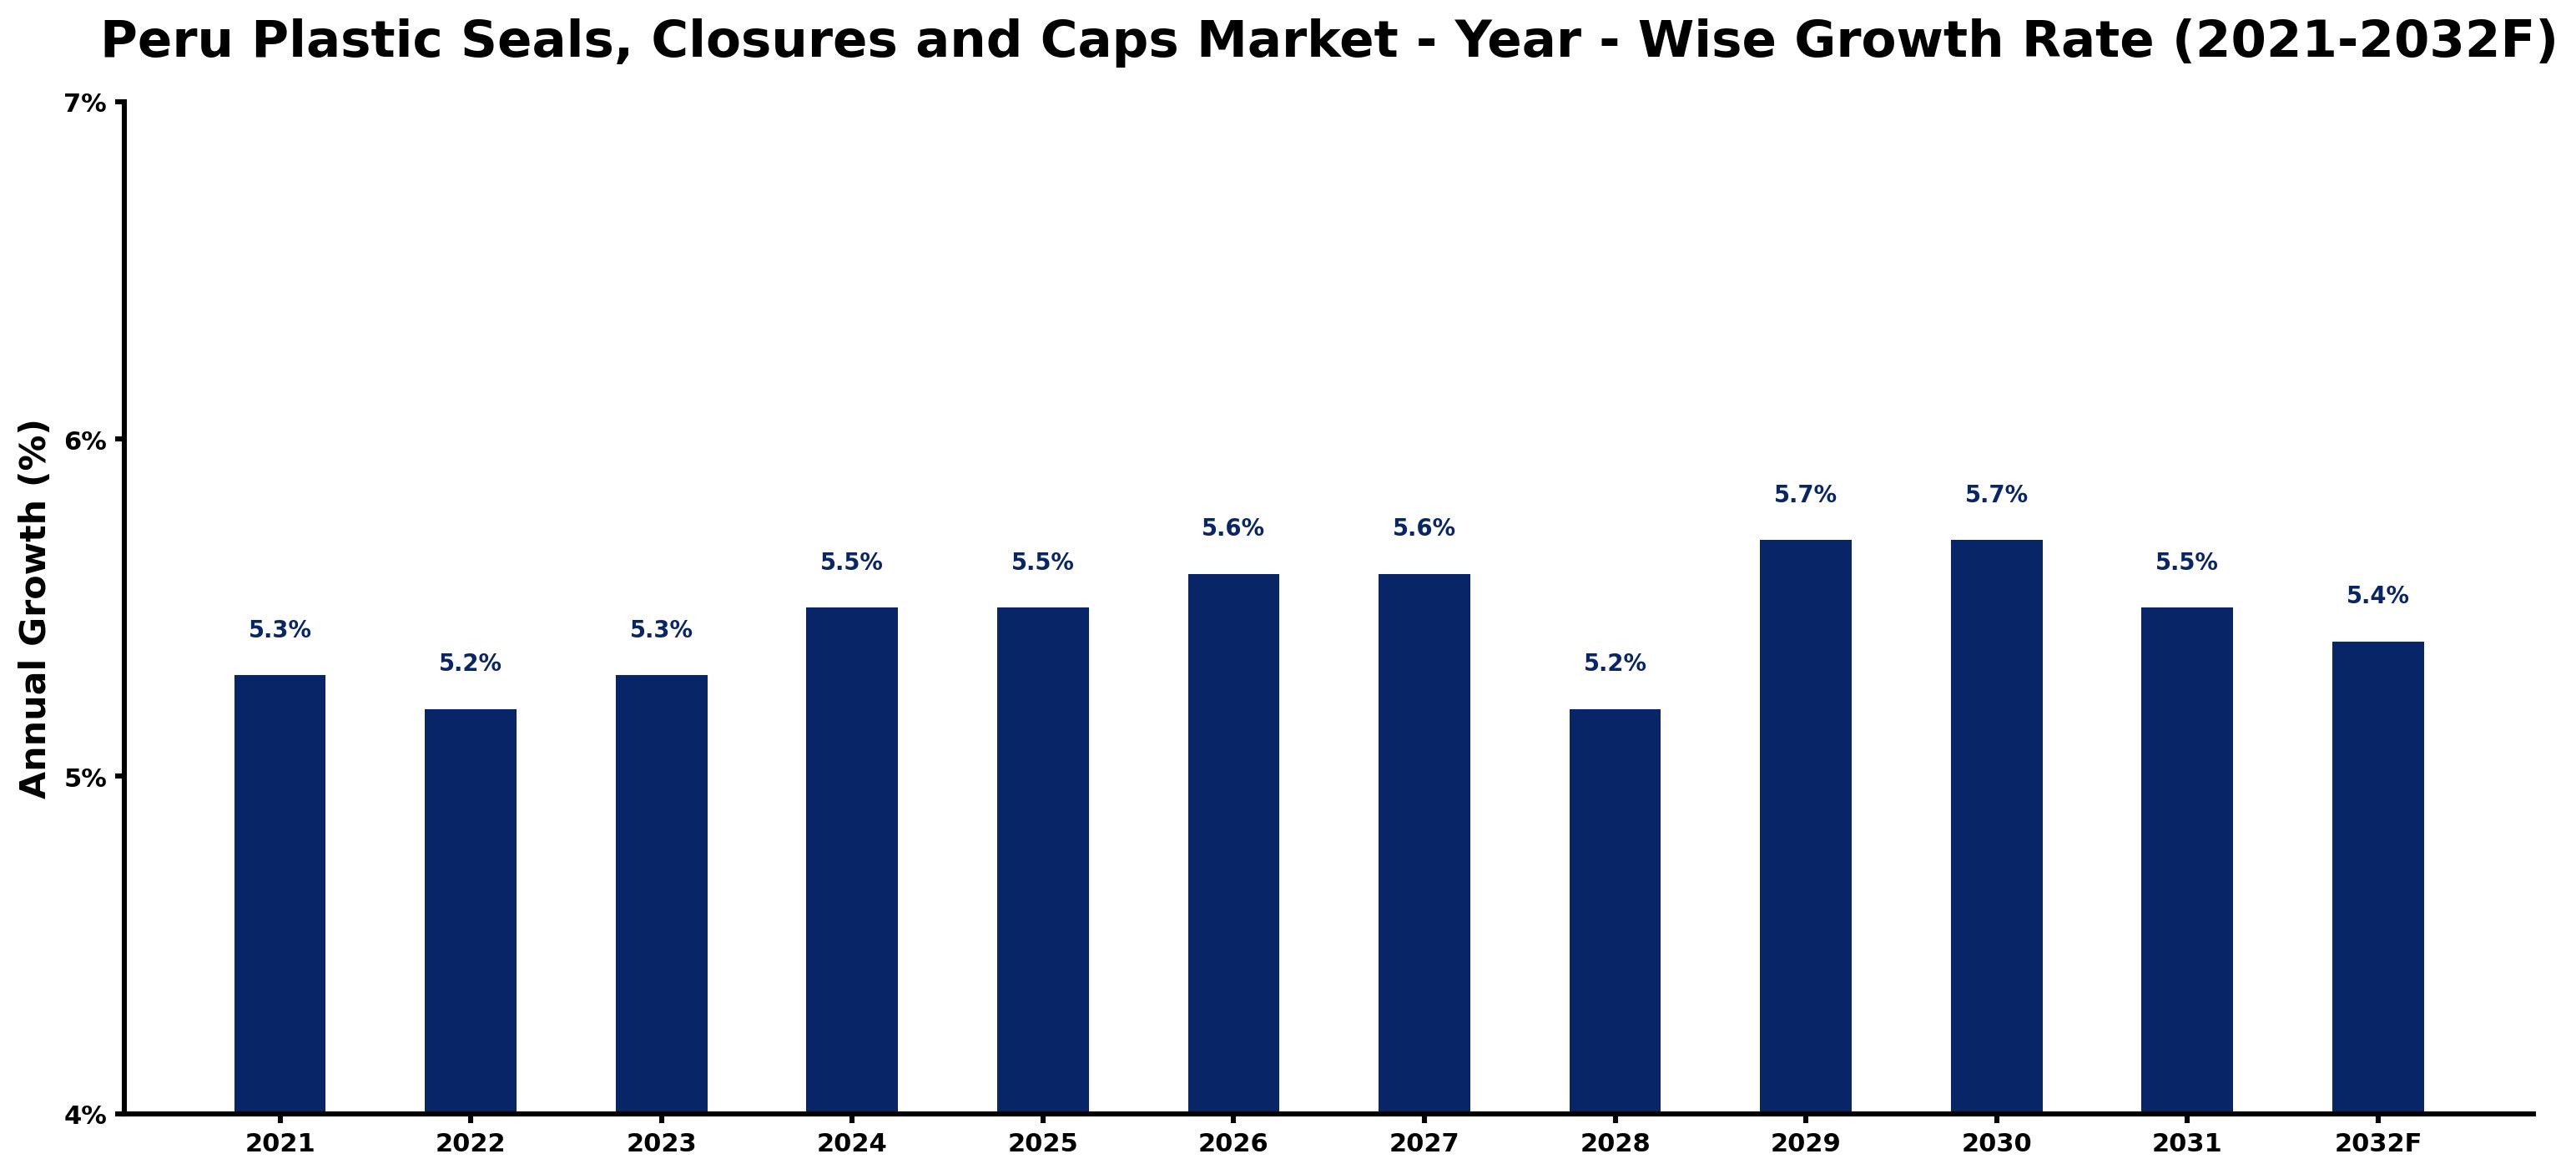
The table below presents the year wise growth rates along with the key drivers influencing the market
| Year | Growth Rate | Major Drivers |
| 2021 | 5.3% | The shift towards sustainable packaging solutions gained traction amid environmental consciousness. |
| 2022 | 5.2% | Local manufacturing capabilities strengthened due to increased import tariffs on plastic goods. |
| 2023 | 5.3% | E-commerce sales surged, driving demand for reliable seals and closures in logistics. |
| 2024 | 5.5% | Consumer preferences shifted towards convenience, boosting single-use packaging options significantly. |
| 2025 | 5.5% | Collaborations between brands and local producers fostered innovation in closure designs. |
| 2026 | 5.6% | Investment in recycling facilities improved circular economy initiatives within the plastic sector. |
| 2027 | 5.6% | Increased urbanization created a larger market for packaged consumer goods across cities. |
| 2028 | 5.2% | Health and safety standards pushed companies to enhance the quality of packaging solutions. |
| 2029 | 5.7% | Technological innovations in production efficiency reduced costs and improved product availability. |
| 2030 | 5.7% | The emergence of biodegradable materials provided new opportunities in sustainable packaging. |
| 2031 | 5.5% | Export opportunities expanded as Peru's economy stabilized, increasing demand abroad. |
| 2032 | 5.4% | Consumer awareness of anti-plastic movements influenced brands to adapt their packaging strategies. |
Note - Market size estimations and growth projections presented in this report are based on 6Wresearch's advanced forecasting approach, validated with industry datasets as of June 2026.
Peru Plastic Seals, Closures and Caps Market Synopsis
The Peru Plastic Seals, Closures and Caps Market is projected to reach 5.6% and witness significant growth during the forecast period (2026-2032). The increasing demand for food packaging products incorporating these components is a primary growth driver for the market. This demand is significantly influenced by changing consumer preferences, particularly the rising inclination towards convenience food products. Moreover, the shift towards sustainable and eco-friendly packaging materials is encouraging manufacturers to innovate and adapt their offerings, ultimately enhancing sales volumes within this sector.
Peru Plastic Seals, Closures and Caps Market Growth Drivers
Several key factors are contributing to the growth of the Peru Plastic Seals, Closures and Caps Market. Among these, the following drivers stand out:
- The heightened awareness among consumers regarding packaging sustainability is pushing manufacturers to adopt eco-friendly materials, leading to increased demand for innovative sealing solutions.
- Technological advancements such as barrier technology and improved tamper evidence systems are enhancing product functionality, thereby attracting manufacturers and consumers alike.
- Expanding urbanization and an increase in the working-class population is fostering a demand for convenience food products, which rely heavily on efficient packaging solutions.
- The growth of the e-commerce sector in Peru has increased the necessity for reliable seals and closures that ensure product integrity during transit.
- A continuous rise in food safety standards and regulations is compelling manufacturers to invest in quality packaging solutions, further driving market growth.
Peru Plastic Seals, Closures and Caps Market Trends and Opportunities
As the Peru Plastic Seals, Closures and Caps Market evolves, several trends and opportunities are emerging that manufacturers can leverage for sustained growth. Notably:
- There is a growing trend towards personalization in packaging, allowing brands to differentiate their products and cater to niche markets.
- The integration of smart packaging technologies, such as QR codes and intelligent sensors, is gaining traction, offering new avenues for enhancing consumer engagement.
- Consumer demand for minimalistic and aesthetically pleasing packaging is driving innovation in design, leading manufacturers to explore new shapes and functionalities.
- The increasing focus on biodegradable and compostable materials is presenting opportunities for companies to align their products with eco-conscious consumer preferences.
- Rising investments in R&D for advanced closure technologies are likely to result in more durable and efficient packaging solutions.
Peru Plastic Seals, Closures and Caps Market Challenges and Restraints
Despite the promising growth, the Peru Plastic Seals, Closures and Caps Market faces several challenges and restraints:
- Competition from alternative packaging materials, including glass and metal, poses a significant challenge to plastic packaging solutions.
- The fluctuating prices of raw materials used in the production of plastic seals and closures can impact profit margins for manufacturers.
- Environmental regulations regarding plastic waste and recycling can limit the availability of certain materials, creating barriers for market participants.
- Consumer backlash against plastic usage due to environmental concerns can negatively influence market demand.
- The market's reliance on the food and beverage sector means that any downturn in that industry could adversely affect growth prospects.
Peru Plastic Seals, Closures and Caps Market Government Investment and Initiatives
The Peruvian government has undertaken several initiatives aimed at fostering growth within the packaging sector, particularly in the area of plastic seals, closures, and caps. These initiatives include:
- Implementation of policies promoting sustainable packaging solutions aims to reduce environmental impacts associated with plastic waste.
- Increased public spending on infrastructure development and modernization in the packaging industry is expected to enhance production capabilities and efficiency.
- Government incentives for manufacturers adopting innovative technologies are encouraging businesses to invest in R&D.
- Strengthening regulations on food safety and quality assurance emphasizes the importance of high-quality packaging, further supporting market growth.
- Collaborations between public and private sectors are fostering knowledge-sharing and development of industry standards, contributing to overall market health.
Peru Plastic Seals, Closures and Caps Market Latest Developments (May 2025 - June 2026)
Recent developments in the Peru Plastic Seals, Closures and Caps Market indicate a robust response to evolving consumer demands and market dynamics. Over the period from May 2025 to June 2026, several noteworthy trends have surfaced:
- Increased interest in sustainable practices has prompted manufacturers to explore alternative materials, achieving a notable shift towards biodegradable options.
- Technological innovations have been introduced, particularly in tamper-evident packaging, enhancing consumer trust and ensuring product security.
- The impact of e-commerce growth is evident, with new solutions designed for optimal product protection during shipping becoming more prevalent.
- Consumer preferences shifted towards more sophisticated and aesthetically appealing packaging, leading to innovative design solutions in the market.
- Collaboration among industry stakeholders has strengthened, focusing on developing comprehensive strategies to address environmental challenges and consumer expectations.
Peru Plastic Seals, Closures and Caps Market - Key Attractiveness of the Report
- 10 Years of Market Numbers
- Historical Data Starting from 2022 to 2025
- Base Year: 2025
- Forecast Data until 2032
- Key Performance Indicators Impacting the Market
- Major Upcoming Developments and Projects
Key Highlights of the Report:
- Peru Plastic Seals, Closures and Caps Market Outlook
- Market Size of Peru Plastic Seals, Closures and Caps Market, 2025
- Forecast of Peru Plastic Seals, Closures and Caps Market, 2032F
- Historical Data and Forecast of Peru Plastic Seals, Closures and Caps Revenues & Volume for the Period 2022-2032F
- Peru Plastic Seals, Closures and Caps Market Trend Evolution
- Peru Plastic Seals, Closures and Caps Market Drivers and Challenges
- Peru Plastic Seals, Closures and Caps Price Trends
- Peru Plastic Seals, Closures and Caps Porter's Five Forces
- Peru Plastic Seals, Closures and Caps Industry Life Cycle
- Historical Data and Forecast of Peru Plastic Seals, Closures and Caps Market Revenues & Volume By Product Type for the Period 2022-2032F
- Historical Data and Forecast of Peru Plastic Seals, Closures and Caps Market Revenues & Volume By Screw-on caps for the Period 2022-2032F
- Historical Data and Forecast of Peru Plastic Seals, Closures and Caps Market Revenues & Volume By Dispensing caps for the Period 2022-2032F
- Historical Data and Forecast of Peru Plastic Seals, Closures and Caps Market Revenues & Volume By Others for the Period 2022-2032F
- Historical Data and Forecast of Peru Plastic Seals, Closures and Caps Market Revenues & Volume By Container Type for the Period 2022-2032F
- Historical Data and Forecast of Peru Plastic Seals, Closures and Caps Market Revenues & Volume By Plastic for the Period 2022-2032F
- Historical Data and Forecast of Peru Plastic Seals, Closures and Caps Market Revenues & Volume By Glass for the Period 2022-2032F
- Historical Data and Forecast of Peru Plastic Seals, Closures and Caps Market Revenues & Volume By Technology Type for the Period 2022-2032F
- Historical Data and Forecast of Peru Plastic Seals, Closures and Caps Market Revenues & Volume By Compression molding for the Period 2022-2032F
- Historical Data and Forecast of Peru Plastic Seals, Closures and Caps Market Revenues & Volume By Injection molding for the Period 2022-2032F
- Historical Data and Forecast of Peru Plastic Seals, Closures and Caps Market Revenues & Volume By Post-mold TE band for the Period 2022-2032F
- Historical Data and Forecast of Peru Plastic Seals, Closures and Caps Market Revenues & Volume By Raw Material for the Period 2022-2032F
- Historical Data and Forecast of Peru Plastic Seals, Closures and Caps Market Revenues & Volume By PP for the Period 2022-2032F
- Historical Data and Forecast of Peru Plastic Seals, Closures and Caps Market Revenues & Volume By HDPE for the Period 2022-2032F
- Historical Data and Forecast of Peru Plastic Seals, Closures and Caps Market Revenues & Volume By LDPE for the Period 2022-2032F
- Historical Data and Forecast of Peru Plastic Seals, Closures and Caps Market Revenues & Volume By Others for the Period 2022-2032F
- Historical Data and Forecast of Peru Plastic Seals, Closures and Caps Market Revenues & Volume By End-User for the Period 2022-2032F
- Historical Data and Forecast of Peru Plastic Seals, Closures and Caps Market Revenues & Volume By Beverages for the Period 2022-2032F
- Historical Data and Forecast of Peru Plastic Seals, Closures and Caps Market Revenues & Volume By Food for the Period 2022-2032F
- Historical Data and Forecast of Peru Plastic Seals, Closures and Caps Market Revenues & Volume By Pharmaceuticals & healthcare for the Period 2022-2032F
- Historical Data and Forecast of Peru Plastic Seals, Closures and Caps Market Revenues & Volume By Personal & homecare for the Period 2022-2032F
- Historical Data and Forecast of Peru Plastic Seals, Closures and Caps Market Revenues & Volume By Others for the Period 2022-2032F
- Peru Plastic Seals, Closures and Caps Import Export Trade Statistics
- Market Opportunity Assessment By Product Type
- Market Opportunity Assessment By Container Type
- Market Opportunity Assessment By Technology Type
- Market Opportunity Assessment By Raw Material
- Market Opportunity Assessment By End-User
- Peru Plastic Seals, Closures and Caps Top Companies Market Share
- Peru Plastic Seals, Closures and Caps Competitive Benchmarking By Technical and Operational Parameters
- Peru Plastic Seals, Closures and Caps Company Profiles
- Peru Plastic Seals, Closures and Caps Key Strategic Recommendations
Frequently Asked Questions About the Market Study (FAQs):
The growth is primarily driven by the demand for food packaging, convenience products, and innovations in sustainable materials.
Technological advancements, such as barrier technologies and tamper-evident systems, are enhancing product security and performance, creating new opportunities in the market.
Key challenges include competition from alternative materials, fluctuating raw material prices, and increasing regulations regarding plastic waste and recycling.
Yes, the government is implementing policies aimed at promoting sustainability and investing in infrastructure, which ultimately supports growth in the packaging sector.
6Wresearch actively monitors the Peru Plastic Seals, Closures and Caps Market and publishes its comprehensive annual report, highlighting emerging trends, growth drivers, revenue analysis, and forecast outlook. Our insights help businesses to make data-backed strategic decisions with ongoing market dynamics. Our analysts track relevent industries related to the Peru Plastic Seals, Closures and Caps Market, allowing our clients with actionable intelligence and reliable forecasts tailored to emerging regional needs.
Yes, we provide customisation as per your requirements. To learn more, feel free to contact us on sales@6wresearch.com
1 Executive Summary |
2 Introduction |
2.1 Key Highlights of the Report |
2.2 Report Description |
2.3 Market Scope & Segmentation |
2.4 Research Methodology |
2.5 Assumptions |
3 Peru Plastic Seals, Closures and Caps Market Overview |
3.1 Peru Country Macro Economic Indicators |
3.2 Peru Plastic Seals, Closures and Caps Market Revenues & Volume, 2022 & 2032F |
3.3 Peru Plastic Seals, Closures and Caps Market - Industry Life Cycle |
3.4 Peru Plastic Seals, Closures and Caps Market - Porter's Five Forces |
3.5 Peru Plastic Seals, Closures and Caps Market Revenues & Volume Share, By Product Type, 2022 & 2032F |
3.6 Peru Plastic Seals, Closures and Caps Market Revenues & Volume Share, By Container Type, 2022 & 2032F |
3.7 Peru Plastic Seals, Closures and Caps Market Revenues & Volume Share, By Technology Type, 2022 & 2032F |
3.8 Peru Plastic Seals, Closures and Caps Market Revenues & Volume Share, By Raw Material, 2022 & 2032F |
3.9 Peru Plastic Seals, Closures and Caps Market Revenues & Volume Share, By End-User, 2022 & 2032F |
4 Peru Plastic Seals, Closures and Caps Market Dynamics |
4.1 Impact Analysis |
4.2 Market Drivers |
4.3 Market Restraints |
5 Peru Plastic Seals, Closures and Caps Market Trends |
6 Peru Plastic Seals, Closures and Caps Market, By Types |
6.1 Peru Plastic Seals, Closures and Caps Market, By Product Type |
6.1.1 Overview and Analysis |
6.1.2 Peru Plastic Seals, Closures and Caps Market Revenues & Volume, By Product Type, 2022-2032F |
6.1.3 Peru Plastic Seals, Closures and Caps Market Revenues & Volume, By Screw-on caps, 2022-2032F |
6.1.4 Peru Plastic Seals, Closures and Caps Market Revenues & Volume, By Dispensing caps, 2022-2032F |
6.1.5 Peru Plastic Seals, Closures and Caps Market Revenues & Volume, By Others, 2022-2032F |
6.2 Peru Plastic Seals, Closures and Caps Market, By Container Type |
6.2.1 Overview and Analysis |
6.2.2 Peru Plastic Seals, Closures and Caps Market Revenues & Volume, By Plastic, 2022-2032F |
6.2.3 Peru Plastic Seals, Closures and Caps Market Revenues & Volume, By Glass, 2022-2032F |
6.3 Peru Plastic Seals, Closures and Caps Market, By Technology Type |
6.3.1 Overview and Analysis |
6.3.2 Peru Plastic Seals, Closures and Caps Market Revenues & Volume, By Compression molding, 2022-2032F |
6.3.3 Peru Plastic Seals, Closures and Caps Market Revenues & Volume, By Injection molding, 2022-2032F |
6.3.4 Peru Plastic Seals, Closures and Caps Market Revenues & Volume, By Post-mold TE band, 2022-2032F |
6.4 Peru Plastic Seals, Closures and Caps Market, By Raw Material |
6.4.1 Overview and Analysis |
6.4.2 Peru Plastic Seals, Closures and Caps Market Revenues & Volume, By PP, 2022-2032F |
6.4.3 Peru Plastic Seals, Closures and Caps Market Revenues & Volume, By HDPE, 2022-2032F |
6.4.4 Peru Plastic Seals, Closures and Caps Market Revenues & Volume, By LDPE, 2022-2032F |
6.4.5 Peru Plastic Seals, Closures and Caps Market Revenues & Volume, By Others, 2022-2032F |
6.5 Peru Plastic Seals, Closures and Caps Market, By End-User |
6.5.1 Overview and Analysis |
6.5.2 Peru Plastic Seals, Closures and Caps Market Revenues & Volume, By Beverages, 2022-2032F |
6.5.3 Peru Plastic Seals, Closures and Caps Market Revenues & Volume, By Food, 2022-2032F |
6.5.4 Peru Plastic Seals, Closures and Caps Market Revenues & Volume, By Pharmaceuticals & healthcare, 2022-2032F |
6.5.5 Peru Plastic Seals, Closures and Caps Market Revenues & Volume, By Personal & homecare, 2022-2032F |
6.5.6 Peru Plastic Seals, Closures and Caps Market Revenues & Volume, By Others, 2022-2032F |
7 Peru Plastic Seals, Closures and Caps Market Import-Export Trade Statistics |
7.1 Peru Plastic Seals, Closures and Caps Market Export to Major Countries |
7.2 Peru Plastic Seals, Closures and Caps Market Imports from Major Countries |
8 Peru Plastic Seals, Closures and Caps Market Key Performance Indicators |
9 Peru Plastic Seals, Closures and Caps Market - Opportunity Assessment |
9.1 Peru Plastic Seals, Closures and Caps Market Opportunity Assessment, By Product Type, 2022 & 2032F |
9.2 Peru Plastic Seals, Closures and Caps Market Opportunity Assessment, By Container Type, 2022 & 2032F |
9.3 Peru Plastic Seals, Closures and Caps Market Opportunity Assessment, By Technology Type, 2022 & 2032F |
9.4 Peru Plastic Seals, Closures and Caps Market Opportunity Assessment, By Raw Material, 2022 & 2032F |
9.5 Peru Plastic Seals, Closures and Caps Market Opportunity Assessment, By End-User, 2022 & 2032F |
10 Peru Plastic Seals, Closures and Caps Market - Competitive Landscape |
10.1 Peru Plastic Seals, Closures and Caps Market Revenue Share, By Companies, 2025 |
10.2 Peru Plastic Seals, Closures and Caps Market Competitive Benchmarking, By Operating and Technical Parameters |
11 Company Profiles |
12 Recommendations |
13 Disclaimer |
Global Go To Market Strategy - 2030
Export potential enables firms to identify high-growth global markets with greater confidence by combining advanced trade intelligence with a structured quantitative methodology. The framework analyzes emerging demand trends and country-level import patterns while integrating macroeconomic and trade datasets such as GDP and population forecasts, bilateral import–export flows, tariff structures, elasticity differentials between developed and developing economies, geographic distance, and import demand projections. Using weighted trade values from 2020–2024 as the base period to project country-to-country export potential for 2030, these inputs are operationalized through calculated drivers such as gravity model parameters, tariff impact factors, and projected GDP per-capita growth. Through an analysis of hidden potentials, demand hotspots, and market conditions that are most favorable to success, this method enables firms to focus on target countries, maximize returns, and global expansion with data, backed by accuracy.
By factoring in the projected importer demand gap that is currently unmet and could be potential opportunity, it identifies the potential for the Exporter (Country) among 190 countries, against the general trade analysis, which identifies the biggest importer or exporter.
To discover high-growth global markets and optimize your business strategy:
Click Here
Pricing
- Single User License$ 1,995
- Department License$ 2,400
- Site License$ 3,120
- Global License$ 3,795

Leadership Perspectives from Industry Events
Search
Thought Leadership and Analyst Meet


Our Clients
6WResearch In News
- India Air Conditioner Market Set for Strong Rebound in 2026 After Weather-Led Correction and GST-Driven Recovery: 6Wresearch
- ADAS in India: How Automatic Emergency Braking, Blind Spot Detection & Driver Monitoring are Transforming Road Safety
- Doha a strategic location for EV manufacturing hub: IPA Qatar
- Demand for luxury TVs surging in the GCC, says Samsung
- Empowering Growth: The Thriving Journey of Bangladesh’s Cable Industry
- Demand for luxury TVs surging in the GCC, says Samsung
Latest Reports
- Nicaragua RPG Gaming Market (2026-2032)
- New Zealand RPG Gaming Market (2026-2032)
- Netherlands RPG Gaming Market (2026-2032)
- Nauru RPG Gaming Market (2026-2032)
- Namibia RPG Gaming Market (2026-2032)
- Mozambique RPG Gaming Market (2026-2032)
- Montenegro RPG Gaming Market (2026-2032)
- Mongolia RPG Gaming Market (2026-2032)
- Monaco RPG Gaming Market (2026-2032)
- Micronesia RPG Gaming Market (2026-2032)
Industry Events and Analyst Meet

HIMTEX 2026

India Refining Summit 2026

India EV Show 2026

EV tech India Expo 2026

Auto Tech Asia 2026
Whitepaper
- Middle East & Africa Commercial Security Market Click here to view more.
- Middle East & Africa Fire Safety Systems & Equipment Market Click here to view more.
- GCC Drone Market Click here to view more.
- Middle East Lighting Fixture Market Click here to view more.
- GCC Physical & Perimeter Security Market Click here to view more.