Peru Small Cell Market (2026-2032) | Industry, Supply, Opportunities, Segmentation, Drivers, Competitive, Restraints, Size, Share, Competition, Growth, Outlook, Pricing Analysis, Value, Challenges, Revenue, Investment Trends, Companies, Segments, Strategy, Consumer Insights, Analysis, Strategic Insights, Forecast, Trends, Demand
Market Forecast By Type (Femtocells, Picocells, Microcells, Metrocells, Enterprise Small Cells), By Network Type (4G LTE, 5G Standalone, 5G Non-Standalone, Private Networks, Cloud-RAN), By Application (Indoor Coverage, Outdoor Coverage, Industrial IoT, Public Venues, Stadiums), By Technology (Carrier Aggregation, mmWave, CBRS, Beamforming, Dynamic Spectrum Sharing), By End User (Residential, Enterprises, Smart Cities, Airports, Hospitals) And Competitive Landscape
| Product Code: ETC10813536 | Publication Date: Apr 2025 | Updated Date: Apr 2026 | Product Type: Market Research Report | |
| Publisher: 6Wresearch | No. of Pages: 65 | No. of Figures: 34 | No. of Tables: 19 | |
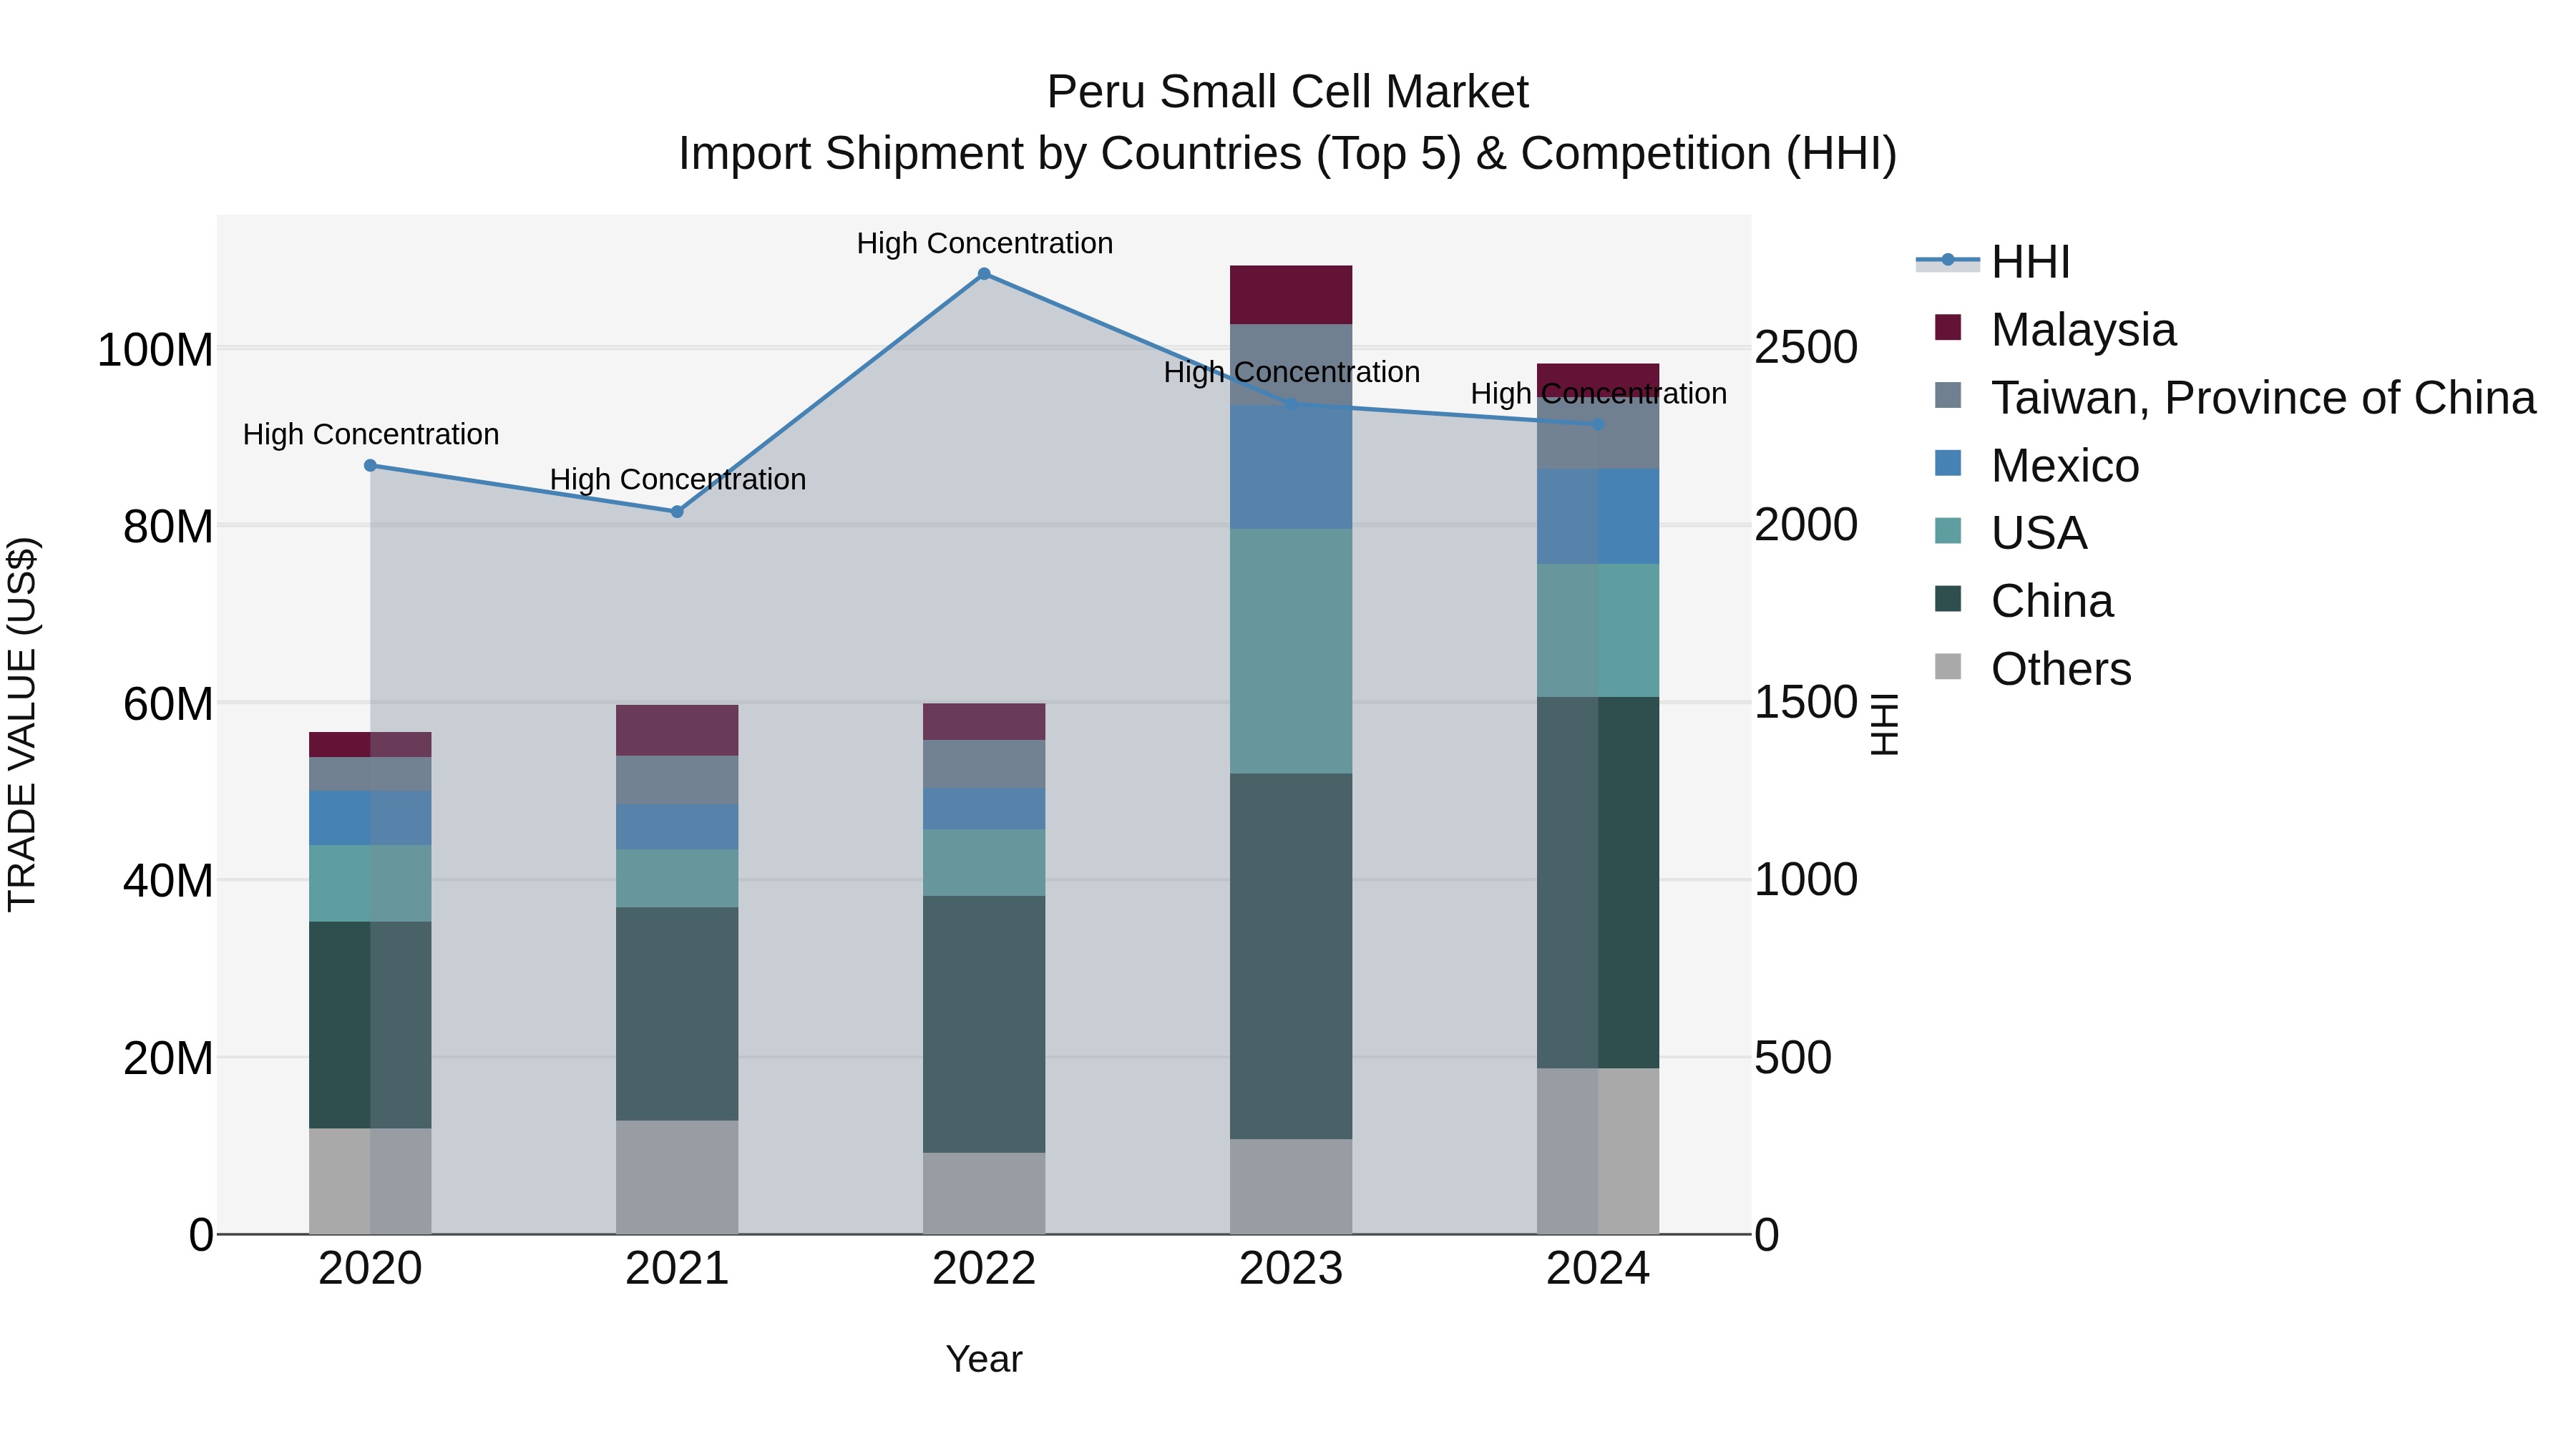
Peru Small Cell Market Top 5 Importing Countries and Market Competition (HHI) Analysis
In 2024, Peru continued to see significant import shipments of small cells, with top exporters being China, USA, Mexico, Taiwan, and Malaysia. Despite a high Herfindahl-Hirschman Index indicating market concentration, the industry maintained a strong compound annual growth rate (CAGR) of 14.74% from 2020 to 2024. However, there was a slight decline in growth rate from 2023 to 2024 at -10.11%. The market dynamics suggest a competitive landscape with key players dominating the small cell import market in Peru, driving both growth and concentration in the industry.
Key Highlights of the Report:
- Peru Small Cell Market Outlook
- Market Size of Peru Small Cell Market, 2025
- Forecast of Peru Small Cell Market, 2032
- Historical Data and Forecast of Peru Small Cell Revenues & Volume for the Period 2022 - 2032F
- Peru Small Cell Market Trend Evolution
- Peru Small Cell Market Drivers and Challenges
- Peru Small Cell Price Trends
- Peru Small Cell Porter's Five Forces
- Peru Small Cell Industry Life Cycle
- Historical Data and Forecast of Peru Small Cell Market Revenues & Volume By Type for the Period 2022 - 2032F
- Historical Data and Forecast of Peru Small Cell Market Revenues & Volume By Femtocells for the Period 2022 - 2032F
- Historical Data and Forecast of Peru Small Cell Market Revenues & Volume By Picocells for the Period 2022 - 2032F
- Historical Data and Forecast of Peru Small Cell Market Revenues & Volume By Microcells for the Period 2022 - 2032F
- Historical Data and Forecast of Peru Small Cell Market Revenues & Volume By Metrocells for the Period 2022 - 2032F
- Historical Data and Forecast of Peru Small Cell Market Revenues & Volume By Enterprise Small Cells for the Period 2022 - 2032F
- Historical Data and Forecast of Peru Small Cell Market Revenues & Volume By Network Type for the Period 2022 - 2032F
- Historical Data and Forecast of Peru Small Cell Market Revenues & Volume By 4G LTE for the Period 2022 - 2032F
- Historical Data and Forecast of Peru Small Cell Market Revenues & Volume By 5G Standalone for the Period 2022 - 2032F
- Historical Data and Forecast of Peru Small Cell Market Revenues & Volume By 5G Non-Standalone for the Period 2022 - 2032F
- Historical Data and Forecast of Peru Small Cell Market Revenues & Volume By Private Networks for the Period 2022 - 2032F
- Historical Data and Forecast of Peru Small Cell Market Revenues & Volume By Cloud-RAN for the Period 2022 - 2032F
- Historical Data and Forecast of Peru Small Cell Market Revenues & Volume By Application for the Period 2022 - 2032F
- Historical Data and Forecast of Peru Small Cell Market Revenues & Volume By Indoor Coverage for the Period 2022 - 2032F
- Historical Data and Forecast of Peru Small Cell Market Revenues & Volume By Outdoor Coverage for the Period 2022 - 2032F
- Historical Data and Forecast of Peru Small Cell Market Revenues & Volume By Industrial IoT for the Period 2022 - 2032F
- Historical Data and Forecast of Peru Small Cell Market Revenues & Volume By Public Venues for the Period 2022 - 2032F
- Historical Data and Forecast of Peru Small Cell Market Revenues & Volume By Stadiums for the Period 2022 - 2032F
- Historical Data and Forecast of Peru Small Cell Market Revenues & Volume By Technology for the Period 2022 - 2032F
- Historical Data and Forecast of Peru Small Cell Market Revenues & Volume By Carrier Aggregation for the Period 2022 - 2032F
- Historical Data and Forecast of Peru Small Cell Market Revenues & Volume By mmWave for the Period 2022 - 2032F
- Historical Data and Forecast of Peru Small Cell Market Revenues & Volume By CBRS for the Period 2022 - 2032F
- Historical Data and Forecast of Peru Small Cell Market Revenues & Volume By Beamforming for the Period 2022 - 2032F
- Historical Data and Forecast of Peru Small Cell Market Revenues & Volume By Dynamic Spectrum Sharing for the Period 2022 - 2032F
- Historical Data and Forecast of Peru Small Cell Market Revenues & Volume By End User for the Period 2022 - 2032F
- Historical Data and Forecast of Peru Small Cell Market Revenues & Volume By Residential for the Period 2022 - 2032F
- Historical Data and Forecast of Peru Small Cell Market Revenues & Volume By Enterprises for the Period 2022 - 2032F
- Historical Data and Forecast of Peru Small Cell Market Revenues & Volume By Smart Cities for the Period 2022 - 2032F
- Historical Data and Forecast of Peru Small Cell Market Revenues & Volume By Airports for the Period 2022 - 2032F
- Historical Data and Forecast of Peru Small Cell Market Revenues & Volume By Hospitals for the Period 2022 - 2032F
- Peru Small Cell Import Export Trade Statistics
- Market Opportunity Assessment By Type
- Market Opportunity Assessment By Network Type
- Market Opportunity Assessment By Application
- Market Opportunity Assessment By Technology
- Market Opportunity Assessment By End User
- Peru Small Cell Top Companies Market Share
- Peru Small Cell Competitive Benchmarking By Technical and Operational Parameters
- Peru Small Cell Company Profiles
- Peru Small Cell Key Strategic Recommendations
Frequently Asked Questions About the Market Study (FAQs):
6Wresearch actively monitors the Peru Small Cell Market and publishes its comprehensive annual report, highlighting emerging trends, growth drivers, revenue analysis, and forecast outlook. Our insights help businesses to make data-backed strategic decisions with ongoing market dynamics. Our analysts track relevent industries related to the Peru Small Cell Market, allowing our clients with actionable intelligence and reliable forecasts tailored to emerging regional needs.
Yes, we provide customisation as per your requirements. To learn more, feel free to contact us on sales@6wresearch.com
1 Executive Summary |
2 Introduction |
2.1 Key Highlights of the Report |
2.2 Report Description |
2.3 Market Scope & Segmentation |
2.4 Research Methodology |
2.5 Assumptions |
3 Peru Small Cell Market Overview |
3.1 Peru Country Macro Economic Indicators |
3.2 Peru Small Cell Market Revenues & Volume, 2022 & 2032F |
3.3 Peru Small Cell Market - Industry Life Cycle |
3.4 Peru Small Cell Market - Porter's Five Forces |
3.5 Peru Small Cell Market Revenues & Volume Share, By Type, 2022 & 2032F |
3.6 Peru Small Cell Market Revenues & Volume Share, By Network Type, 2022 & 2032F |
3.7 Peru Small Cell Market Revenues & Volume Share, By Application, 2022 & 2032F |
3.8 Peru Small Cell Market Revenues & Volume Share, By Technology, 2022 & 2032F |
3.9 Peru Small Cell Market Revenues & Volume Share, By End User, 2022 & 2032F |
4 Peru Small Cell Market Dynamics |
4.1 Impact Analysis |
4.2 Market Drivers |
4.2.1 Increasing demand for improved network coverage and capacity in urban areas |
4.2.2 Growing adoption of smart devices and mobile data services |
4.2.3 Government initiatives to improve telecom infrastructure and connectivity |
4.3 Market Restraints |
4.3.1 High initial investment and deployment costs for small cell technology |
4.3.2 Limited availability of suitable infrastructure for small cell deployment in certain regions |
5 Peru Small Cell Market Trends |
6 Peru Small Cell Market, By Types |
6.1 Peru Small Cell Market, By Type |
6.1.1 Overview and Analysis |
6.1.2 Peru Small Cell Market Revenues & Volume, By Type, 2022 - 2032F |
6.1.3 Peru Small Cell Market Revenues & Volume, By Femtocells, 2022 - 2032F |
6.1.4 Peru Small Cell Market Revenues & Volume, By Picocells, 2022 - 2032F |
6.1.5 Peru Small Cell Market Revenues & Volume, By Microcells, 2022 - 2032F |
6.1.6 Peru Small Cell Market Revenues & Volume, By Metrocells, 2022 - 2032F |
6.1.7 Peru Small Cell Market Revenues & Volume, By Enterprise Small Cells, 2022 - 2032F |
6.2 Peru Small Cell Market, By Network Type |
6.2.1 Overview and Analysis |
6.2.2 Peru Small Cell Market Revenues & Volume, By 4G LTE, 2022 - 2032F |
6.2.3 Peru Small Cell Market Revenues & Volume, By 5G Standalone, 2022 - 2032F |
6.2.4 Peru Small Cell Market Revenues & Volume, By 5G Non-Standalone, 2022 - 2032F |
6.2.5 Peru Small Cell Market Revenues & Volume, By Private Networks, 2022 - 2032F |
6.2.6 Peru Small Cell Market Revenues & Volume, By Cloud-RAN, 2022 - 2032F |
6.3 Peru Small Cell Market, By Application |
6.3.1 Overview and Analysis |
6.3.2 Peru Small Cell Market Revenues & Volume, By Indoor Coverage, 2022 - 2032F |
6.3.3 Peru Small Cell Market Revenues & Volume, By Outdoor Coverage, 2022 - 2032F |
6.3.4 Peru Small Cell Market Revenues & Volume, By Industrial IoT, 2022 - 2032F |
6.3.5 Peru Small Cell Market Revenues & Volume, By Public Venues, 2022 - 2032F |
6.3.6 Peru Small Cell Market Revenues & Volume, By Stadiums, 2022 - 2032F |
6.4 Peru Small Cell Market, By Technology |
6.4.1 Overview and Analysis |
6.4.2 Peru Small Cell Market Revenues & Volume, By Carrier Aggregation, 2022 - 2032F |
6.4.3 Peru Small Cell Market Revenues & Volume, By mmWave, 2022 - 2032F |
6.4.4 Peru Small Cell Market Revenues & Volume, By CBRS, 2022 - 2032F |
6.4.5 Peru Small Cell Market Revenues & Volume, By Beamforming, 2022 - 2032F |
6.4.6 Peru Small Cell Market Revenues & Volume, By Dynamic Spectrum Sharing, 2022 - 2032F |
6.5 Peru Small Cell Market, By End User |
6.5.1 Overview and Analysis |
6.5.2 Peru Small Cell Market Revenues & Volume, By Residential, 2022 - 2032F |
6.5.3 Peru Small Cell Market Revenues & Volume, By Enterprises, 2022 - 2032F |
6.5.4 Peru Small Cell Market Revenues & Volume, By Smart Cities, 2022 - 2032F |
6.5.5 Peru Small Cell Market Revenues & Volume, By Airports, 2022 - 2032F |
6.5.6 Peru Small Cell Market Revenues & Volume, By Hospitals, 2022 - 2032F |
7 Peru Small Cell Market Import-Export Trade Statistics |
7.1 Peru Small Cell Market Export to Major Countries |
7.2 Peru Small Cell Market Imports from Major Countries |
8 Peru Small Cell Market Key Performance Indicators |
8.1 Average data speed improvement in areas with small cell deployment |
8.2 Percentage increase in network coverage in urban areas with small cell implementation |
8.3 Reduction in network congestion and dropped call rates in regions with small cell deployment |
9 Peru Small Cell Market - Opportunity Assessment |
9.1 Peru Small Cell Market Opportunity Assessment, By Type, 2022 & 2032F |
9.2 Peru Small Cell Market Opportunity Assessment, By Network Type, 2022 & 2032F |
9.3 Peru Small Cell Market Opportunity Assessment, By Application, 2022 & 2032F |
9.4 Peru Small Cell Market Opportunity Assessment, By Technology, 2022 & 2032F |
9.5 Peru Small Cell Market Opportunity Assessment, By End User, 2022 & 2032F |
10 Peru Small Cell Market - Competitive Landscape |
10.1 Peru Small Cell Market Revenue Share, By Companies, 2025 |
10.2 Peru Small Cell Market Competitive Benchmarking, By Operating and Technical Parameters |
11 Company Profiles |
12 Recommendations |
13 Disclaimer |
Export potential assessment - trade Analytics for 2030
Export potential enables firms to identify high-growth global markets with greater confidence by combining advanced trade intelligence with a structured quantitative methodology. The framework analyzes emerging demand trends and country-level import patterns while integrating macroeconomic and trade datasets such as GDP and population forecasts, bilateral import–export flows, tariff structures, elasticity differentials between developed and developing economies, geographic distance, and import demand projections. Using weighted trade values from 2020–2024 as the base period to project country-to-country export potential for 2030, these inputs are operationalized through calculated drivers such as gravity model parameters, tariff impact factors, and projected GDP per-capita growth. Through an analysis of hidden potentials, demand hotspots, and market conditions that are most favorable to success, this method enables firms to focus on target countries, maximize returns, and global expansion with data, backed by accuracy.
By factoring in the projected importer demand gap that is currently unmet and could be potential opportunity, it identifies the potential for the Exporter (Country) among 190 countries, against the general trade analysis, which identifies the biggest importer or exporter.
To discover high-growth global markets and optimize your business strategy:
Click Here
Pricing
- Single User License$ 1,995
- Department License$ 2,400
- Site License$ 3,120
- Global License$ 3,795

Thought Leadership
Search
Thought Leadership and Analyst Meet


Our Clients
Latest Reports
- New Zealand Aseptic Manufacturing Market (2026-2032)
- Netherlands Aseptic Manufacturing Market (2026-2032)
- Nauru Aseptic Manufacturing Market (2026-2032)
- Namibia Aseptic Manufacturing Market (2026-2032)
- Mozambique Aseptic Manufacturing Market (2026-2032)
- Montenegro Aseptic Manufacturing Market (2026-2032)
- Mongolia Aseptic Manufacturing Market (2026-2032)
- Monaco Aseptic Manufacturing Market (2026-2032)
- Micronesia Aseptic Manufacturing Market (2026-2032)
- Mauritius Aseptic Manufacturing Market (2026-2032)
Industry Events and Analyst Meet

HIMTEX 2026

India Refining Summit 2026

India EV Show 2026

EV tech India Expo 2026

Auto Tech Asia 2026
Whitepaper
- Middle East & Africa Commercial Security Market Click here to view more.
- Middle East & Africa Fire Safety Systems & Equipment Market Click here to view more.
- GCC Drone Market Click here to view more.
- Middle East Lighting Fixture Market Click here to view more.
- GCC Physical & Perimeter Security Market Click here to view more.
6WResearch In News
- Doha a strategic location for EV manufacturing hub: IPA Qatar
- Demand for luxury TVs surging in the GCC, says Samsung
- Empowering Growth: The Thriving Journey of Bangladesh’s Cable Industry
- Demand for luxury TVs surging in the GCC, says Samsung
- Video call with a traditional healer? Once unthinkable, it’s now common in South Africa
- Intelligent Buildings To Smooth GCC’s Path To Net Zero