Peru Tables Market (2026-2032) | Size, Growth, Revenue, Trends, Share, Analysis, Forecast, Value, Outlook, Companies, Industry
Market Forecast By Types (Fabric, Leather, Metal, Wooden, Others), By Applications (Family, Office, Others) And Competitive Landscape
| Product Code: ETC034646 | Publication Date: Oct 2020 | Updated Date: Jun 2026 | Product Type: Report | |
| Publisher: 6Wresearch | Author: Ravi Bhandari | No. of Pages: 70 | No. of Figures: 35 | No. of Tables: 5 |
Peru Tables Market Summary
The peru tables market was estimated at USD 301 Million in 2025 and is projected to reach USD 409 Million by 2032, growing at a CAGR of 5.1% from 2026 to 2032.
Peru Tables Market Growth Rate Analysis (2021-2032)
The Peru tables market has shown stable growth, with annual increases ranging from 5.1% to 5.6% between 2021 and 2032. Key drivers include a surge in domestic consumer demand, spurred by a rising middle class and increased disposable income, which supports investments in home décor and furnishings. The years 2022 and 2023 particularly benefited from enhanced industrial capabilities, boosting production efficiency. In contrast, the growth rate slightly dipped to 5.0% in 2032, influenced by anticipated fluctuations in global supply chains, necessitating companies to adapt to evolving market dynamics. Overall, consistent investments in infrastructure and digitalization have fortified this market, ensuring resilience amid competitive pressures.
Peru Tables Market Year-wise Growth Rate and Key Drivers
This graph highlights how the Peru Tables Market has steadily grown over the past five years, supported by major growth factors.
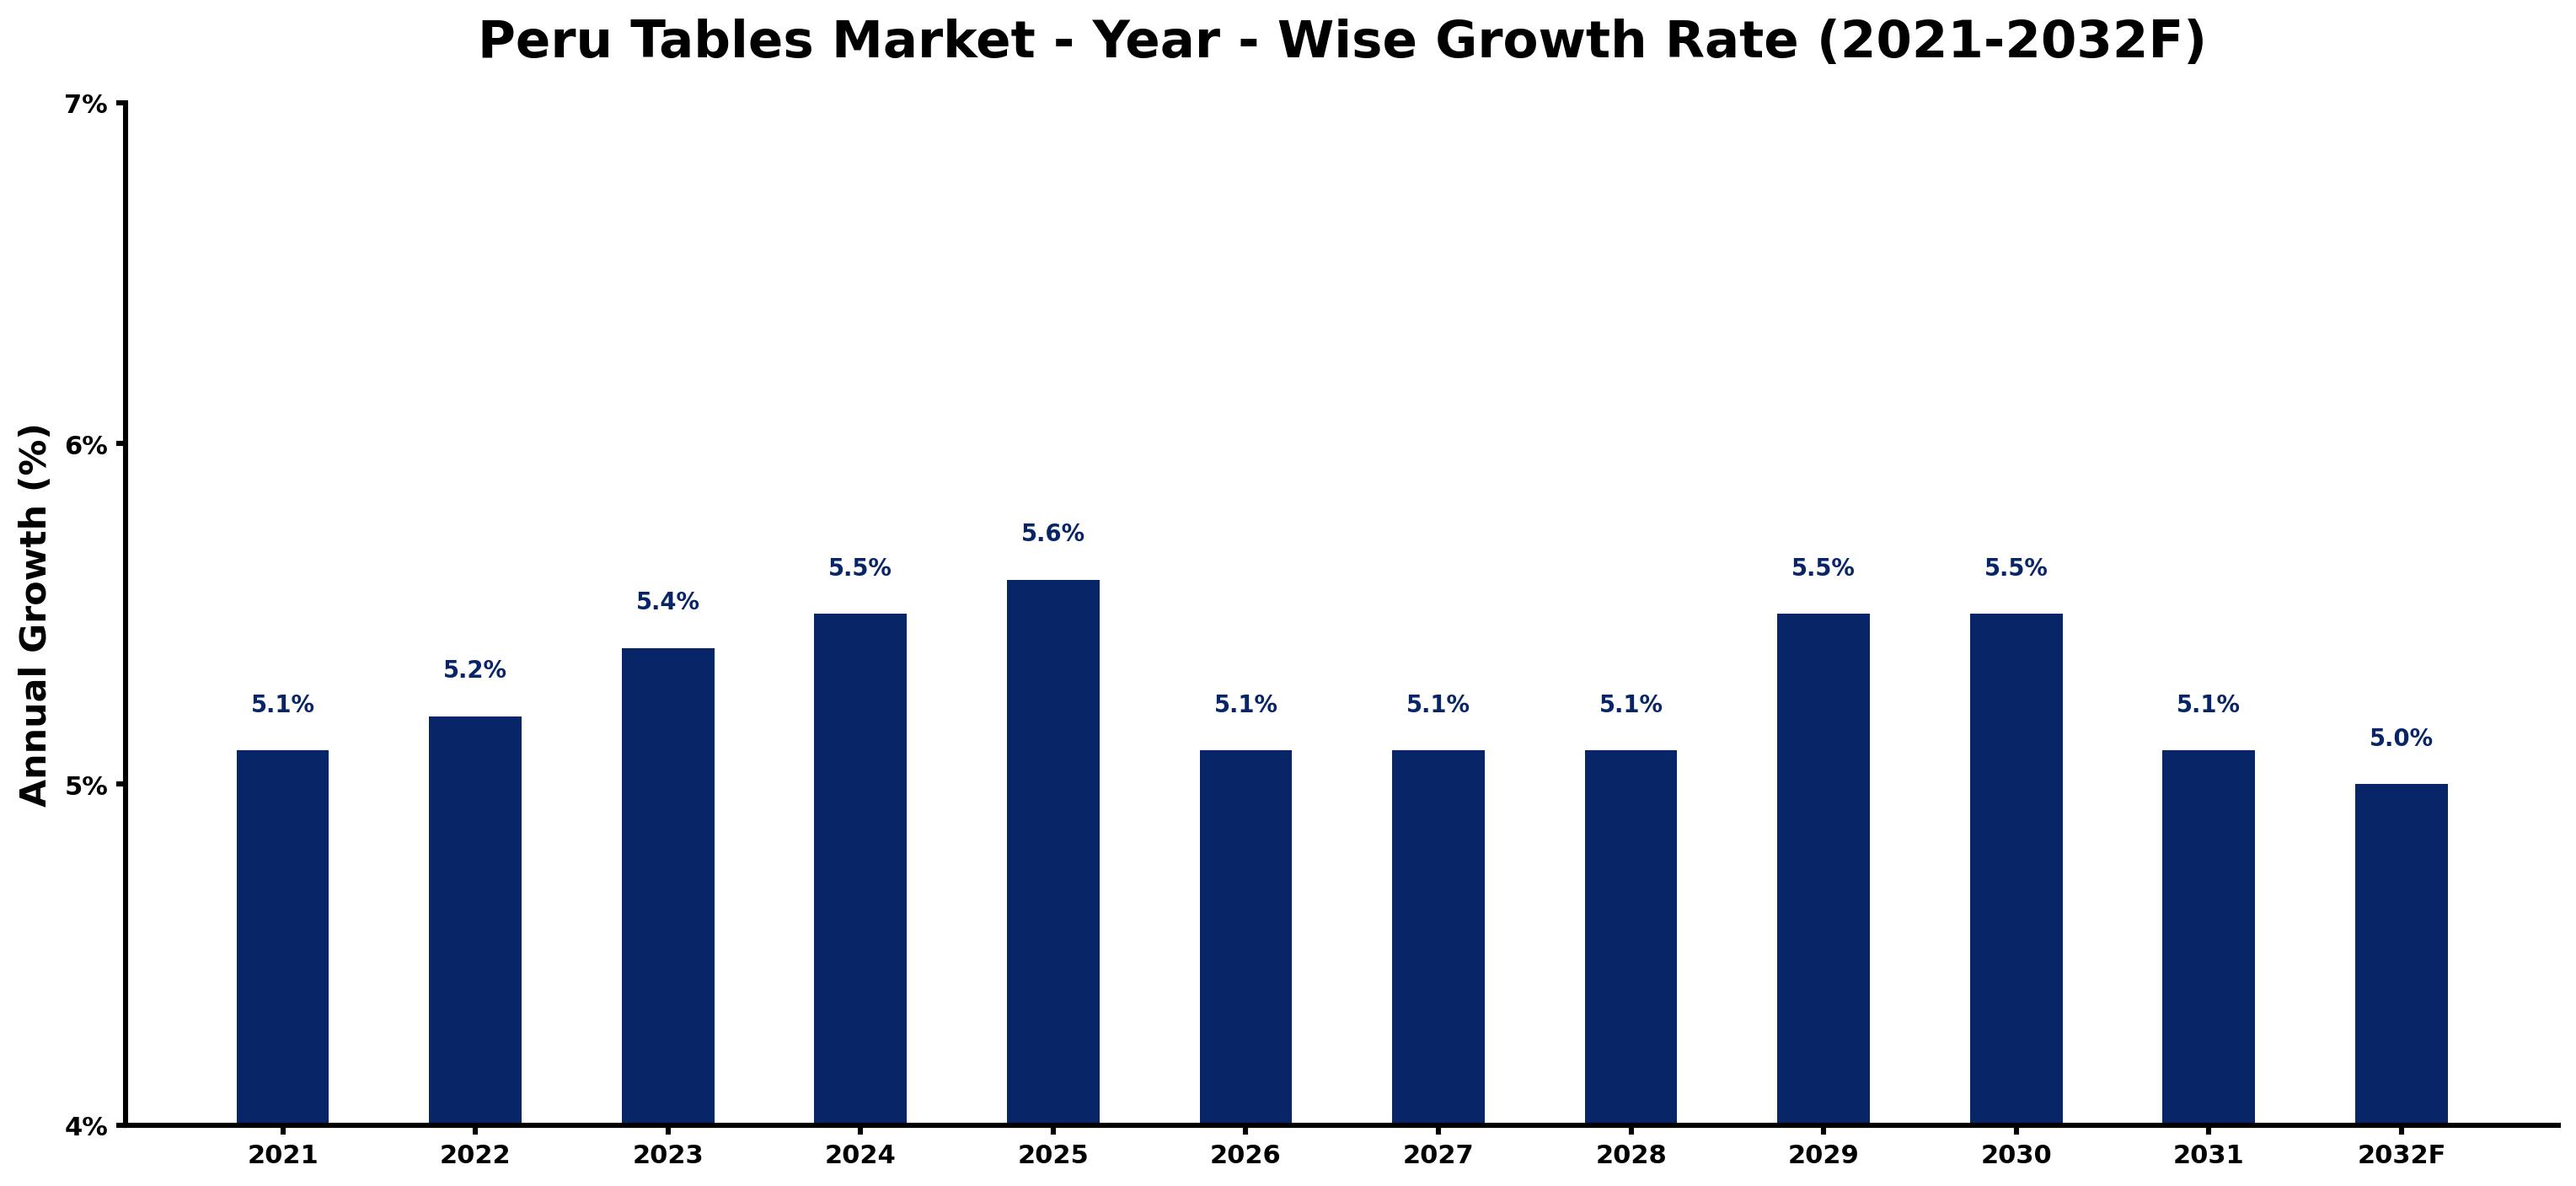
The table below presents the year wise growth rates along with the key drivers influencing the market
| Year | Growth Rate | Major Drivers |
| 2021 | 5.1% | Consumer preference for sustainable materials influences furniture purchasing trends in Peru. |
| 2022 | 5.2% | Local artisans gain recognition, promoting unique handcrafted table designs across urban markets. |
| 2023 | 5.4% | E-commerce platforms expand, making diverse table options accessible to remote buyers. |
| 2024 | 5.5% | Interior design trends emphasize multifunctional spaces, boosting demand for versatile tables. |
| 2025 | 5.6% | Economic recovery post-pandemic sparks increased investments in home renovation projects. |
| 2026 | 5.1% | Growing middle-class population drives demand for quality furniture in urban areas. |
| 2027 | 5.1% | Rise of digital marketing initiatives enhances visibility for local table manufacturers. |
| 2028 | 5.1% | Cultural festivals promote traditional and contemporary table styles, attracting diverse buyers. |
| 2029 | 5.5% | Sustainability initiatives lead companies to explore eco-friendly table materials and designs. |
| 2030 | 5.5% | International tourism recovery enhances demand for locally produced artisanal tables. |
| 2031 | 5.1% | Urban migration results in small space living, increasing interest in space-saving tables. |
| 2032 | 5.0% | Technological innovations in manufacturing streamline production processes and reduce costs. |
Note - Market size estimations and growth projections presented in this report are based on 6Wresearch's advanced forecasting approach, validated with industry datasets as of June 2026.
Peru Tables Market Synopsis
The Peru Tables Market is projected to reach 5.1% and witness significant growth during the forecast period (2026-2032). This expansion is fueled by increasing urbanization trends, rising disposable incomes, and a growing inclination towards home improvement and interior decoration among consumers. As urban lifestyles evolve, the demand for stylish and functional tables that enhance living spaces is on the rise. The market offers a diverse range of products including dining tables, coffee tables, side tables, and outdoor tables, catering to various consumer preferences.
Peru Tables Market Growth Drivers
Several key factors are propelling the growth of the Peru Tables Market:
- The ongoing trend of urbanization has been a significant driver, with more individuals and families moving to urban centers, thus increasing the demand for quality furniture.
- Rising disposable incomes have empowered consumers to invest in stylish and quality furniture, contributing to the market's expansion.
- A notable shift towards home improvement and aesthetic interior design is prompting consumers to purchase new tables that align with modern living trends.
- The increasing interest in eco-friendly furniture solutions is pushing manufacturers to innovate with sustainable materials, attracting environmentally conscious consumers.
- Furthermore, the growth of the e-commerce sector facilitates easier access to a wide variety of table options, enhancing convenience for consumers.
Peru Tables Market Trends and Opportunities
The Peru Tables Market is experiencing transformative trends that highlight opportunities for growth:
- Consumers are increasingly opting for sustainable and eco-friendly materials, resulting in a growing market for tables made from recycled or reclaimed wood.
- There is a rising preference for minimalist and modern designs, which enhance functionality in increasingly compact living spaces.
- The demand for customizable and multifunctional tables is on the upswing, catering to consumers who seek pieces that serve multiple purposes.
- Online retail platforms have gained prominence, providing consumers with a broad selection of table styles and convenient purchasing experiences.
- Overall, the intersection of sustainability, functionality, and aesthetic value is driving innovative product offerings within the market.
Peru Tables Market Challenges and Restraints
Despite the promising growth trajectory, the Peru Tables Market faces several challenges that could inhibit progress:
- Intensifying competition from both domestic and international manufacturers creates pricing pressures and may squeeze profit margins.
- Fluctuations in raw material prices, particularly for wood and metals, can adversely affect production costs, ultimately influencing consumer pricing.
- Consumer preferences are evolving rapidly, necessitating continuous innovation to keep up with emerging trends and styles.
- Economic uncertainties and political instability within the region may impact market demand and consumer confidence, affecting overall performance.
- Additionally, manufacturing capabilities must adapt to meet the increasing demand for sustainable products, requiring investment in new technologies and processes.
Peru Tables Market Investment Opportunities
The Peru Tables Market presents a range of investment opportunities for savvy investors:
- With burgeoning demand for furniture in urban areas and the hospitality sector, producing high-quality and stylish tables can prove lucrative.
- Trends toward the use of sustainable and locally sourced materials in furniture manufacturing create niche markets for eco-friendly table designs.
- Collaborating with local artisans to produce unique, handcrafted tables can attract consumers looking for one-of-a-kind pieces, enhancing brand differentiation.
- Leveraging e-commerce platforms expands market reach, capitalizing on the growing trend of online furniture shopping.
- Investors can benefit from capitalizing on innovations in design and materials to cater to evolving consumer needs, positioning themselves for future growth.
Peru Tables Market Government Investment and Initiatives
Government initiatives regarding the Peru Tables Market focus on promoting sustainable practices and supporting local communities:
- Policies aimed at ensuring that timber used in furniture production is sourced from legal and sustainable suppliers are in place to combat illegal logging.
- Incentives for the adoption of environmentally friendly materials and production techniques are encouraged within the industry.
- The government actively supports local artisans and small businesses with programs aimed at boosting economic development and preserving traditional craftsmanship.
- Efforts to promote sustainable forestry practices are coupled with initiatives to protect the environment, aligning economic growth with ecological balance.
- Collaboration between governmental bodies and industry stakeholders is fostering innovation and responsible consumption in the Peru furniture market.
Peru Tables Market Latest Developments (May 2025 - June 2026)
Recent developments in the Peru Tables Market from May 2025 to June 2026 indicate a significant shift towards sustainable practices and innovative designs:
- There has been a noticeable increase in the availability of eco-friendly table designs, catering to the growing demand for sustainably sourced materials.
- Market players are focusing on enhancing the functionality of their products, introducing multifunctional tables that accommodate various uses.
- Online sales channels have expanded, with many manufacturers capitalizing on the e-commerce boom to reach a wider audience more effectively.
- The trend of minimalism continues to influence design choices, with consumers gravitating towards sleek, modern aesthetics that fit contemporary living environments.
- Feedback from consumers is increasingly driving product development, resulting in offerings that reflect current preferences and lifestyle needs.
Peru Tables Market - Key Attractiveness of the Report
- 10 Years of Market Numbers
- Historical Data Starting from 2022 to 2025
- Base Year: 2025
- Forecast Data until 2032
- Key Performance Indicators Impacting the Market
- Major Upcoming Developments and Projects
Key Highlights of the Report:
- Peru Tables Market Outlook
- Market Size of Peru Tables Market, 2025
- Forecast of Peru Tables Market, 2032F
- Historical Data and Forecast of Peru Tables Revenues & Volume for the Period 2022-2032F
- Peru Tables Market Trend Evolution
- Peru Tables Market Drivers and Challenges
- Peru Tables Price Trends
- Peru Tables Porter's Five Forces
- Peru Tables Industry Life Cycle
- Historical Data and Forecast of Peru Tables Market Revenues & Volume By Types for the Period 2022-2032F
- Historical Data and Forecast of Peru Tables Market Revenues & Volume By Fabric for the Period 2022-2032F
- Historical Data and Forecast of Peru Tables Market Revenues & Volume By Leather for the Period 2022-2032F
- Historical Data and Forecast of Peru Tables Market Revenues & Volume By Metal for the Period 2022-2032F
- Historical Data and Forecast of Peru Tables Market Revenues & Volume By Wooden for the Period 2022-2032F
- Historical Data and Forecast of Peru Tables Market Revenues & Volume By Others for the Period 2022-2032F
- Historical Data and Forecast of Peru Tables Market Revenues & Volume By Applications for the Period 2022-2032F
- Historical Data and Forecast of Peru Tables Market Revenues & Volume By Family for the Period 2022-2032F
- Historical Data and Forecast of Peru Tables Market Revenues & Volume By Office for the Period 2022-2032F
- Historical Data and Forecast of Peru Tables Market Revenues & Volume By Others for the Period 2022-2032F
- Peru Tables Import Export Trade Statistics
- Market Opportunity Assessment By Types
- Market Opportunity Assessment By Applications
- Peru Tables Top Companies Market Share
- Peru Tables Competitive Benchmarking By Technical and Operational Parameters
- Peru Tables Company Profiles
- Peru Tables Key Strategic Recommendations
Frequently Asked Questions About the Market Study (FAQs):
The growth is primarily driven by urbanization, rising disposable incomes, and a trend towards home improvement.
Yes, there is a significant and growing demand for tables made from sustainable materials as consumer awareness increases.
Challenges include competitive pressures, fluctuating raw material prices, and evolving consumer preferences.
The government supports the market through sustainable forestry practices and initiatives that benefit local artisans.
6Wresearch actively monitors the Peru Tables Market and publishes its comprehensive annual report, highlighting emerging trends, growth drivers, revenue analysis, and forecast outlook. Our insights help businesses to make data-backed strategic decisions with ongoing market dynamics. Our analysts track relevent industries related to the Peru Tables Market, allowing our clients with actionable intelligence and reliable forecasts tailored to emerging regional needs.
Yes, we provide customisation as per your requirements. To learn more, feel free to contact us on sales@6wresearch.com
1 Executive Summary |
2 Introduction |
2.1 Key Highlights of the Report |
2.2 Report Description |
2.3 Market Scope & Segmentation |
2.4 Research Methodology |
2.5 Assumptions |
3 Peru Tables Market Overview |
3.1 Peru Country Macro Economic Indicators |
3.2 Peru Tables Market Revenues & Volume, 2022 & 2032F |
3.3 Peru Tables Market - Industry Life Cycle |
3.4 Peru Tables Market - Porter's Five Forces |
3.5 Peru Tables Market Revenues & Volume Share, By Types, 2022 & 2032F |
3.6 Peru Tables Market Revenues & Volume Share, By Applications, 2022 & 2032F |
4 Peru Tables Market Dynamics |
4.1 Impact Analysis |
4.2 Market Drivers |
4.3 Market Restraints |
5 Peru Tables Market Trends |
6 Peru Tables Market, By Types |
6.1 Peru Tables Market, By Types |
6.1.1 Overview and Analysis |
6.1.2 Peru Tables Market Revenues & Volume, By Types, 2022-2032F |
6.1.3 Peru Tables Market Revenues & Volume, By Fabric, 2022-2032F |
6.1.4 Peru Tables Market Revenues & Volume, By Leather, 2022-2032F |
6.1.5 Peru Tables Market Revenues & Volume, By Metal, 2022-2032F |
6.1.6 Peru Tables Market Revenues & Volume, By Wooden, 2022-2032F |
6.1.7 Peru Tables Market Revenues & Volume, By Others, 2022-2032F |
6.2 Peru Tables Market, By Applications |
6.2.1 Overview and Analysis |
6.2.2 Peru Tables Market Revenues & Volume, By Family, 2022-2032F |
6.2.3 Peru Tables Market Revenues & Volume, By Office, 2022-2032F |
6.2.4 Peru Tables Market Revenues & Volume, By Others, 2022-2032F |
7 Peru Tables Market Import-Export Trade Statistics |
7.1 Peru Tables Market Export to Major Countries |
7.2 Peru Tables Market Imports from Major Countries |
8 Peru Tables Market Key Performance Indicators |
9 Peru Tables Market - Opportunity Assessment |
9.1 Peru Tables Market Opportunity Assessment, By Types, 2022 & 2032F |
9.2 Peru Tables Market Opportunity Assessment, By Applications, 2022 & 2032F |
10 Peru Tables Market - Competitive Landscape |
10.1 Peru Tables Market Revenue Share, By Companies, 2025 |
10.2 Peru Tables Market Competitive Benchmarking, By Operating and Technical Parameters |
11 Company Profiles |
12 Recommendations |
13 Disclaimer |
Global Go To Market Strategy - 2030
Export potential enables firms to identify high-growth global markets with greater confidence by combining advanced trade intelligence with a structured quantitative methodology. The framework analyzes emerging demand trends and country-level import patterns while integrating macroeconomic and trade datasets such as GDP and population forecasts, bilateral import–export flows, tariff structures, elasticity differentials between developed and developing economies, geographic distance, and import demand projections. Using weighted trade values from 2020–2024 as the base period to project country-to-country export potential for 2030, these inputs are operationalized through calculated drivers such as gravity model parameters, tariff impact factors, and projected GDP per-capita growth. Through an analysis of hidden potentials, demand hotspots, and market conditions that are most favorable to success, this method enables firms to focus on target countries, maximize returns, and global expansion with data, backed by accuracy.
By factoring in the projected importer demand gap that is currently unmet and could be potential opportunity, it identifies the potential for the Exporter (Country) among 190 countries, against the general trade analysis, which identifies the biggest importer or exporter.
To discover high-growth global markets and optimize your business strategy:
Click Here
Pricing
- Single User License$ 1,995
- Department License$ 2,400
- Site License$ 3,120
- Global License$ 3,795

Leadership Perspectives from Industry Events
Search
Thought Leadership and Analyst Meet


Our Clients
6WResearch In News
- India Air Conditioner Market Set for Strong Rebound in 2026 After Weather-Led Correction and GST-Driven Recovery: 6Wresearch
- ADAS in India: How Automatic Emergency Braking, Blind Spot Detection & Driver Monitoring are Transforming Road Safety
- Doha a strategic location for EV manufacturing hub: IPA Qatar
- Demand for luxury TVs surging in the GCC, says Samsung
- Empowering Growth: The Thriving Journey of Bangladesh’s Cable Industry
- Demand for luxury TVs surging in the GCC, says Samsung
Latest Reports
- Nicaragua RPG Gaming Market (2026-2032)
- New Zealand RPG Gaming Market (2026-2032)
- Netherlands RPG Gaming Market (2026-2032)
- Nauru RPG Gaming Market (2026-2032)
- Namibia RPG Gaming Market (2026-2032)
- Mozambique RPG Gaming Market (2026-2032)
- Montenegro RPG Gaming Market (2026-2032)
- Mongolia RPG Gaming Market (2026-2032)
- Monaco RPG Gaming Market (2026-2032)
- Micronesia RPG Gaming Market (2026-2032)
Industry Events and Analyst Meet

HIMTEX 2026

India Refining Summit 2026

India EV Show 2026

EV tech India Expo 2026

Auto Tech Asia 2026
Whitepaper
- Middle East & Africa Commercial Security Market Click here to view more.
- Middle East & Africa Fire Safety Systems & Equipment Market Click here to view more.
- GCC Drone Market Click here to view more.
- Middle East Lighting Fixture Market Click here to view more.
- GCC Physical & Perimeter Security Market Click here to view more.