Peru Tags Market Outlook | Analysis, Forecast, Growth, Companies, Industry, Value, Trends, Size, Share, Revenue & COVID-19 IMPACT
Market Forecast By Material Type (Plastic, Paper, Fibers, Others (Metal, etc.)), By Tag Type (RFID Tag, Hang/ Swing Tag, Loop Tag), By End Use (Food & Beverage, Clothing & Apparels, Hospitality & Travel, Beauty & Personal Care, Consumer Electronics, Others) And Competitive Landscape
| Product Code: ETC428042 | Publication Date: Oct 2022 | Updated Date: Nov 2025 | Product Type: Market Research Report | |
| Publisher: 6Wresearch | Author: Sachin Kumar Rai | No. of Pages: 75 | No. of Figures: 35 | No. of Tables: 20 |
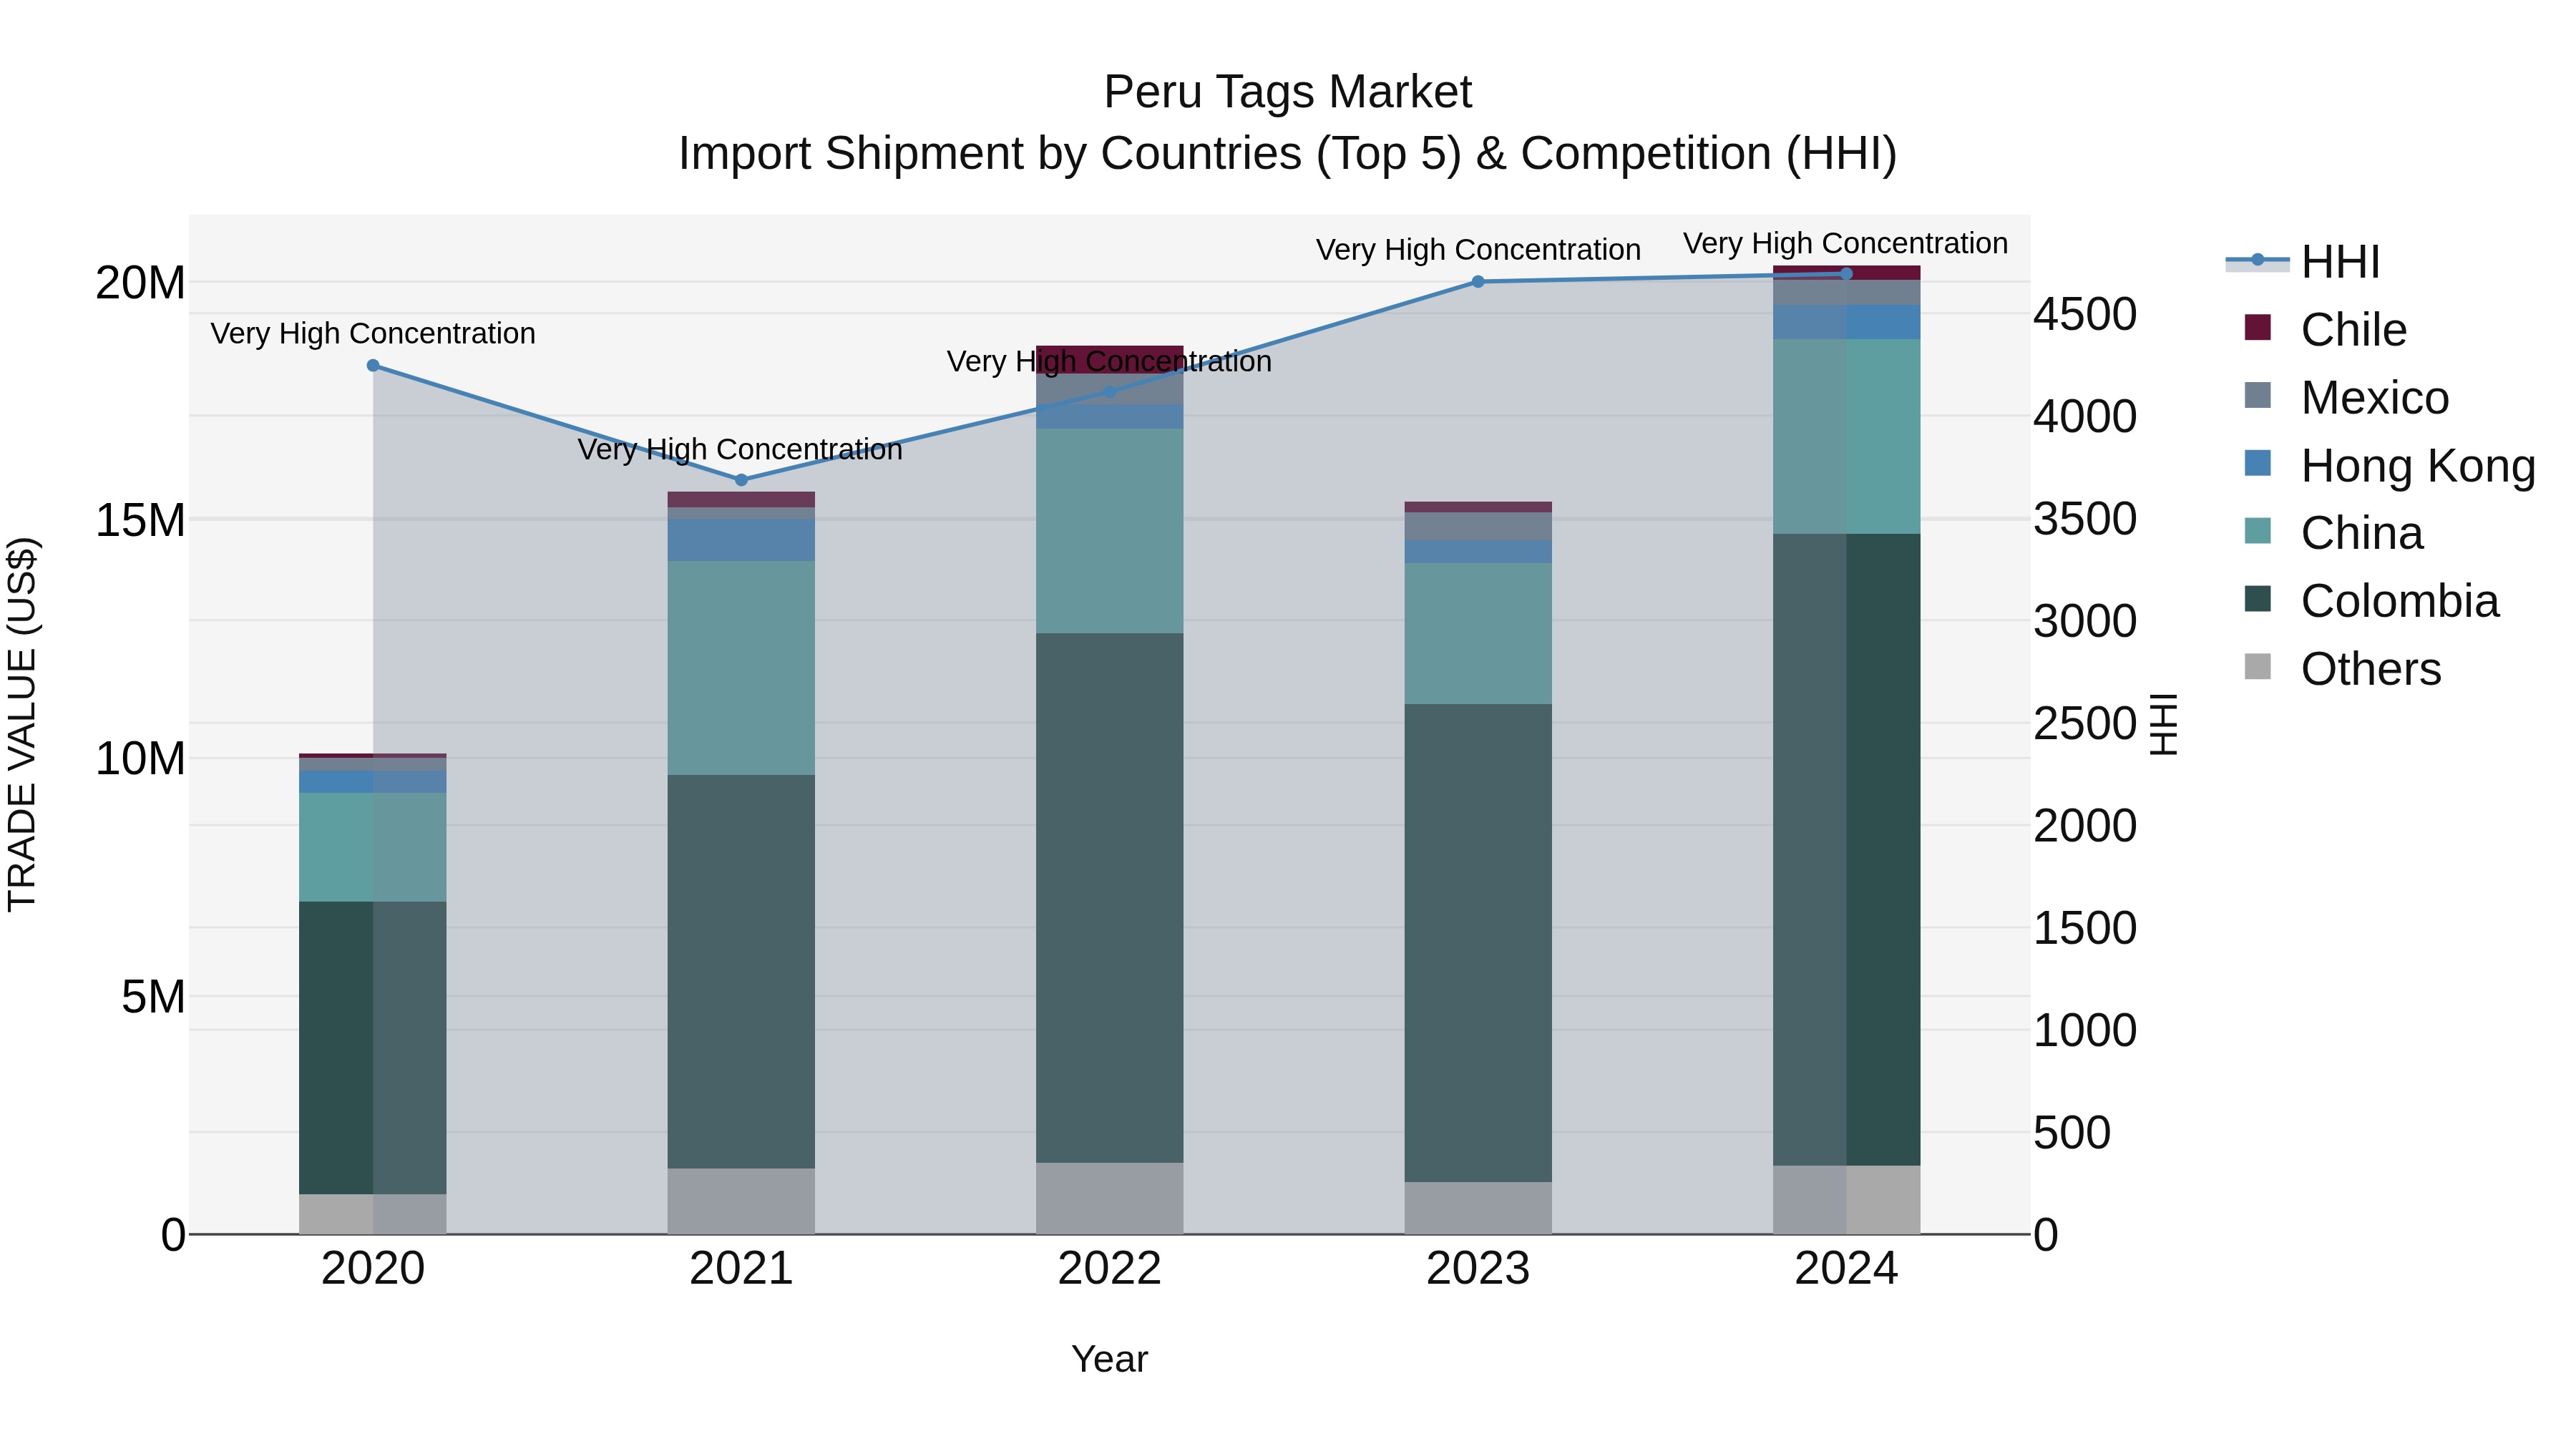
Peru Tags Market Top 5 Importing Countries and Market Competition (HHI) Analysis
Peru`s import of tags saw significant growth in 2024, with top exporting countries including Colombia, China, Hong Kong, Mexico, and the USA. The market remained highly concentrated, indicating strong competition among key players. The impressive compound annual growth rate (CAGR) of 19.14% from 2020 to 2024 demonstrates a thriving market. Moreover, the notable growth rate of 32.16% from 2023 to 2024 suggests a promising outlook for the tags import industry in Peru.
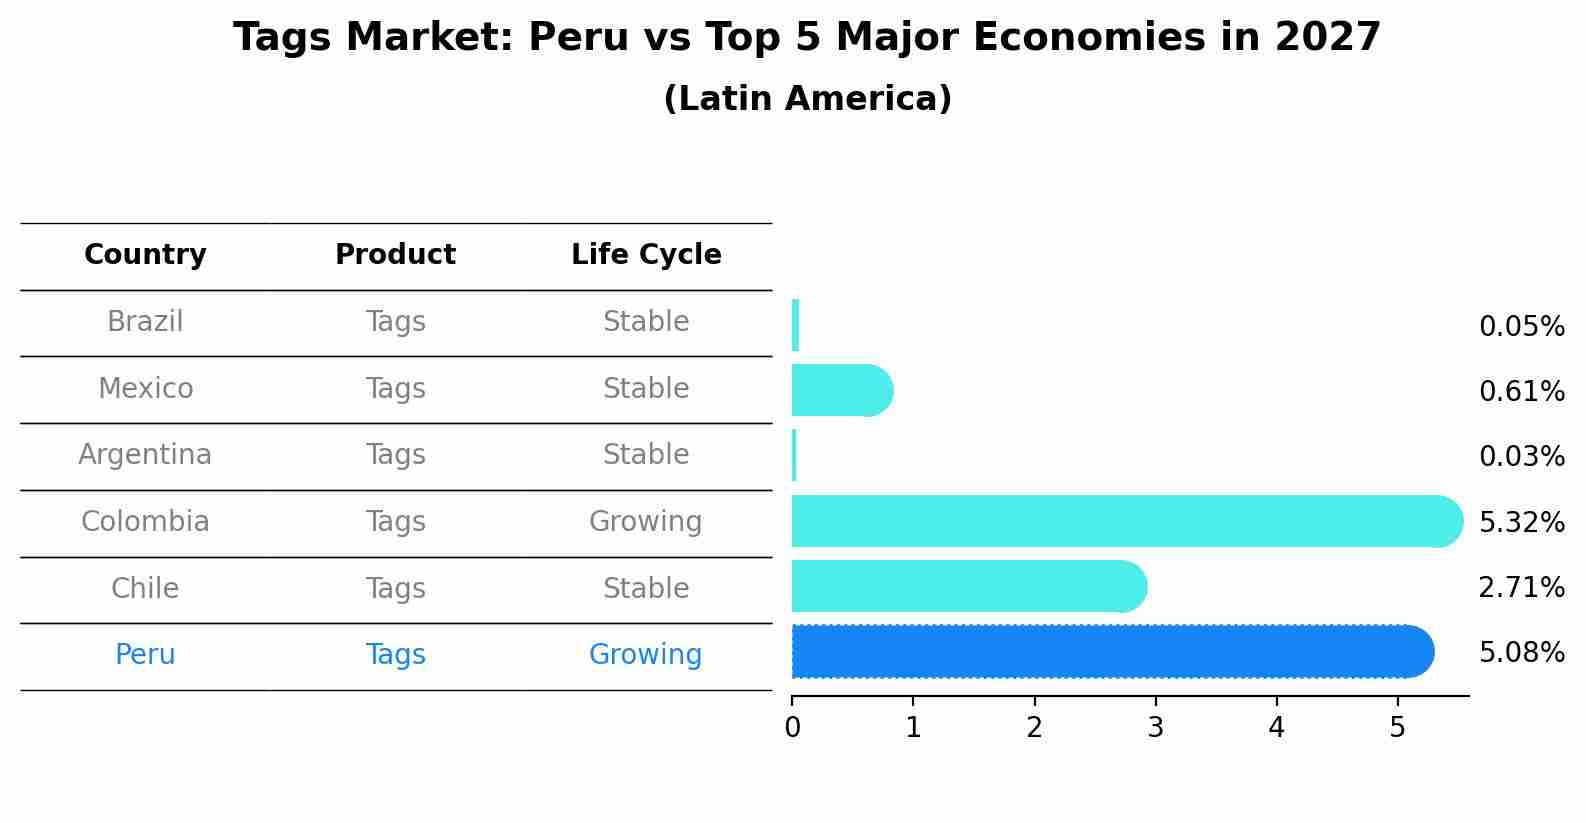
Tags Market: Peru vs Top 5 Major Economies in 2027 (Latin America)
In the Latin America region, the Tags market in Peru is projected to expand at a growing growth rate of 5.08% by 2027. The largest economy is Brazil, followed by Mexico, Argentina, Colombia and Chile.
Peru Tags Market Synopsis
The Peru tags market is a rapidly growing segment within the country`s retail industry, driven by the increasing demand for labeling and tagging products in various sectors such as retail, healthcare, and logistics. The market offers a wide range of tags including barcode labels, RFID tags, and security tags to track and manage inventory efficiently. With the rise of e-commerce and the need for accurate product identification, Peruvian businesses are investing in advanced tagging solutions to enhance their operational efficiency and customer experience. The market is characterized by both local manufacturers and international players offering innovative and cost-effective tagging solutions to cater to the diverse needs of businesses in Peru. Overall, the Peru tags market is poised for continued growth as companies prioritize the adoption of advanced tagging technologies to streamline their processes and improve supply chain management.
Peru Tags Market Trends
The Peru tags market is experiencing a growing demand for sustainable and eco-friendly materials, driven by increasing environmental awareness among consumers. There is a rising preference for tags made from recycled paper, organic cotton, and other biodegradable materials to reduce the environmental impact of packaging. Additionally, customization and personalization are key trends in the market, with businesses looking to differentiate their products through unique tag designs and branding. RFID technology is also gaining traction in the Peru tags market, offering enhanced tracking and inventory management capabilities for businesses. Overall, the market is evolving towards more environmentally conscious and technologically advanced solutions to meet the changing needs of both businesses and consumers.
Peru Tags Market Challenges
In the Peru tags market, one of the main challenges faced is the presence of counterfeit products. This not only affects the revenue of legitimate tag manufacturers but also poses a risk to consumers who may unknowingly purchase substandard or potentially harmful products. Additionally, the rapid advancement of technology presents a challenge in keeping up with the latest security features to prevent counterfeiting. Furthermore, the competitive landscape in the tags market in Peru can also be a challenge, with various companies vying for market share and offering innovative solutions. Overall, addressing these challenges requires constant innovation, investment in research and development, and collaboration with authorities to enforce intellectual property rights and combat counterfeit products effectively.
Peru Tags Market Investment Opportunities
The Peru tags market presents various investment opportunities for businesses looking to capitalize on the growing demand for tagging solutions across industries such as retail, healthcare, logistics, and agriculture. With the increasing focus on asset tracking, inventory management, and supply chain optimization, there is a rising need for RFID tags, barcode labels, and other tracking technologies in Peru. Investing in innovative tag manufacturing companies, distribution networks, or providing customized tagging solutions can be lucrative in this market. Additionally, opportunities exist in offering integrated software solutions for data management and analytics to complement tagging systems for enhanced efficiency and productivity. Keeping pace with technological advancements and addressing specific industry requirements will be key to success in the Peru tags market.
Jordan Agar Market Government Policies
Government policies related to the Peru Tags Market involve regulations set by the National Fisheries and Aquaculture Authority (PRODUCE) to control and monitor the fishing industry. These policies require fishing vessels to obtain and properly display tags to track their catches and ensure compliance with quotas and sustainability measures. Additionally, the government has implemented measures to combat illegal fishing practices and promote responsible fishing practices, such as mandating the use of electronic monitoring systems on vessels. These policies aim to protect marine resources, support sustainable fishing practices, and promote transparency in the seafood supply chain. Overall, the government`s regulations in the Peru Tags Market are focused on ensuring the long-term viability of the fishing industry and safeguarding the marine environment.
Peru Tags Market Future Outlook
The Peru tags market is expected to witness steady growth in the upcoming years, driven by factors such as increasing demand for effective product labeling and tracking solutions across various industries including retail, healthcare, and manufacturing. With the rising emphasis on traceability and authenticity of products, the adoption of tags for inventory management and anti-counterfeiting measures is projected to fuel market growth. Additionally, technological advancements such as RFID and NFC tags are likely to offer new growth opportunities by providing enhanced data collection and tracking capabilities. The market is also anticipated to benefit from the growing e-commerce sector in Peru, which will further drive the need for efficient tagging solutions to ensure smooth logistics operations. Overall, the Peru tags market is expected to expand steadily in the foreseeable future.
Key Highlights of the Report:
- Peru Tags Market Outlook
- Market Size of Peru Tags Market, 2021
- Forecast of Peru Tags Market, 2031
- Historical Data and Forecast of Peru Tags Revenues & Volume for the Period 2018 - 2031
- Peru Tags Market Trend Evolution
- Peru Tags Market Drivers and Challenges
- Peru Tags Price Trends
- Peru Tags Porter's Five Forces
- Peru Tags Industry Life Cycle
- Historical Data and Forecast of Peru Tags Market Revenues & Volume By Material Type for the Period 2018 - 2031
- Historical Data and Forecast of Peru Tags Market Revenues & Volume By Plastic for the Period 2018 - 2031
- Historical Data and Forecast of Peru Tags Market Revenues & Volume By Paper for the Period 2018 - 2031
- Historical Data and Forecast of Peru Tags Market Revenues & Volume By Fibers for the Period 2018 - 2031
- Historical Data and Forecast of Peru Tags Market Revenues & Volume By Others (Metal, etc.) for the Period 2018 - 2031
- Historical Data and Forecast of Peru Tags Market Revenues & Volume By Tag Type for the Period 2018 - 2031
- Historical Data and Forecast of Peru Tags Market Revenues & Volume By RFID Tag for the Period 2018 - 2031
- Historical Data and Forecast of Peru Tags Market Revenues & Volume By Hang/ Swing Tag for the Period 2018 - 2031
- Historical Data and Forecast of Peru Tags Market Revenues & Volume By Loop Tag for the Period 2018 - 2031
- Historical Data and Forecast of Peru Tags Market Revenues & Volume By End Use for the Period 2018 - 2031
- Historical Data and Forecast of Peru Tags Market Revenues & Volume By Food & Beverage for the Period 2018 - 2031
- Historical Data and Forecast of Peru Tags Market Revenues & Volume By Clothing & Apparels for the Period 2018 - 2031
- Historical Data and Forecast of Peru Tags Market Revenues & Volume By Hospitality & Travel for the Period 2018 - 2031
- Historical Data and Forecast of Peru Tags Market Revenues & Volume By Beauty & Personal Care for the Period 2018 - 2031
- Historical Data and Forecast of Peru Tags Market Revenues & Volume By Consumer Electronics for the Period 2018 - 2031
- Historical Data and Forecast of Peru Tags Market Revenues & Volume By Others for the Period 2018 - 2031
- Peru Tags Import Export Trade Statistics
- Market Opportunity Assessment By Material Type
- Market Opportunity Assessment By Tag Type
- Market Opportunity Assessment By End Use
- Peru Tags Top Companies Market Share
- Peru Tags Competitive Benchmarking By Technical and Operational Parameters
- Peru Tags Company Profiles
- Peru Tags Key Strategic Recommendations
Frequently Asked Questions About the Market Study (FAQs):
6Wresearch actively monitors the Peru Tags Market and publishes its comprehensive annual report, highlighting emerging trends, growth drivers, revenue analysis, and forecast outlook. Our insights help businesses to make data-backed strategic decisions with ongoing market dynamics. Our analysts track relevent industries related to the Peru Tags Market, allowing our clients with actionable intelligence and reliable forecasts tailored to emerging regional needs.
Yes, we provide customisation as per your requirements. To learn more, feel free to contact us on sales@6wresearch.com
1 Executive Summary |
2 Introduction |
2.1 Key Highlights of the Report |
2.2 Report Description |
2.3 Market Scope & Segmentation |
2.4 Research Methodology |
2.5 Assumptions |
3 Peru Tags Market Overview |
3.1 Peru Country Macro Economic Indicators |
3.2 Peru Tags Market Revenues & Volume, 2021 & 2031F |
3.3 Peru Tags Market - Industry Life Cycle |
3.4 Peru Tags Market - Porter's Five Forces |
3.5 Peru Tags Market Revenues & Volume Share, By Material Type, 2021 & 2031F |
3.6 Peru Tags Market Revenues & Volume Share, By Tag Type, 2021 & 2031F |
3.7 Peru Tags Market Revenues & Volume Share, By End Use, 2021 & 2031F |
4 Peru Tags Market Dynamics |
4.1 Impact Analysis |
4.2 Market Drivers |
4.2.1 Increasing demand for sustainable and eco-friendly products |
4.2.2 Growth in the tourism industry in Peru |
4.2.3 Implementation of government regulations promoting the use of eco-friendly tags |
4.3 Market Restraints |
4.3.1 High competition from alternative tagging solutions |
4.3.2 Price sensitivity among consumers |
4.3.3 Lack of awareness about the benefits of eco-friendly tags |
5 Peru Tags Market Trends |
6 Peru Tags Market, By Types |
6.1 Peru Tags Market, By Material Type |
6.1.1 Overview and Analysis |
6.1.2 Peru Tags Market Revenues & Volume, By Material Type, 2021-2031F |
6.1.3 Peru Tags Market Revenues & Volume, By Plastic, 2021-2031F |
6.1.4 Peru Tags Market Revenues & Volume, By Paper, 2021-2031F |
6.1.5 Peru Tags Market Revenues & Volume, By Fibers, 2021-2031F |
6.1.6 Peru Tags Market Revenues & Volume, By Others (Metal, etc.), 2021-2031F |
6.2 Peru Tags Market, By Tag Type |
6.2.1 Overview and Analysis |
6.2.2 Peru Tags Market Revenues & Volume, By RFID Tag, 2021-2031F |
6.2.3 Peru Tags Market Revenues & Volume, By Hang/ Swing Tag, 2021-2031F |
6.2.4 Peru Tags Market Revenues & Volume, By Loop Tag, 2021-2031F |
6.3 Peru Tags Market, By End Use |
6.3.1 Overview and Analysis |
6.3.2 Peru Tags Market Revenues & Volume, By Food & Beverage, 2021-2031F |
6.3.3 Peru Tags Market Revenues & Volume, By Clothing & Apparels, 2021-2031F |
6.3.4 Peru Tags Market Revenues & Volume, By Hospitality & Travel, 2021-2031F |
6.3.5 Peru Tags Market Revenues & Volume, By Beauty & Personal Care, 2021-2031F |
6.3.6 Peru Tags Market Revenues & Volume, By Consumer Electronics, 2021-2031F |
6.3.7 Peru Tags Market Revenues & Volume, By Others, 2021-2031F |
7 Peru Tags Market Import-Export Trade Statistics |
7.1 Peru Tags Market Export to Major Countries |
7.2 Peru Tags Market Imports from Major Countries |
8 Peru Tags Market Key Performance Indicators |
8.1 Percentage increase in the adoption of eco-friendly practices by businesses |
8.2 Number of tourists visiting Peru |
8.3 Percentage of businesses compliant with government regulations on sustainable tagging |
8.4 Percentage increase in the use of recyclable materials in tags |
8.5 Number of educational campaigns conducted to raise awareness about eco-friendly tags |
9 Peru Tags Market - Opportunity Assessment |
9.1 Peru Tags Market Opportunity Assessment, By Material Type, 2021 & 2031F |
9.2 Peru Tags Market Opportunity Assessment, By Tag Type, 2021 & 2031F |
9.3 Peru Tags Market Opportunity Assessment, By End Use, 2021 & 2031F |
10 Peru Tags Market - Competitive Landscape |
10.1 Peru Tags Market Revenue Share, By Companies, 2021 |
10.2 Peru Tags Market Competitive Benchmarking, By Operating and Technical Parameters |
11 Company Profiles |
12 Recommendations |
13 Disclaimer |
Global Go To Market Strategy - 2030
Export potential enables firms to identify high-growth global markets with greater confidence by combining advanced trade intelligence with a structured quantitative methodology. The framework analyzes emerging demand trends and country-level import patterns while integrating macroeconomic and trade datasets such as GDP and population forecasts, bilateral import–export flows, tariff structures, elasticity differentials between developed and developing economies, geographic distance, and import demand projections. Using weighted trade values from 2020–2024 as the base period to project country-to-country export potential for 2030, these inputs are operationalized through calculated drivers such as gravity model parameters, tariff impact factors, and projected GDP per-capita growth. Through an analysis of hidden potentials, demand hotspots, and market conditions that are most favorable to success, this method enables firms to focus on target countries, maximize returns, and global expansion with data, backed by accuracy.
By factoring in the projected importer demand gap that is currently unmet and could be potential opportunity, it identifies the potential for the Exporter (Country) among 190 countries, against the general trade analysis, which identifies the biggest importer or exporter.
To discover high-growth global markets and optimize your business strategy:
Click Here
Pricing
- Single User License$ 1,995
- Department License$ 2,400
- Site License$ 3,120
- Global License$ 3,795

Leadership Perspectives from Industry Events
Search
Thought Leadership and Analyst Meet


Our Clients
6WResearch In News
- India Air Conditioner Market Set for Strong Rebound in 2026 After Weather-Led Correction and GST-Driven Recovery: 6Wresearch
- ADAS in India: How Automatic Emergency Braking, Blind Spot Detection & Driver Monitoring are Transforming Road Safety
- Doha a strategic location for EV manufacturing hub: IPA Qatar
- Demand for luxury TVs surging in the GCC, says Samsung
- Empowering Growth: The Thriving Journey of Bangladesh’s Cable Industry
- Demand for luxury TVs surging in the GCC, says Samsung
Latest Reports
- Poland Fire Protection Systems Market (2026-2032)
- Cape Verde Portable Hand-Thrown Extinguisher Market (2026-2032)
- Canada Portable Hand-Thrown Extinguisher Market (2026-2032)
- Cameroon Portable Hand-Thrown Extinguisher Market (2026-2032)
- Burundi Portable Hand-Thrown Extinguisher Market (2026-2032)
- Burkina Faso Portable Hand-Thrown Extinguisher Market (2026-2032)
- Bulgaria Portable Hand-Thrown Extinguisher Market (2026-2032)
- Brunei Portable Hand-Thrown Extinguisher Market (2026-2032)
- Botswana Portable Hand-Thrown Extinguisher Market (2026-2032)
- Bosnia and Herzegovina Portable Hand-Thrown Extinguisher Market (2026-2032)
Industry Events and Analyst Meet

HIMTEX 2026

India Refining Summit 2026

India EV Show 2026

EV tech India Expo 2026

Auto Tech Asia 2026
Whitepaper
- Middle East & Africa Commercial Security Market Click here to view more.
- Middle East & Africa Fire Safety Systems & Equipment Market Click here to view more.
- GCC Drone Market Click here to view more.
- Middle East Lighting Fixture Market Click here to view more.
- GCC Physical & Perimeter Security Market Click here to view more.