Philippines Carbonate Market (2025-2031) Outlook | Growth, Trends, Size, Companies, Value, Analysis, Industry, Revenue, Share & Forecast
Market Forecast By Type (Dimethyl, Propylene, Ethylene, Glycerol, 1,2-Epoxydodecane, 1,2-Hexadecene, Styrene, Others), By Application (Solvents, Catalysts, Electrolytes, Additives, Cleaners, Others), By End Use (Cosmetics & personal care, Paints & coatings, Pharmaceuticals, Textile, Energy & power, Polymer, Others) And Competitive Landscape
| Product Code: ETC199541 | Publication Date: May 2022 | Updated Date: Aug 2025 | Product Type: Market Research Report | |
| Publisher: 6Wresearch | Author: Ravi Bhandari | No. of Pages: 60 | No. of Figures: 40 | No. of Tables: 7 |
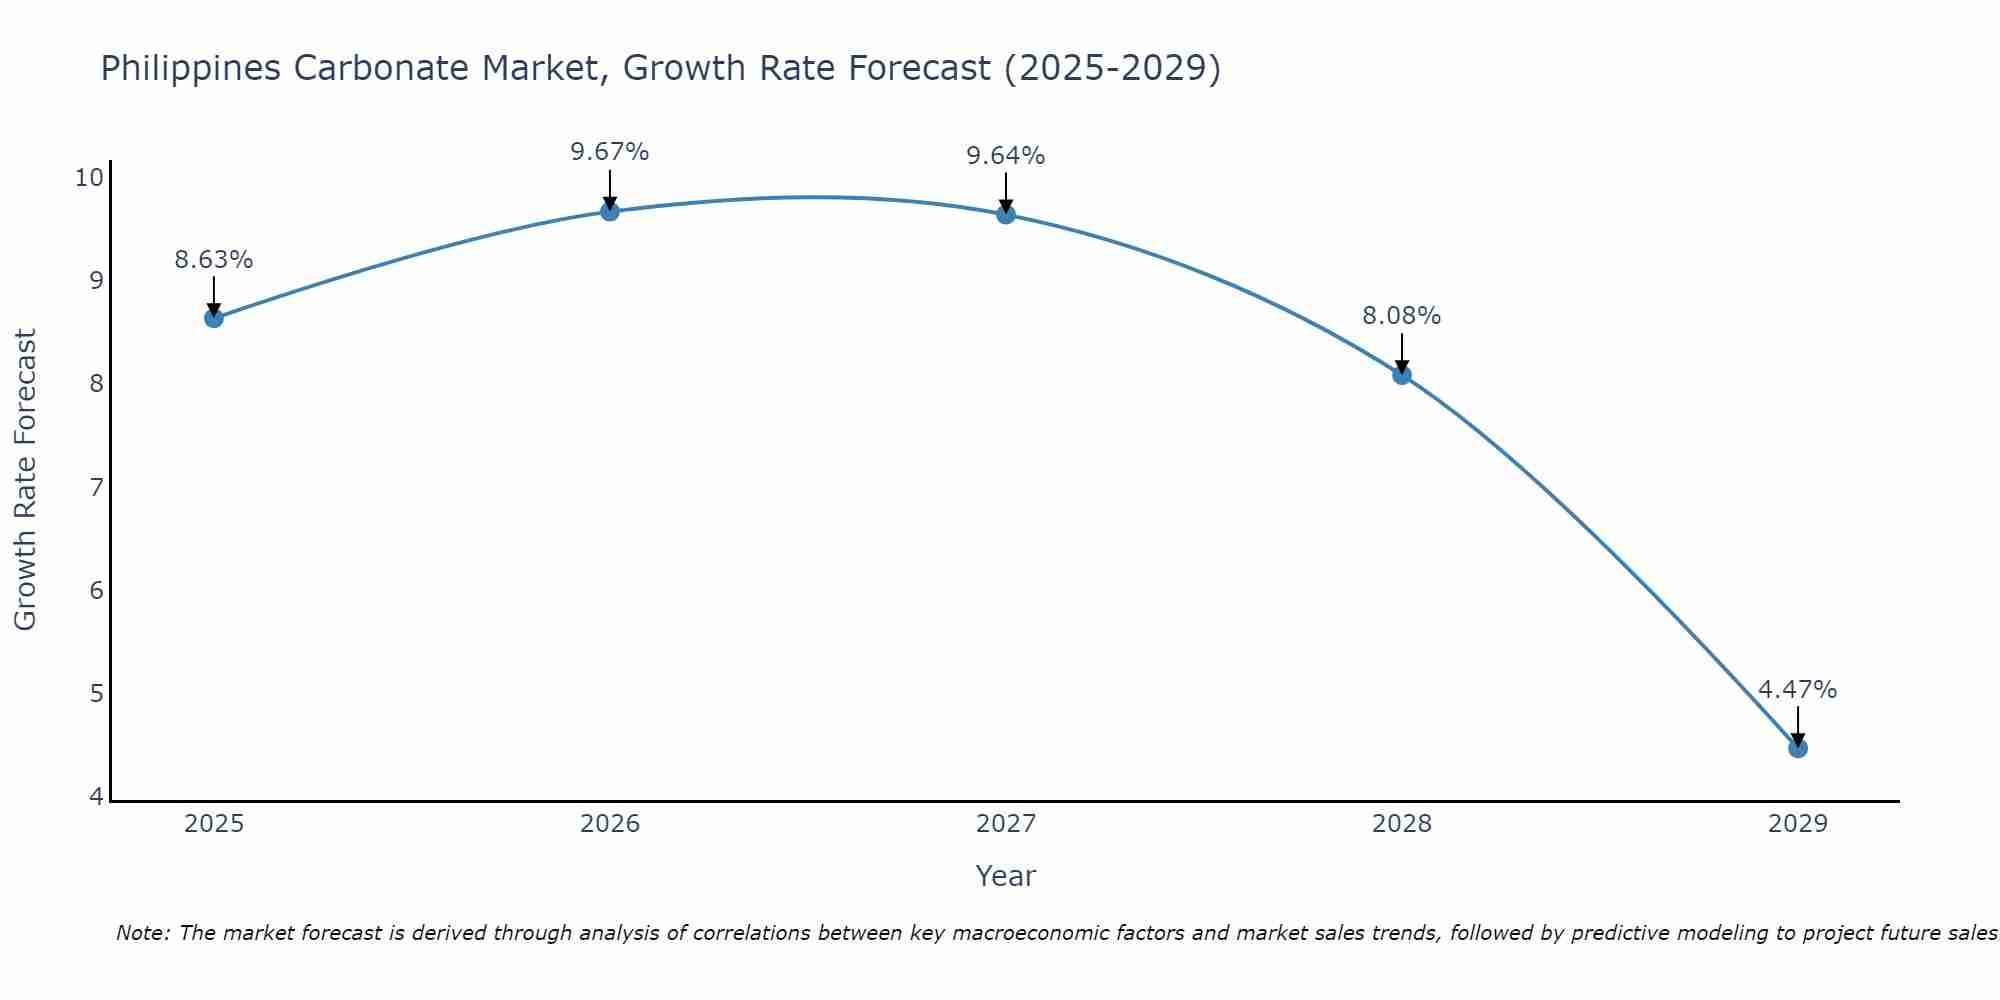
Philippines Carbonate Market Size Growth Rate
The Philippines Carbonate Market is projected to witness mixed growth rate patterns during 2025 to 2029. The growth rate begins at 8.63% in 2025, climbs to a high of 9.67% in 2026, and moderates to 4.47% by 2029.
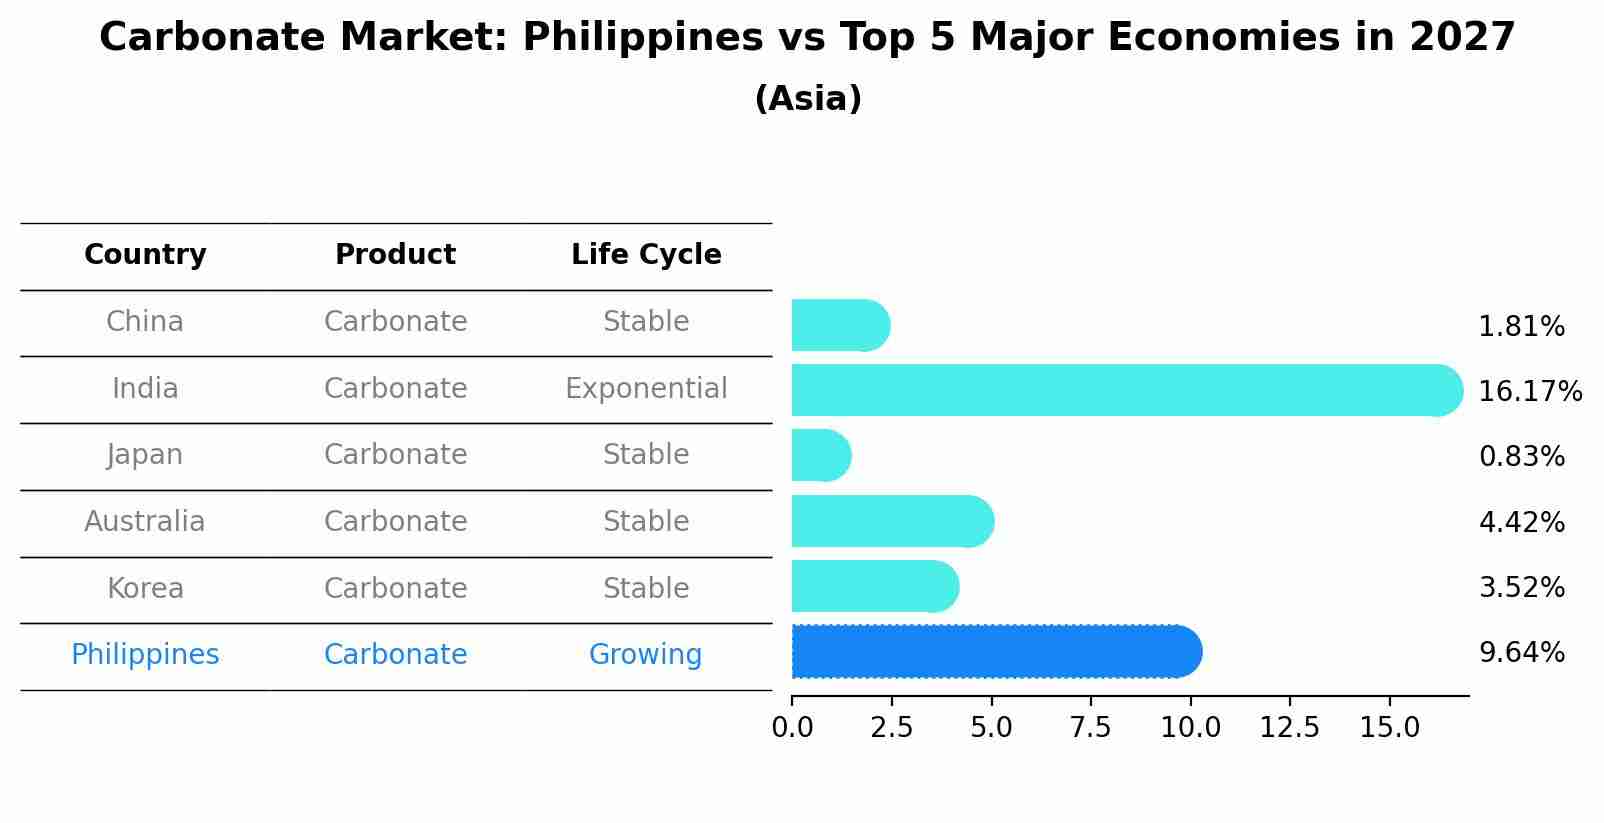
Carbonate Market: Philippines vs Top 5 Major Economies in 2027 (Asia)
The Carbonate market in Philippines is projected to grow at a growing growth rate of 9.64% by 2027, within the Asia region led by China, along with other countries like India, Japan, Australia and South Korea, collectively shaping a dynamic and evolving market environment driven by innovation and increasing adoption of emerging technologies.
Philippines Carbonate Market Synopsis
The carbonate market in the Philippines has witnessed steady growth over recent years following increasing demand from various end-use industries such as paint & coatings, construction materials manufacturing and automotive sectors amongst others. Estimated sales amounted to about USD 3 million annually on average between 2018 and 2025 with domestic suppliers playing a key role across different product types such as calcium carbonate (CaCO3), magnesium carbonate (MgCO3) & sodium bicarbonate (NaHCO3).
Drivers of the market
The Philippines carbonate market thrives on its applications in industries ranging from construction and ceramics to pharmaceuticals and food. Carbonates, such as calcium carbonate, are widely used as fillers, stabilizers, and pH regulators in various products. The construction sector`s growth and the increasing demand for functional additives in consumer goods contribute to the market`s expansion. Moreover, the healthcare and pharmaceutical industries` reliance on calcium carbonate in medications and dietary supplements also drive market growth. As these sectors continue to evolve, the demand for carbonates remains robust.
Challenges of the market
The Philippines carbonate market faces multifaceted challenges due to the compound`s wide range of applications in industries such as construction, agriculture, and chemicals. Economic fluctuations impact demand for different carbonate forms, while environmental concerns drive shifts towards sustainable sourcing. The market also deals with complexities related to product quality and consistency, which are essential for meeting diverse industry requirements and maintaining consumer trust.
Covid-19 Impact of the market
The COVID-19 pandemic had implications for the Philippines carbonate market, influencing sectors such as construction, chemicals, and food. Carbonates, used in construction materials, chemicals, and as food additives, faced changes in demand patterns due to disruptions in construction projects and shifts in consumer preferences. The market`s ability to adjust to these shifts was crucial for maintaining supply.
Key Players of the market
CarbonateCorp, MarketCarbonate Ltd, and CO3 Tech Solutions are key participants in the Philippines carbonate market. These companies supply carbonates such as calcium carbonate, sodium carbonate, and others, which find applications in various industries including construction, chemicals, and agriculture.
Key Highlights of the Report:
- Philippines Carbonate Market Outlook
- Market Size of Philippines Carbonate Market, 2024
- Forecast of Philippines Carbonate Market, 2031
- Historical Data and Forecast of Philippines Carbonate Revenues & Volume for the Period 2021-2031
- Philippines Carbonate Market Trend Evolution
- Philippines Carbonate Market Drivers and Challenges
- Philippines Carbonate Price Trends
- Philippines Carbonate Porter's Five Forces
- Philippines Carbonate Industry Life Cycle
- Historical Data and Forecast of Philippines Carbonate Market Revenues & Volume By Type for the Period 2021-2031
- Historical Data and Forecast of Philippines Carbonate Market Revenues & Volume By Dimethyl for the Period 2021-2031
- Historical Data and Forecast of Philippines Carbonate Market Revenues & Volume By Propylene for the Period 2021-2031
- Historical Data and Forecast of Philippines Carbonate Market Revenues & Volume By Ethylene for the Period 2021-2031
- Historical Data and Forecast of Philippines Carbonate Market Revenues & Volume By Glycerol for the Period 2021-2031
- Historical Data and Forecast of Philippines Carbonate Market Revenues & Volume By 1,2-Epoxydodecane for the Period 2021-2031
- Historical Data and Forecast of Philippines Carbonate Market Revenues & Volume By 1,2-Hexadecene for the Period 2021-2031
- Historical Data and Forecast of Philippines Carbonate Market Revenues & Volume By Styrene for the Period 2021-2031
- Historical Data and Forecast of Philippines Dimethyl Carbonate Market Revenues & Volume By Others for the Period 2021-2031
- Historical Data and Forecast of Philippines Carbonate Market Revenues & Volume By Application for the Period 2021-2031
- Historical Data and Forecast of Philippines Carbonate Market Revenues & Volume By Solvents for the Period 2021-2031
- Historical Data and Forecast of Philippines Carbonate Market Revenues & Volume By Catalysts for the Period 2021-2031
- Historical Data and Forecast of Philippines Carbonate Market Revenues & Volume By Electrolytes for the Period 2021-2031
- Historical Data and Forecast of Philippines Carbonate Market Revenues & Volume By Additives for the Period 2021-2031
- Historical Data and Forecast of Philippines Carbonate Market Revenues & Volume By Cleaners for the Period 2021-2031
- Historical Data and Forecast of Philippines Carbonate Market Revenues & Volume By Others for the Period 2021-2031
- Historical Data and Forecast of Philippines Carbonate Market Revenues & Volume By End Use for the Period 2021-2031
- Historical Data and Forecast of Philippines Carbonate Market Revenues & Volume By Cosmetics & personal care for the Period 2021-2031
- Historical Data and Forecast of Philippines Carbonate Market Revenues & Volume By Paints & coatings for the Period 2021-2031
- Historical Data and Forecast of Philippines Carbonate Market Revenues & Volume By Pharmaceuticals for the Period 2021-2031
- Historical Data and Forecast of Philippines Carbonate Market Revenues & Volume By Textile for the Period 2021-2031
- Historical Data and Forecast of Philippines Carbonate Market Revenues & Volume By Energy & power for the Period 2021-2031
- Historical Data and Forecast of Philippines Carbonate Market Revenues & Volume By Polymer for the Period 2021-2031
- Historical Data and Forecast of Philippines Carbonate Market Revenues & Volume By Others for the Period 2021-2031
- Philippines Carbonate Import Export Trade Statistics
- Market Opportunity Assessment By Type
- Market Opportunity Assessment By Application
- Market Opportunity Assessment By End Use
- Philippines Carbonate Top Companies Market Share
- Philippines Carbonate Competitive Benchmarking By Technical and Operational Parameters
- Philippines Carbonate Company Profiles
- Philippines Carbonate Key Strategic Recommendations
Frequently Asked Questions About the Market Study (FAQs):
6Wresearch actively monitors the Philippines Carbonate Market and publishes its comprehensive annual report, highlighting emerging trends, growth drivers, revenue analysis, and forecast outlook. Our insights help businesses to make data-backed strategic decisions with ongoing market dynamics. Our analysts track relevent industries related to the Philippines Carbonate Market, allowing our clients with actionable intelligence and reliable forecasts tailored to emerging regional needs.
Yes, we provide customisation as per your requirements. To learn more, feel free to contact us on sales@6wresearch.com
1 Executive Summary |
2 Introduction |
2.1 Key Highlights of the Report |
2.2 Report Description |
2.3 Market Scope & Segmentation |
2.4 Research Methodology |
2.5 Assumptions |
3 Philippines Carbonate Market Overview |
3.1 Philippines Country Macro Economic Indicators |
3.2 Philippines Carbonate Market Revenues & Volume, 2021 & 2031F |
3.3 Philippines Carbonate Market - Industry Life Cycle |
3.4 Philippines Carbonate Market - Porter's Five Forces |
3.5 Philippines Carbonate Market Revenues & Volume Share, By Type, 2021 & 2031F |
3.6 Philippines Carbonate Market Revenues & Volume Share, By Application, 2021 & 2031F |
3.7 Philippines Carbonate Market Revenues & Volume Share, By End Use, 2021 & 2031F |
4 Philippines Carbonate Market Dynamics |
4.1 Impact Analysis |
4.2 Market Drivers |
4.2.1 Increasing population and urbanization leading to higher demand for carbonated beverages. |
4.2.2 Growing disposable income of the middle-class population in the Philippines. |
4.2.3 Changing consumer preferences towards convenience and on-the-go consumption. |
4.3 Market Restraints |
4.3.1 Health concerns and awareness regarding the negative effects of excessive sugar consumption in carbonated beverages. |
4.3.2 Government regulations and taxes on sugary drinks impacting consumption patterns. |
4.3.3 Competition from alternative beverages like flavored water, teas, and juices. |
5 Philippines Carbonate Market Trends |
6 Philippines Carbonate Market, By Types |
6.1 Philippines Carbonate Market, By Type |
6.1.1 Overview and Analysis |
6.1.2 Philippines Carbonate Market Revenues & Volume, By Type, 2021-2031F |
6.1.3 Philippines Carbonate Market Revenues & Volume, By Dimethyl, 2021-2031F |
6.1.4 Philippines Carbonate Market Revenues & Volume, By Propylene, 2021-2031F |
6.1.5 Philippines Carbonate Market Revenues & Volume, By Ethylene, 2021-2031F |
6.1.6 Philippines Carbonate Market Revenues & Volume, By Glycerol, 2021-2031F |
6.1.7 Philippines Carbonate Market Revenues & Volume, By 1,2-Epoxydodecane, 2021-2031F |
6.1.8 Philippines Carbonate Market Revenues & Volume, By 1,2-Hexadecene, 2021-2031F |
6.1.9 Philippines Carbonate Market Revenues & Volume, By Others, 2021-2031F |
6.1.10 Philippines Carbonate Market Revenues & Volume, By Others, 2021-2031F |
6.2 Philippines Carbonate Market, By Application |
6.2.1 Overview and Analysis |
6.2.2 Philippines Carbonate Market Revenues & Volume, By Solvents, 2021-2031F |
6.2.3 Philippines Carbonate Market Revenues & Volume, By Catalysts, 2021-2031F |
6.2.4 Philippines Carbonate Market Revenues & Volume, By Electrolytes, 2021-2031F |
6.2.5 Philippines Carbonate Market Revenues & Volume, By Additives, 2021-2031F |
6.2.6 Philippines Carbonate Market Revenues & Volume, By Cleaners, 2021-2031F |
6.2.7 Philippines Carbonate Market Revenues & Volume, By Others, 2021-2031F |
6.3 Philippines Carbonate Market, By End Use |
6.3.1 Overview and Analysis |
6.3.2 Philippines Carbonate Market Revenues & Volume, By Cosmetics & personal care, 2021-2031F |
6.3.3 Philippines Carbonate Market Revenues & Volume, By Paints & coatings, 2021-2031F |
6.3.4 Philippines Carbonate Market Revenues & Volume, By Pharmaceuticals, 2021-2031F |
6.3.5 Philippines Carbonate Market Revenues & Volume, By Textile, 2021-2031F |
6.3.6 Philippines Carbonate Market Revenues & Volume, By Energy & power, 2021-2031F |
6.3.7 Philippines Carbonate Market Revenues & Volume, By Polymer, 2021-2031F |
7 Philippines Carbonate Market Import-Export Trade Statistics |
7.1 Philippines Carbonate Market Export to Major Countries |
7.2 Philippines Carbonate Market Imports from Major Countries |
8 Philippines Carbonate Market Key Performance Indicators |
8.1 Per capita consumption of carbonated beverages in the Philippines. |
8.2 Number of new product launches or flavors in the carbonate market. |
8.3 Growth in the number of convenience stores and supermarkets stocking carbonated beverages. |
8.4 Consumer sentiment and perception towards carbonated beverages through surveys or focus groups. |
8.5 Trends in the use of environmentally friendly packaging and sustainable practices within the carbonate market. |
9 Philippines Carbonate Market - Opportunity Assessment |
9.1 Philippines Carbonate Market Opportunity Assessment, By Type, 2021 & 2031F |
9.2 Philippines Carbonate Market Opportunity Assessment, By Application, 2021 & 2031F |
9.3 Philippines Carbonate Market Opportunity Assessment, By End Use, 2021 & 2031F |
10 Philippines Carbonate Market - Competitive Landscape |
10.1 Philippines Carbonate Market Revenue Share, By Companies, 2024 |
10.2 Philippines Carbonate Market Competitive Benchmarking, By Operating and Technical Parameters |
11 Company Profiles |
12 Recommendations |
13 Disclaimer |
Global Go To Market Strategy - 2030
Export potential enables firms to identify high-growth global markets with greater confidence by combining advanced trade intelligence with a structured quantitative methodology. The framework analyzes emerging demand trends and country-level import patterns while integrating macroeconomic and trade datasets such as GDP and population forecasts, bilateral import–export flows, tariff structures, elasticity differentials between developed and developing economies, geographic distance, and import demand projections. Using weighted trade values from 2020–2024 as the base period to project country-to-country export potential for 2030, these inputs are operationalized through calculated drivers such as gravity model parameters, tariff impact factors, and projected GDP per-capita growth. Through an analysis of hidden potentials, demand hotspots, and market conditions that are most favorable to success, this method enables firms to focus on target countries, maximize returns, and global expansion with data, backed by accuracy.
By factoring in the projected importer demand gap that is currently unmet and could be potential opportunity, it identifies the potential for the Exporter (Country) among 190 countries, against the general trade analysis, which identifies the biggest importer or exporter.
To discover high-growth global markets and optimize your business strategy:
Click Here
Pricing
- Single User License$ 1,995
- Department License$ 2,400
- Site License$ 3,120
- Global License$ 3,795

Leadership Perspectives from Industry Events
Search
Thought Leadership and Analyst Meet


Our Clients
6WResearch In News
- India Air Conditioner Market Set for Strong Rebound in 2026 After Weather-Led Correction and GST-Driven Recovery: 6Wresearch
- ADAS in India: How Automatic Emergency Braking, Blind Spot Detection & Driver Monitoring are Transforming Road Safety
- Doha a strategic location for EV manufacturing hub: IPA Qatar
- Demand for luxury TVs surging in the GCC, says Samsung
- Empowering Growth: The Thriving Journey of Bangladesh’s Cable Industry
- Demand for luxury TVs surging in the GCC, says Samsung
Latest Reports
- Nicaragua RPG Gaming Market (2026-2032)
- New Zealand RPG Gaming Market (2026-2032)
- Netherlands RPG Gaming Market (2026-2032)
- Nauru RPG Gaming Market (2026-2032)
- Namibia RPG Gaming Market (2026-2032)
- Mozambique RPG Gaming Market (2026-2032)
- Montenegro RPG Gaming Market (2026-2032)
- Mongolia RPG Gaming Market (2026-2032)
- Monaco RPG Gaming Market (2026-2032)
- Micronesia RPG Gaming Market (2026-2032)
Industry Events and Analyst Meet

HIMTEX 2026

India Refining Summit 2026

India EV Show 2026

EV tech India Expo 2026

Auto Tech Asia 2026
Whitepaper
- Middle East & Africa Commercial Security Market Click here to view more.
- Middle East & Africa Fire Safety Systems & Equipment Market Click here to view more.
- GCC Drone Market Click here to view more.
- Middle East Lighting Fixture Market Click here to view more.
- GCC Physical & Perimeter Security Market Click here to view more.