Philippines Inorganic Pigments Market (2026-2032) Outlook | Revenue, Growth, Analysis, Forecast, Share, Industry, Value, Companies, Trends & Size
Market Forecast By Type (Titanium Dioxide, Iron Oxide, Cadmium, Carbon Blank, Lead Chromate, Chromium Oxide, Others), By Colour (Red, Yellow, Orange, Green, Blue, Black, White, Others), By Chemistry (Oxide, Silicate, Carbonate, Sulphate, Sulphide, Others), By Grade (Food Grade, Pharmaceutical Grade, Industrial Grade, Others), By Form (Powder, Liquid), By Application (Plastics, Paints & Coatings, Printing Inks, Glass & Ceramics, Cosmetics, Paper Industry, Food Industry, Others) And Competitive Landscape
| Product Code: ETC190541 | Publication Date: May 2022 | Updated Date: Jun 2026 | Product Type: Market Research Report | |
| Publisher: 6Wresearch | Author: Ravi Bhandari | No. of Pages: 60 | No. of Figures: 40 | No. of Tables: 7 |
Philippines Inorganic Pigments Market Size, Share & Growth Rate
The Philippines Inorganic Pigments Market was estimated at USD 154 Million in 2025 and is projected to reach USD 208 Million by 2032, growing at a CAGR of 4.4% from 2026 to 2032. This steady growth is underpinned by the relentless expansion of the construction sector and the ongoing demand for high-performance coatings, which continue to evolve alongside urbanization trends. As infrastructure investments rise, the market is likely to benefit from increased applications of inorganic pigments across various industries.
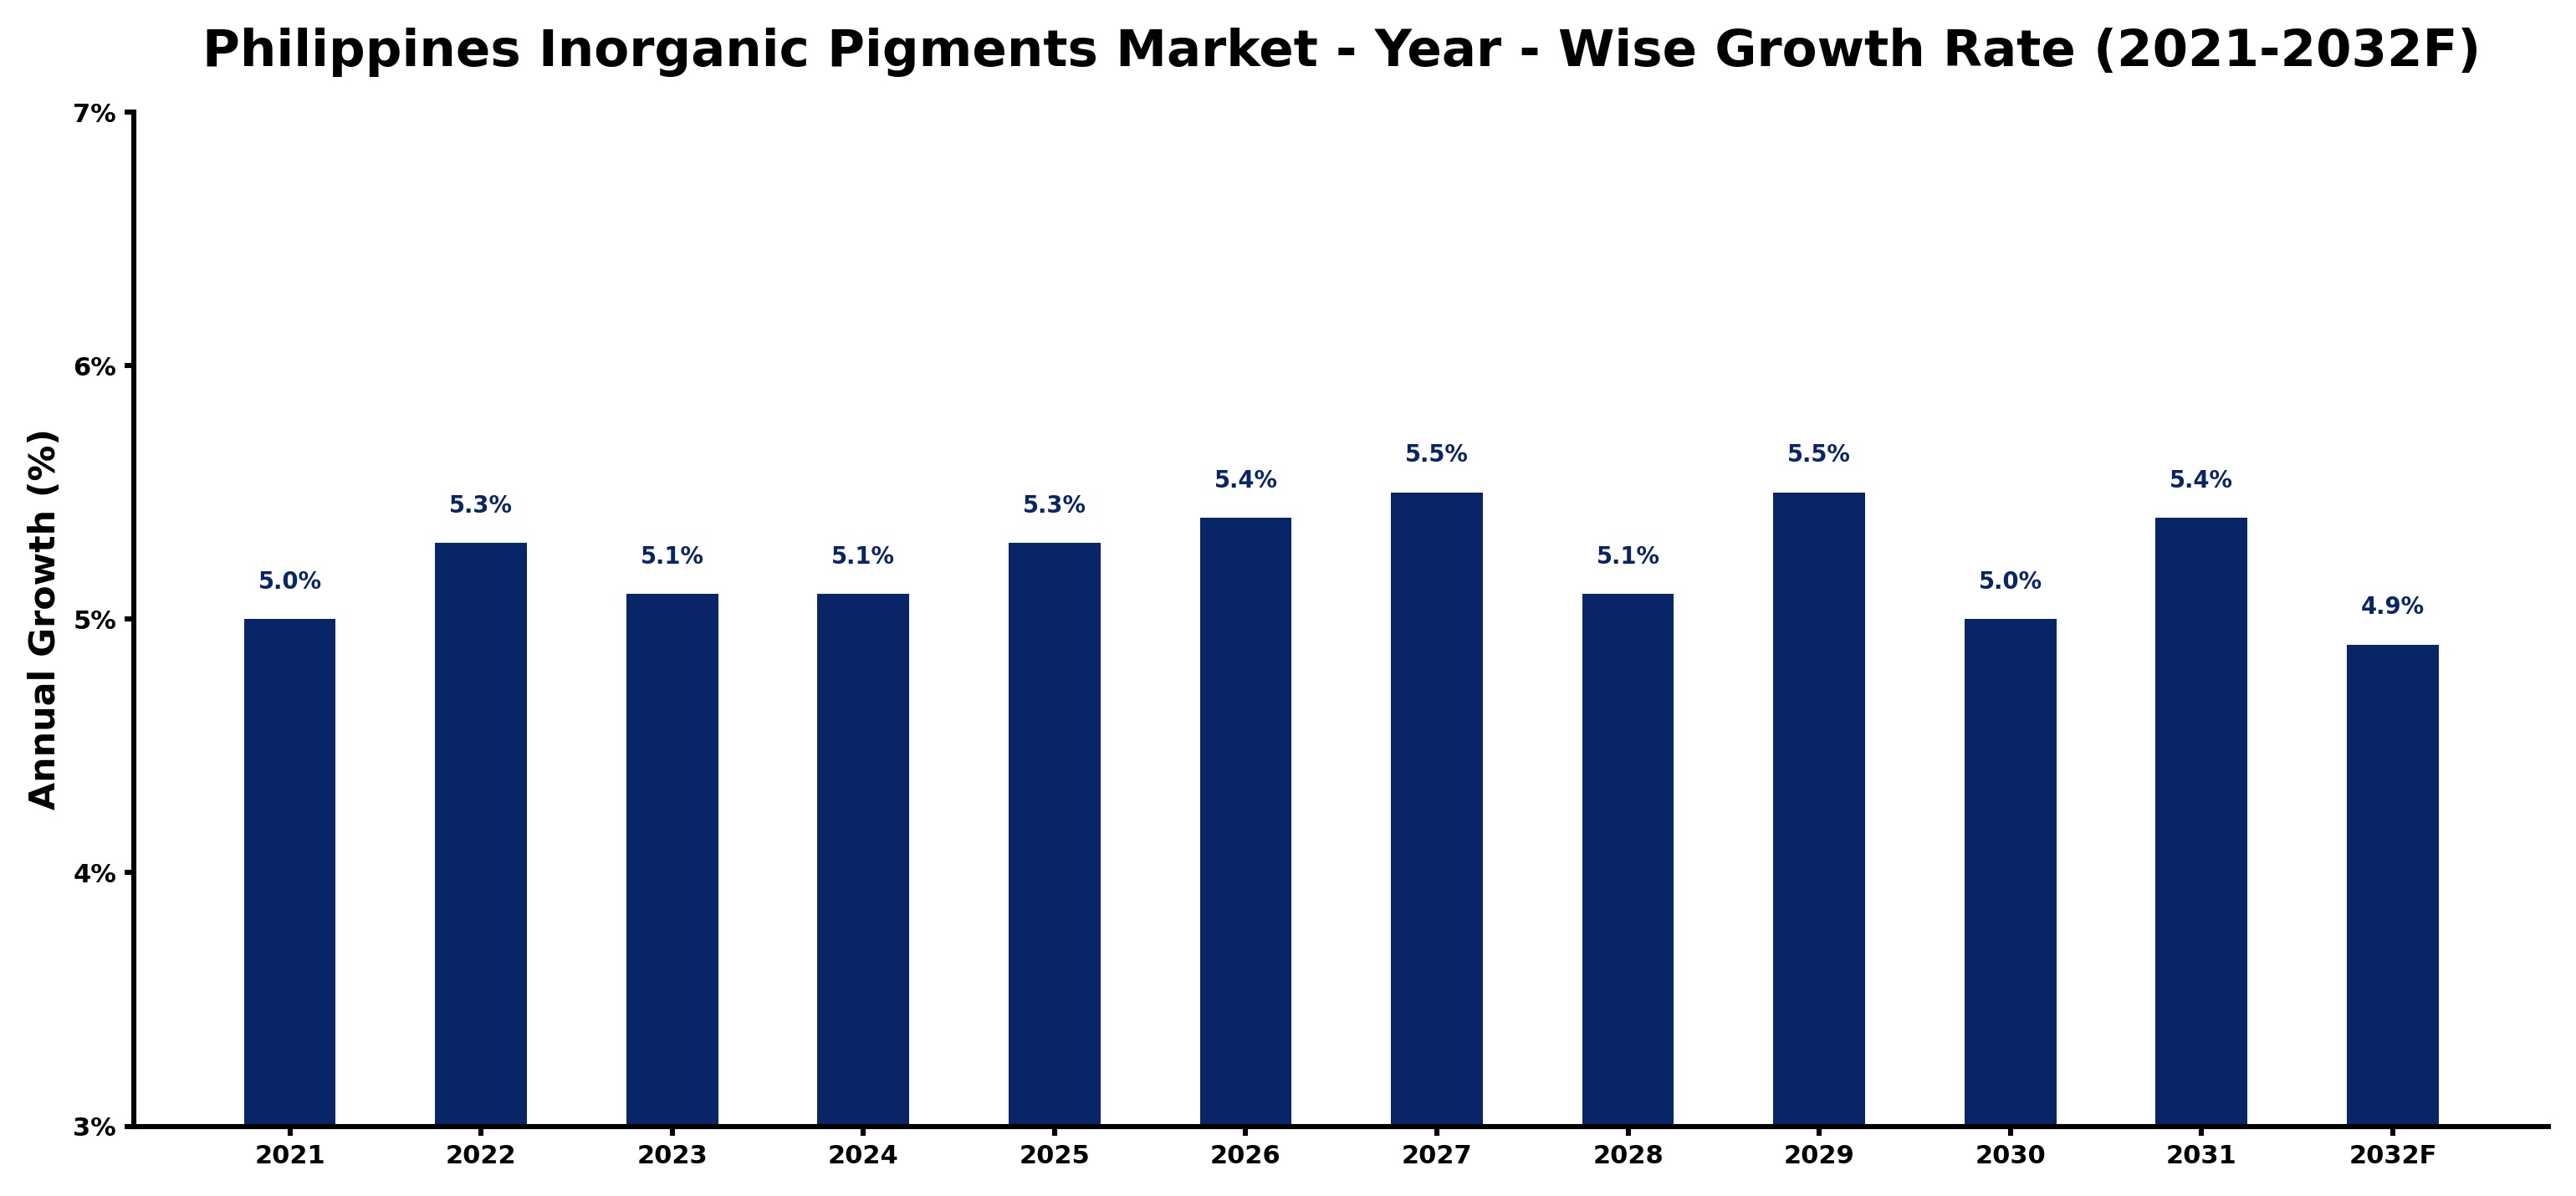
Philippines Inorganic Pigments Market Growth Rate Analysis (2021-2032)
The Philippines inorganic pigments market has exhibited stable growth, with annual increases ranging from 5.0% to 5.5% between 2021 and 2032. Notably, growth was strongest in 2027 at 5.5%, spurred by expanding applications in construction and automotive sectors, which demand high-quality pigments for coatings and aesthetics. Consumer demand for eco-friendly and durable products has also contributed to this upward trend. However, slight fluctuations were observed in 2023 and 2028, with dips to 5.1%, likely influenced by global supply chain disruptions and shifts in consumer preferences. The continuous investments in infrastructure and endeavors toward energy transition promise to sustain growth as businesses adapt to evolving technological standards and policies.
Philippines Inorganic Pigments Market Year-wise Growth Rate and Key Drivers
This graph highlights how the Philippines Inorganic Pigments Market has steadily grown over the past five years, supported by major growth factors.
The table below presents the year‑wise growth rates along with the key drivers influencing the market
| Year | Growth Rate | Major Drivers |
| 2021 | 5.0% | Increased construction activities boosted demand |
| 2022 | 5.3% | Automotive sector growth drove consumption |
| 2023 | 5.1% | Paint industry expansion increased usage |
| 2024 | 5.1% | Packaging sector growth enhanced sales |
| 2025 | 5.3% | Electronics manufacturing raised pigment needs |
| 2026 | 5.4% | Textile industry growth spurred demand |
| 2027 | 5.5% | Infrastructure projects increased pigment usage |
| 2028 | 5.1% | Cosmetic industry expansion drove sales |
| 2029 | 5.5% | Agricultural applications enhanced market growth |
| 2030 | 5.0% | Renewable energy projects boosted demand |
| 2031 | 5.4% | Consumer goods sector expanded significantly |
| 2032 | 4.9% | Sustainable product trends increased interest |
Note - Market size estimations and growth projections presented in this report are based on 6Wresearch’s advanced forecasting approach, validated with industry datasets as of June 2026.
Philippines Inorganic Pigments Market Synopsis
The inorganic pigments market in the Philippines is witnessing a transformation propelled by rapid urban development and industrial expansion. Recent trends indicate a significant shift towards durable and eco-friendly pigment solutions, reflecting growing consumer and regulatory demands for sustainability.
In 2022, the market reached an estimated value of USD 589.9 million, demonstrating the essential role of inorganic pigments in various applications such as automotive coatings, construction materials, and consumer goods. As the automotive sector continues to thrive, the market is positioned for further growth fueled by advancements in technology and increasing disposable income among consumers.
Philippines Inorganic Pigments Market Key Takeaways
- Demand for high-performance coatings is a primary driver of market growth.
- The construction sector contributes approximately 60% of total revenue generated.
- Metallic oxides dominate the market due to their desirable properties for outdoor applications.
- Eco-friendly pigments are gaining traction amid rising consumer awareness and regulatory pressures.
- The automotive industry’s expansion significantly impacts the demand for vehicle coatings.
Evaluation of Restraints in Philippines Inorganic Pigments Market
Despite the robust growth potential, the Philippines inorganic pigments market faces several constraints. Heightened regulatory scrutiny regarding heavy metals and harmful chemicals poses challenges for manufacturers striving to meet evolving compliance standards. Additionally, the increasing consumer preference for vibrant yet non-toxic pigments necessitates a balancing act, compelling industry players to innovate while keeping costs manageable. These dynamics create a competitive landscape where agility and responsiveness to market trends are critical for sustained success.
Philippines Inorganic Pigments Market Trends
A notable trend in the Philippines inorganic pigments market is the growing emphasis on sustainability, pushing manufacturers to invest in the development of eco-friendly alternatives. Furthermore, advancements in pigment formulations are enhancing durability and performance, catering to the demands of various applications. The increasing influence of aesthetic appeal in product design is also driving demand, particularly in the cosmetics and packaging sectors. The intersection of these trends is creating opportunities for innovation and growth across the market.
Philippines Inorganic Pigments Market Opportunities
Investment opportunities in the Philippines inorganic pigments market abound as demand from both the construction and automotive sectors escalates. Companies can capitalize on the shift toward sustainable production methods, integrating greener practices to attract environmentally-conscious consumers. Moreover, the anticipated growth of the residential and commercial building sectors presents a ripe environment for new players to enter, further enriching the competitive landscape.
Government Initiatives in the Philippines Inorganic Pigments Market
The Philippine government has initiated several policies to foster growth in the construction and manufacturing sectors, which indirectly benefits the inorganic pigments market. Public spending on infrastructure projects has been prioritized, reflecting a commitment to enhancing urban development. Additionally, various programs aimed at promoting sustainable practices in manufacturing are paving the way for the adoption of eco-friendly pigment solutions, thereby aligning with both local and international environmental standards.
Future Insights of the Philippines Inorganic Pigments Market
Looking ahead to 2026-2032, the Philippines inorganic pigments market is poised for a period of dynamic growth driven by continuous urbanization and infrastructural development. The increasing adoption of innovative pigment technologies will likely enhance product performance and sustainability. As consumer preferences evolve toward aesthetically pleasing and eco-conscious products, the industry must remain agile to capitalize on these changing dynamics and harness new market opportunities.
Philippines Inorganic Pigments Market Latest Developments (May 2025 - June 2026)
In recent months, the Philippines inorganic pigments market has seen shifts in production strategies aimed at meeting sustainability goals. Companies have begun to roll out initiatives focusing on the development of biodegradable pigments and environmentally friendly production processes. Moreover, investments in research and development are increasingly focused on enhancing the performance characteristics of pigments, aiming to meet both aesthetic and functional requirements across diverse applications.
Philippines Inorganic Pigments Market - Key Attractiveness of the Report
- 10 Years of Market Numbers
- Historical Data Starting from 2022 to 2025
- Base Year: 2025
- Forecast Data until 2032
- Key Performance Indicators Impacting the Market
- Major Upcoming Developments and Projects
Key Highlights of the Report:
- Philippines Inorganic Pigments Market Outlook
- Market Size of Philippines Inorganic Pigments Market, 2025
- Forecast of Philippines Inorganic Pigments Market, 2032
- Historical Data and Forecast of Philippines Inorganic Pigments Revenues & Volume for the Period 2022-2032F
- Philippines Inorganic Pigments Market Trend Evolution
- Philippines Inorganic Pigments Market Drivers and Challenges
- Philippines Inorganic Pigments Price Trends
- Philippines Inorganic Pigments Porter's Five Forces
- Philippines Inorganic Pigments Industry Life Cycle
- Historical Data and Forecast of Philippines Inorganic Pigments Market Revenues & Volume By Type for the Period 2022-2032F
- Historical Data and Forecast of Philippines Inorganic Pigments Market Revenues & Volume By Titanium Dioxide for the Period 2022-2032F
- Historical Data and Forecast of Philippines Inorganic Pigments Market Revenues & Volume By Iron Oxide, Cadmium for the Period 2022-2032F
- Historical Data and Forecast of Philippines Inorganic Pigments Market Revenues & Volume By Carbon Blank for the Period 2022-2032F
- Historical Data and Forecast of Philippines Inorganic Pigments Market Revenues & Volume By Lead Chromate for the Period 2022-2032F
- Historical Data and Forecast of Philippines Inorganic Pigments Market Revenues & Volume By Chromium Oxide for the Period 2022-2032F
- Historical Data and Forecast of Philippines Inorganic Pigments Market Revenues & Volume By Others for the Period 2022-2032F
- Historical Data and Forecast of Philippines Inorganic Pigments Market Revenues & Volume By Colour for the Period 2022-2032F
- Historical Data and Forecast of Philippines Inorganic Pigments Market Revenues & Volume By Red for the Period 2022-2032F
- Historical Data and Forecast of Philippines Inorganic Pigments Market Revenues & Volume By Yellow for the Period 2022-2032F
- Historical Data and Forecast of Philippines Inorganic Pigments Market Revenues & Volume By Orange for the Period 2022-2032F
- Historical Data and Forecast of Philippines Inorganic Pigments Market Revenues & Volume By Green for the Period 2022-2032F
- Historical Data and Forecast of Philippines Inorganic Pigments Market Revenues & Volume By Blue for the Period 2022-2032F
- Historical Data and Forecast of Philippines Inorganic Pigments Market Revenues & Volume By Black for the Period 2022-2032F
- Historical Data and Forecast of Philippines Inorganic Pigments Market Revenues & Volume By White for the Period 2022-2032F
- Historical Data and Forecast of Philippines Inorganic Pigments Market Revenues & Volume By Others for the Period 2022-2032F
- Historical Data and Forecast of Philippines Inorganic Pigments Market Revenues & Volume By Chemistry for the Period 2022-2032F
- Historical Data and Forecast of Philippines Inorganic Pigments Market Revenues & Volume By Oxide for the Period 2022-2032F
- Historical Data and Forecast of Philippines Inorganic Pigments Market Revenues & Volume By Silicate for the Period 2022-2032F
- Historical Data and Forecast of Philippines Inorganic Pigments Market Revenues & Volume By Carbonate for the Period 2022-2032F
- Historical Data and Forecast of Philippines Inorganic Pigments Market Revenues & Volume By Sulphate for the Period 2022-2032F
- Historical Data and Forecast of Philippines Inorganic Pigments Market Revenues & Volume By Sulphide for the Period 2022-2032F
- Historical Data and Forecast of Philippines Inorganic Pigments Market Revenues & Volume By Others for the Period 2022-2032F
- Historical Data and Forecast of Philippines Inorganic Pigments Market Revenues & Volume By Grade for the Period 2022-2032F
- Historical Data and Forecast of Philippines Inorganic Pigments Market Revenues & Volume By Food Grade for the Period 2022-2032F
- Historical Data and Forecast of Philippines Inorganic Pigments Market Revenues & Volume By Pharmaceutical Grade for the Period 2022-2032F
- Historical Data and Forecast of Philippines Inorganic Pigments Market Revenues & Volume By Industrial Grade for the Period 2022-2032F
- Historical Data and Forecast of Philippines Inorganic Pigments Market Revenues & Volume By Others for the Period 2022-2032F
- Historical Data and Forecast of Philippines Inorganic Pigments Market Revenues & Volume By Form for the Period 2022-2032F
- Historical Data and Forecast of Philippines Inorganic Pigments Market Revenues & Volume By Powder for the Period 2022-2032F
- Historical Data and Forecast of Philippines Inorganic Pigments Market Revenues & Volume By Liquid for the Period 2022-2032F
- Historical Data and Forecast of Philippines Inorganic Pigments Market Revenues & Volume By Application for the Period 2022-2032F
- Historical Data and Forecast of Philippines Inorganic Pigments Market Revenues & Volume By Plastics for the Period 2022-2032F
- Historical Data and Forecast of Philippines Inorganic Pigments Market Revenues & Volume By Paints & Coatings for the Period 2022-2032F
- Historical Data and Forecast of Philippines Inorganic Pigments Market Revenues & Volume By Printing Inks for the Period 2022-2032F
- Historical Data and Forecast of Philippines Inorganic Pigments Market Revenues & Volume By Glass & Ceramics for the Period 2022-2032F
- Historical Data and Forecast of Philippines Inorganic Pigments Market Revenues & Volume By Cosmetics for the Period 2022-2032F
- Historical Data and Forecast of Philippines Inorganic Pigments Market Revenues & Volume By Paper Industry for the Period 2022-2032F
- Historical Data and Forecast of Philippines Inorganic Pigments Market Revenues & Volume By Food Industry for the Period 2022-2032F
- Historical Data and Forecast of Philippines Inorganic Pigments Market Revenues & Volume By Others for the Period 2022-2032F
- Philippines Inorganic Pigments Import Export Trade Statistics
- Market Opportunity Assessment By Type
- Market Opportunity Assessment By Colour
- Market Opportunity Assessment By Chemistry
- Market Opportunity Assessment By Grade
- Market Opportunity Assessment By Form
- Market Opportunity Assessment By Application
- Philippines Inorganic Pigments Top Companies Market Share
- Philippines Inorganic Pigments Competitive Benchmarking By Technical and Operational Parameters
- Philippines Inorganic Pigments Company Profiles
- Philippines Inorganic Pigments Key Strategic Recommendations
Philippines Inorganic Pigments Market - Frequently Asked Questions
The growth is primarily driven by increasing investments in infrastructure, rising demand for high-performance coatings, and the expansion of the automotive sector.
The pandemic temporarily slowed demand in sectors like construction and consumer goods, but companies have adapted by diversifying their strategies and focusing on resilient market segments.
The market is estimated to reach USD 154 Million in 2025 and is projected to grow to USD 208 Million by 2032, reflecting a CAGR of 4.4% from 2026 to 2032.
The construction sector stands out, accounting for nearly 60% of the total revenue, with the automotive and consumer goods sectors also being significant contributors.
Yes, trends include a shift towards eco-friendly products, advancements in technology for pigment formulation, and increasing consumer preferences for aesthetically pleasing products.
6Wresearch actively monitors the Philippines Inorganic Pigments Market and publishes its comprehensive annual report, highlighting emerging trends, growth drivers, revenue analysis, and forecast outlook. Our insights help businesses to make data-backed strategic decisions with ongoing market dynamics. Our analysts track relevent industries related to the Philippines Inorganic Pigments Market, allowing our clients with actionable intelligence and reliable forecasts tailored to emerging regional needs.
Yes, we provide customisation as per your requirements. To learn more, feel free to contact us on sales@6wresearch.com
1 Executive Summary |
2 Introduction |
2.1 Key Highlights of the Report |
2.2 Report Description |
2.3 Market Scope & Segmentation |
2.4 Research Methodology |
2.5 Assumptions |
3 Philippines Inorganic Pigments Market Overview |
3.1 Philippines Country Macro Economic Indicators |
3.2 Philippines Inorganic Pigments Market Revenues & Volume, 2022 & 2032F |
3.3 Philippines Inorganic Pigments Market - Industry Life Cycle |
3.4 Philippines Inorganic Pigments Market - Porter's Five Forces |
3.5 Philippines Inorganic Pigments Market Revenues & Volume Share, By Type, 2022 & 2032F |
3.6 Philippines Inorganic Pigments Market Revenues & Volume Share, By Colour, 2022 & 2032F |
3.7 Philippines Inorganic Pigments Market Revenues & Volume Share, By Chemistry, 2022 & 2032F |
3.8 Philippines Inorganic Pigments Market Revenues & Volume Share, By Grade, 2022 & 2032F |
3.9 Philippines Inorganic Pigments Market Revenues & Volume Share, By Form, 2022 & 2032F |
3.10 Philippines Inorganic Pigments Market Revenues & Volume Share, By Application, 2022 & 2032F |
4 Philippines Inorganic Pigments Market Dynamics |
4.1 Impact Analysis |
4.2 Market Drivers |
4.2.1 Growing demand from end-use industries such as construction, automotive, and packaging |
4.2.2 Increasing investments in infrastructure projects in the Philippines |
4.2.3 Rising disposable income and changing consumer preferences towards high-quality products |
4.3 Market Restraints |
4.3.1 Volatility in raw material prices impacting production costs |
4.3.2 Stringent environmental regulations and increasing focus on sustainable practices |
4.3.3 Intense market competition leading to pricing pressures |
5 Philippines Inorganic Pigments Market Trends |
6 Philippines Inorganic Pigments Market, By Types |
6.1 Philippines Inorganic Pigments Market, By Type |
6.1.1 Overview and Analysis |
6.1.2 Philippines Inorganic Pigments Market Revenues & Volume, By Type, 2022-2032F |
6.1.3 Philippines Inorganic Pigments Market Revenues & Volume, By Titanium Dioxide, 2022-2032F |
6.1.4 Philippines Inorganic Pigments Market Revenues & Volume, By Iron Oxide, Cadmium, 2022-2032F |
6.1.5 Philippines Inorganic Pigments Market Revenues & Volume, By Carbon Blank, 2022-2032F |
6.1.6 Philippines Inorganic Pigments Market Revenues & Volume, By Lead Chromate, 2022-2032F |
6.1.7 Philippines Inorganic Pigments Market Revenues & Volume, By Chromium Oxide, 2022-2032F |
6.1.8 Philippines Inorganic Pigments Market Revenues & Volume, By Others, 2022-2032F |
6.2 Philippines Inorganic Pigments Market, By Colour |
6.2.1 Overview and Analysis |
6.2.2 Philippines Inorganic Pigments Market Revenues & Volume, By Red, 2022-2032F |
6.2.3 Philippines Inorganic Pigments Market Revenues & Volume, By Yellow, 2022-2032F |
6.2.4 Philippines Inorganic Pigments Market Revenues & Volume, By Orange, 2022-2032F |
6.2.5 Philippines Inorganic Pigments Market Revenues & Volume, By Green, 2022-2032F |
6.2.6 Philippines Inorganic Pigments Market Revenues & Volume, By Blue, 2022-2032F |
6.2.7 Philippines Inorganic Pigments Market Revenues & Volume, By Black, 2022-2032F |
6.2.8 Philippines Inorganic Pigments Market Revenues & Volume, By Others, 2022-2032F |
6.2.9 Philippines Inorganic Pigments Market Revenues & Volume, By Others, 2022-2032F |
6.3 Philippines Inorganic Pigments Market, By Chemistry |
6.3.1 Overview and Analysis |
6.3.2 Philippines Inorganic Pigments Market Revenues & Volume, By Oxide, 2022-2032F |
6.3.3 Philippines Inorganic Pigments Market Revenues & Volume, By Silicate, 2022-2032F |
6.3.4 Philippines Inorganic Pigments Market Revenues & Volume, By Carbonate, 2022-2032F |
6.3.5 Philippines Inorganic Pigments Market Revenues & Volume, By Sulphate, 2022-2032F |
6.3.6 Philippines Inorganic Pigments Market Revenues & Volume, By Sulphide, 2022-2032F |
6.3.7 Philippines Inorganic Pigments Market Revenues & Volume, By Others, 2022-2032F |
6.4 Philippines Inorganic Pigments Market, By Grade |
6.4.1 Overview and Analysis |
6.4.2 Philippines Inorganic Pigments Market Revenues & Volume, By Food Grade, 2022-2032F |
6.4.3 Philippines Inorganic Pigments Market Revenues & Volume, By Pharmaceutical Grade, 2022-2032F |
6.4.4 Philippines Inorganic Pigments Market Revenues & Volume, By Industrial Grade, 2022-2032F |
6.4.5 Philippines Inorganic Pigments Market Revenues & Volume, By Others, 2022-2032F |
6.5 Philippines Inorganic Pigments Market, By Form |
6.5.1 Overview and Analysis |
6.5.2 Philippines Inorganic Pigments Market Revenues & Volume, By Powder, 2022-2032F |
6.5.3 Philippines Inorganic Pigments Market Revenues & Volume, By Liquid, 2022-2032F |
6.6 Philippines Inorganic Pigments Market, By Application |
6.6.1 Overview and Analysis |
6.6.2 Philippines Inorganic Pigments Market Revenues & Volume, By Plastics, 2022-2032F |
6.6.3 Philippines Inorganic Pigments Market Revenues & Volume, By Paints & Coatings, 2022-2032F |
6.6.4 Philippines Inorganic Pigments Market Revenues & Volume, By Printing Inks, 2022-2032F |
6.6.5 Philippines Inorganic Pigments Market Revenues & Volume, By Glass & Ceramics, 2022-2032F |
6.6.6 Philippines Inorganic Pigments Market Revenues & Volume, By Cosmetics, 2022-2032F |
6.6.7 Philippines Inorganic Pigments Market Revenues & Volume, By Paper Industry, 2022-2032F |
6.6.8 Philippines Inorganic Pigments Market Revenues & Volume, By Others, 2022-2032F |
6.6.9 Philippines Inorganic Pigments Market Revenues & Volume, By Others, 2022-2032F |
7 Philippines Inorganic Pigments Market Import-Export Trade Statistics |
7.1 Philippines Inorganic Pigments Market Export to Major Countries |
7.2 Philippines Inorganic Pigments Market Imports from Major Countries |
8 Philippines Inorganic Pigments Market Key Performance Indicators |
8.1 Percentage increase in the number of infrastructure projects utilizing inorganic pigments |
8.2 Growth in demand from key end-use industries such as construction and automotive |
8.3 Adoption rate of new environmentally friendly production technologies |
8.4 Percentage of market players investing in research and development for innovative pigment solutions |
8.5 Number of strategic partnerships or collaborations formed for market expansion and product development |
9 Philippines Inorganic Pigments Market - Opportunity Assessment |
9.1 Philippines Inorganic Pigments Market Opportunity Assessment, By Type, 2022 & 2032F |
9.2 Philippines Inorganic Pigments Market Opportunity Assessment, By Colour, 2022 & 2032F |
9.3 Philippines Inorganic Pigments Market Opportunity Assessment, By Chemistry, 2022 & 2032F |
9.4 Philippines Inorganic Pigments Market Opportunity Assessment, By Grade, 2022 & 2032F |
9.5 Philippines Inorganic Pigments Market Opportunity Assessment, By Form, 2022 & 2032F |
9.6 Philippines Inorganic Pigments Market Opportunity Assessment, By Application, 2022 & 2032F |
10 Philippines Inorganic Pigments Market - Competitive Landscape |
10.1 Philippines Inorganic Pigments Market Revenue Share, By Companies, 2025 |
10.2 Philippines Inorganic Pigments Market Competitive Benchmarking, By Operating and Technical Parameters |
11 Company Profiles |
12 Recommendations |
13 Disclaimer |
Global Go To Market Strategy - 2030
Export potential enables firms to identify high-growth global markets with greater confidence by combining advanced trade intelligence with a structured quantitative methodology. The framework analyzes emerging demand trends and country-level import patterns while integrating macroeconomic and trade datasets such as GDP and population forecasts, bilateral import–export flows, tariff structures, elasticity differentials between developed and developing economies, geographic distance, and import demand projections. Using weighted trade values from 2020–2024 as the base period to project country-to-country export potential for 2030, these inputs are operationalized through calculated drivers such as gravity model parameters, tariff impact factors, and projected GDP per-capita growth. Through an analysis of hidden potentials, demand hotspots, and market conditions that are most favorable to success, this method enables firms to focus on target countries, maximize returns, and global expansion with data, backed by accuracy.
By factoring in the projected importer demand gap that is currently unmet and could be potential opportunity, it identifies the potential for the Exporter (Country) among 190 countries, against the general trade analysis, which identifies the biggest importer or exporter.
To discover high-growth global markets and optimize your business strategy:
Click Here
Pricing
- Single User License$ 1,995
- Department License$ 2,400
- Site License$ 3,120
- Global License$ 3,795

Leadership Perspectives from Industry Events
Search
Thought Leadership and Analyst Meet


Our Clients
6WResearch In News
- India Air Conditioner Market Set for Strong Rebound in 2026 After Weather-Led Correction and GST-Driven Recovery: 6Wresearch
- ADAS in India: How Automatic Emergency Braking, Blind Spot Detection & Driver Monitoring are Transforming Road Safety
- Doha a strategic location for EV manufacturing hub: IPA Qatar
- Demand for luxury TVs surging in the GCC, says Samsung
- Empowering Growth: The Thriving Journey of Bangladesh’s Cable Industry
- Demand for luxury TVs surging in the GCC, says Samsung
Latest Reports
- Nicaragua RPG Gaming Market (2026-2032)
- New Zealand RPG Gaming Market (2026-2032)
- Netherlands RPG Gaming Market (2026-2032)
- Nauru RPG Gaming Market (2026-2032)
- Namibia RPG Gaming Market (2026-2032)
- Mozambique RPG Gaming Market (2026-2032)
- Montenegro RPG Gaming Market (2026-2032)
- Mongolia RPG Gaming Market (2026-2032)
- Monaco RPG Gaming Market (2026-2032)
- Micronesia RPG Gaming Market (2026-2032)
Industry Events and Analyst Meet

HIMTEX 2026

India Refining Summit 2026

India EV Show 2026

EV tech India Expo 2026

Auto Tech Asia 2026
Whitepaper
- Middle East & Africa Commercial Security Market Click here to view more.
- Middle East & Africa Fire Safety Systems & Equipment Market Click here to view more.
- GCC Drone Market Click here to view more.
- Middle East Lighting Fixture Market Click here to view more.
- GCC Physical & Perimeter Security Market Click here to view more.