Philippines Motorcycle Drive Chain Market (2025-2031) | Trends, Outlook, Value, Segmentation, Forecast, Analysis, Size & Revenue, Companies, Growth, Competitive Landscape, Share, Industry
Market Forecast By Types (Standard, Cruiser, Sports, Off-Road), By Chain type (Standard Rolling Chain, O Ring Chain, X Ring Chain), By Engine Capacity (Up to 150 CC, 151-300 CC, 301-500 CC, Above 500 CC), By Material Type (Mild Steel, Cast Steel, Cast Iron), By Distribution Channel (Online, Offline) And Competitive Landscape
| Product Code: ETC8846106 | Publication Date: Sep 2024 | Updated Date: Nov 2025 | Product Type: Market Research Report | |
| Publisher: 6Wresearch | Author: Shubham Deep | No. of Pages: 75 | No. of Figures: 35 | No. of Tables: 20 |
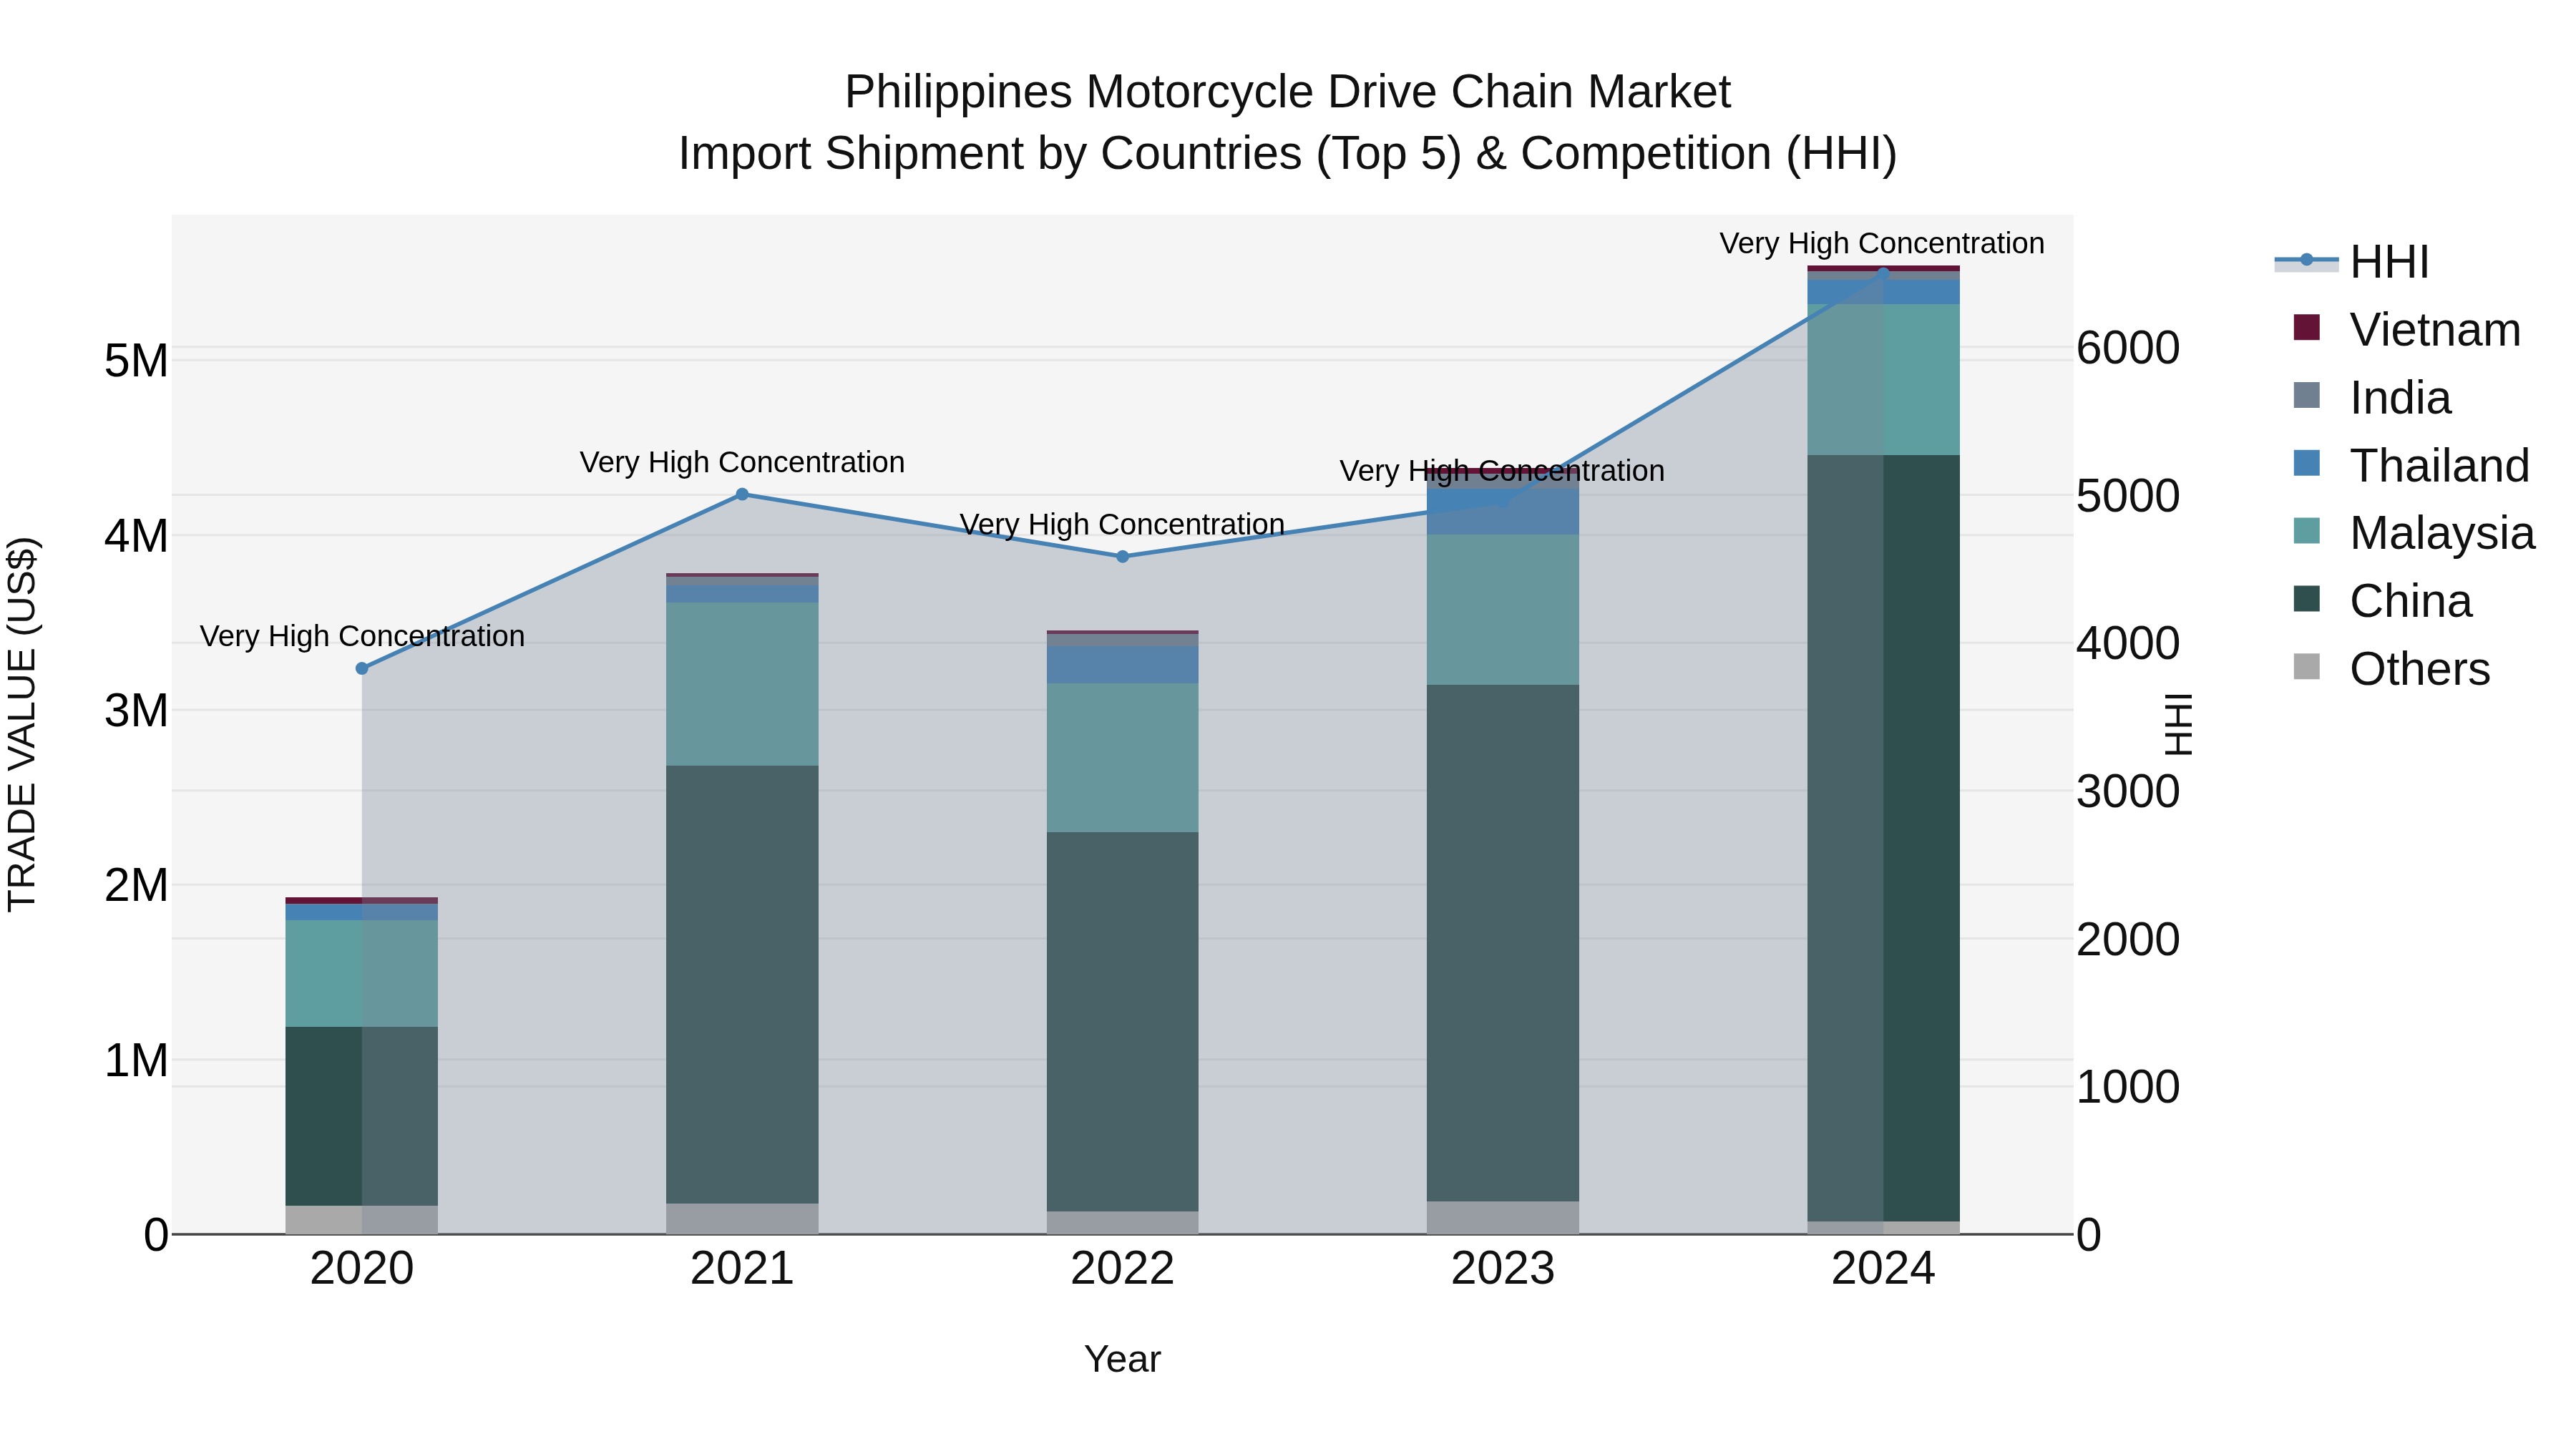
Philippines Motorcycle Drive Chain Market Top 5 Importing Countries and Market Competition (HHI) Analysis
The Philippines motorcycle drive chain import market saw significant growth in 2024, with top exporting countries including China, Malaysia, Thailand, India, and Vietnam dominating the market. Despite high concentration levels indicated by the Herfindahl-Hirschman Index (HHI), the industry experienced a remarkable Compound Annual Growth Rate (CAGR) of 30.18% from 2020 to 2024. The growth momentum continued in 2024 with a notable growth rate of 26.4% compared to the previous year, showcasing a thriving market for motorcycle drive chains in the Philippines.
Philippines Motorcycle Drive Chain Market Overview
As motorcycles remain a primary mode of transport in the Philippines, the drive chain market continues to thrive. Manufacturers focus on producing high-strength and corrosion-resistant drive chains, catering to both daily commuters and high-performance bike enthusiasts.
Drivers of the market
The expanding two-wheeler market in the Philippines, driven by increasing urbanization and affordability of motorcycles, is fueling the demand for drive chains. The shift toward high-performance and low-maintenance drive chains is gaining popularity among riders. Additionally, the availability of advanced lubrication and sealing technologies is improving the lifespan and efficiency of motorcycle drive chains.
Challenges of the market
The primary challenge in this market is the widespread use of low-quality drive chains, leading to frequent replacements and increased maintenance costs for riders. The dominance of imported products also makes prices highly volatile. Limited consumer awareness regarding proper maintenance further affects the longevity and performance of motorcycle drive chains.
Investment opportunities in the Market
The need for efficient and long-lasting motorcycle drive chains is increasing. Investors can enter the market by supplying OEM and aftermarket drive chains for different motorcycle brands.
Government Policy of the market
Drive chains are essential for motorcycle efficiency and safety, leading the government to regulate their manufacturing and importation. The DTI, along with the Bureau of Product Standards (BPS), ensures that all drive chains meet safety requirements before being sold in the market.
Key Highlights of the Report:
- Philippines Motorcycle Drive Chain Market Outlook
- Market Size of Philippines Motorcycle Drive Chain Market, 2024
- Forecast of Philippines Motorcycle Drive Chain Market, 2031
- Historical Data and Forecast of Philippines Motorcycle Drive Chain Revenues & Volume for the Period 2021- 2031
- Philippines Motorcycle Drive Chain Market Trend Evolution
- Philippines Motorcycle Drive Chain Market Drivers and Challenges
- Philippines Motorcycle Drive Chain Price Trends
- Philippines Motorcycle Drive Chain Porter's Five Forces
- Philippines Motorcycle Drive Chain Industry Life Cycle
- Historical Data and Forecast of Philippines Motorcycle Drive Chain Market Revenues & Volume By Types for the Period 2021- 2031
- Historical Data and Forecast of Philippines Motorcycle Drive Chain Market Revenues & Volume By Standard for the Period 2021- 2031
- Historical Data and Forecast of Philippines Motorcycle Drive Chain Market Revenues & Volume By Cruiser for the Period 2021- 2031
- Historical Data and Forecast of Philippines Motorcycle Drive Chain Market Revenues & Volume By Sports for the Period 2021- 2031
- Historical Data and Forecast of Philippines Motorcycle Drive Chain Market Revenues & Volume By Off-Road for the Period 2021- 2031
- Historical Data and Forecast of Philippines Motorcycle Drive Chain Market Revenues & Volume By Chain type for the Period 2021- 2031
- Historical Data and Forecast of Philippines Motorcycle Drive Chain Market Revenues & Volume By Standard Rolling Chain for the Period 2021- 2031
- Historical Data and Forecast of Philippines Motorcycle Drive Chain Market Revenues & Volume By O Ring Chain for the Period 2021- 2031
- Historical Data and Forecast of Philippines Motorcycle Drive Chain Market Revenues & Volume By X Ring Chain for the Period 2021- 2031
- Historical Data and Forecast of Philippines Motorcycle Drive Chain Market Revenues & Volume By Engine Capacity for the Period 2021- 2031
- Historical Data and Forecast of Philippines Motorcycle Drive Chain Market Revenues & Volume By Up to 150 CC for the Period 2021- 2031
- Historical Data and Forecast of Philippines Motorcycle Drive Chain Market Revenues & Volume By 151-300 CC for the Period 2021- 2031
- Historical Data and Forecast of Philippines Motorcycle Drive Chain Market Revenues & Volume By 301-500 CC for the Period 2021- 2031
- Historical Data and Forecast of Philippines Motorcycle Drive Chain Market Revenues & Volume By Above 500 CC for the Period 2021- 2031
- Historical Data and Forecast of Philippines Motorcycle Drive Chain Market Revenues & Volume By Material Type for the Period 2021- 2031
- Historical Data and Forecast of Philippines Motorcycle Drive Chain Market Revenues & Volume By Mild Steel for the Period 2021- 2031
- Historical Data and Forecast of Philippines Motorcycle Drive Chain Market Revenues & Volume By Cast Steel for the Period 2021- 2031
- Historical Data and Forecast of Philippines Motorcycle Drive Chain Market Revenues & Volume By Cast Iron for the Period 2021- 2031
- Historical Data and Forecast of Philippines Motorcycle Drive Chain Market Revenues & Volume By Distribution Channel for the Period 2021- 2031
- Historical Data and Forecast of Philippines Motorcycle Drive Chain Market Revenues & Volume By Online for the Period 2021- 2031
- Historical Data and Forecast of Philippines Motorcycle Drive Chain Market Revenues & Volume By Offline for the Period 2021- 2031
- Philippines Motorcycle Drive Chain Import Export Trade Statistics
- Market Opportunity Assessment By Types
- Market Opportunity Assessment By Chain type
- Market Opportunity Assessment By Engine Capacity
- Market Opportunity Assessment By Material Type
- Market Opportunity Assessment By Distribution Channel
- Philippines Motorcycle Drive Chain Top Companies Market Share
- Philippines Motorcycle Drive Chain Competitive Benchmarking By Technical and Operational Parameters
- Philippines Motorcycle Drive Chain Company Profiles
- Philippines Motorcycle Drive Chain Key Strategic Recommendations
Frequently Asked Questions About the Market Study (FAQs):
6Wresearch actively monitors the Philippines Motorcycle Drive Chain Market and publishes its comprehensive annual report, highlighting emerging trends, growth drivers, revenue analysis, and forecast outlook. Our insights help businesses to make data-backed strategic decisions with ongoing market dynamics. Our analysts track relevent industries related to the Philippines Motorcycle Drive Chain Market, allowing our clients with actionable intelligence and reliable forecasts tailored to emerging regional needs.
Yes, we provide customisation as per your requirements. To learn more, feel free to contact us on sales@6wresearch.com
1 Executive Summary |
2 Introduction |
2.1 Key Highlights of the Report |
2.2 Report Description |
2.3 Market Scope & Segmentation |
2.4 Research Methodology |
2.5 Assumptions |
3 Philippines Motorcycle Drive Chain Market Overview |
3.1 Philippines Country Macro Economic Indicators |
3.2 Philippines Motorcycle Drive Chain Market Revenues & Volume, 2021 & 2031F |
3.3 Philippines Motorcycle Drive Chain Market - Industry Life Cycle |
3.4 Philippines Motorcycle Drive Chain Market - Porter's Five Forces |
3.5 Philippines Motorcycle Drive Chain Market Revenues & Volume Share, By Types, 2021 & 2031F |
3.6 Philippines Motorcycle Drive Chain Market Revenues & Volume Share, By Chain type, 2021 & 2031F |
3.7 Philippines Motorcycle Drive Chain Market Revenues & Volume Share, By Engine Capacity, 2021 & 2031F |
3.8 Philippines Motorcycle Drive Chain Market Revenues & Volume Share, By Material Type, 2021 & 2031F |
3.9 Philippines Motorcycle Drive Chain Market Revenues & Volume Share, By Distribution Channel, 2021 & 2031F |
4 Philippines Motorcycle Drive Chain Market Dynamics |
4.1 Impact Analysis |
4.2 Market Drivers |
4.2.1 Increasing motorcycle sales in the Philippines |
4.2.2 Growth in the tourism industry leading to higher demand for motorcycle rentals |
4.2.3 Expansion of e-commerce platforms boosting delivery services |
4.3 Market Restraints |
4.3.1 Fluctuating raw material prices impacting production costs |
4.3.2 Competition from alternative transportation modes like electric scooters |
4.3.3 Regulatory changes affecting import/export of motorcycle drive chains |
5 Philippines Motorcycle Drive Chain Market Trends |
6 Philippines Motorcycle Drive Chain Market, By Types |
6.1 Philippines Motorcycle Drive Chain Market, By Types |
6.1.1 Overview and Analysis |
6.1.2 Philippines Motorcycle Drive Chain Market Revenues & Volume, By Types, 2021- 2031F |
6.1.3 Philippines Motorcycle Drive Chain Market Revenues & Volume, By Standard, 2021- 2031F |
6.1.4 Philippines Motorcycle Drive Chain Market Revenues & Volume, By Cruiser, 2021- 2031F |
6.1.5 Philippines Motorcycle Drive Chain Market Revenues & Volume, By Sports, 2021- 2031F |
6.1.6 Philippines Motorcycle Drive Chain Market Revenues & Volume, By Off-Road, 2021- 2031F |
6.2 Philippines Motorcycle Drive Chain Market, By Chain type |
6.2.1 Overview and Analysis |
6.2.2 Philippines Motorcycle Drive Chain Market Revenues & Volume, By Standard Rolling Chain, 2021- 2031F |
6.2.3 Philippines Motorcycle Drive Chain Market Revenues & Volume, By O Ring Chain, 2021- 2031F |
6.2.4 Philippines Motorcycle Drive Chain Market Revenues & Volume, By X Ring Chain, 2021- 2031F |
6.3 Philippines Motorcycle Drive Chain Market, By Engine Capacity |
6.3.1 Overview and Analysis |
6.3.2 Philippines Motorcycle Drive Chain Market Revenues & Volume, By Up to 150 CC, 2021- 2031F |
6.3.3 Philippines Motorcycle Drive Chain Market Revenues & Volume, By 151-300 CC, 2021- 2031F |
6.3.4 Philippines Motorcycle Drive Chain Market Revenues & Volume, By 301-500 CC, 2021- 2031F |
6.3.5 Philippines Motorcycle Drive Chain Market Revenues & Volume, By Above 500 CC, 2021- 2031F |
6.4 Philippines Motorcycle Drive Chain Market, By Material Type |
6.4.1 Overview and Analysis |
6.4.2 Philippines Motorcycle Drive Chain Market Revenues & Volume, By Mild Steel, 2021- 2031F |
6.4.3 Philippines Motorcycle Drive Chain Market Revenues & Volume, By Cast Steel, 2021- 2031F |
6.4.4 Philippines Motorcycle Drive Chain Market Revenues & Volume, By Cast Iron, 2021- 2031F |
6.5 Philippines Motorcycle Drive Chain Market, By Distribution Channel |
6.5.1 Overview and Analysis |
6.5.2 Philippines Motorcycle Drive Chain Market Revenues & Volume, By Online, 2021- 2031F |
6.5.3 Philippines Motorcycle Drive Chain Market Revenues & Volume, By Offline, 2021- 2031F |
7 Philippines Motorcycle Drive Chain Market Import-Export Trade Statistics |
7.1 Philippines Motorcycle Drive Chain Market Export to Major Countries |
7.2 Philippines Motorcycle Drive Chain Market Imports from Major Countries |
8 Philippines Motorcycle Drive Chain Market Key Performance Indicators |
8.1 Average age of motorcycles in operation |
8.2 Number of motorcycle repair and maintenance shops |
8.3 Average distance traveled by motorcycles annually |
9 Philippines Motorcycle Drive Chain Market - Opportunity Assessment |
9.1 Philippines Motorcycle Drive Chain Market Opportunity Assessment, By Types, 2021 & 2031F |
9.2 Philippines Motorcycle Drive Chain Market Opportunity Assessment, By Chain type, 2021 & 2031F |
9.3 Philippines Motorcycle Drive Chain Market Opportunity Assessment, By Engine Capacity, 2021 & 2031F |
9.4 Philippines Motorcycle Drive Chain Market Opportunity Assessment, By Material Type, 2021 & 2031F |
9.5 Philippines Motorcycle Drive Chain Market Opportunity Assessment, By Distribution Channel, 2021 & 2031F |
10 Philippines Motorcycle Drive Chain Market - Competitive Landscape |
10.1 Philippines Motorcycle Drive Chain Market Revenue Share, By Companies, 2024 |
10.2 Philippines Motorcycle Drive Chain Market Competitive Benchmarking, By Operating and Technical Parameters |
11 Company Profiles |
12 Recommendations |
13 Disclaimer |
Global Go To Market Strategy - 2030
Export potential enables firms to identify high-growth global markets with greater confidence by combining advanced trade intelligence with a structured quantitative methodology. The framework analyzes emerging demand trends and country-level import patterns while integrating macroeconomic and trade datasets such as GDP and population forecasts, bilateral import–export flows, tariff structures, elasticity differentials between developed and developing economies, geographic distance, and import demand projections. Using weighted trade values from 2020–2024 as the base period to project country-to-country export potential for 2030, these inputs are operationalized through calculated drivers such as gravity model parameters, tariff impact factors, and projected GDP per-capita growth. Through an analysis of hidden potentials, demand hotspots, and market conditions that are most favorable to success, this method enables firms to focus on target countries, maximize returns, and global expansion with data, backed by accuracy.
By factoring in the projected importer demand gap that is currently unmet and could be potential opportunity, it identifies the potential for the Exporter (Country) among 190 countries, against the general trade analysis, which identifies the biggest importer or exporter.
To discover high-growth global markets and optimize your business strategy:
Click Here
Pricing
- Single User License$ 1,995
- Department License$ 2,400
- Site License$ 3,120
- Global License$ 3,795

Leadership Perspectives from Industry Events
Search
Thought Leadership and Analyst Meet


Our Clients
6WResearch In News
- Doha a strategic location for EV manufacturing hub: IPA Qatar
- Demand for luxury TVs surging in the GCC, says Samsung
- Empowering Growth: The Thriving Journey of Bangladesh’s Cable Industry
- Demand for luxury TVs surging in the GCC, says Samsung
- Video call with a traditional healer? Once unthinkable, it’s now common in South Africa
- Intelligent Buildings To Smooth GCC’s Path To Net Zero
Latest Reports
- Taiwan Airport Wireless Infrastructure Market (2026-2032)
- Vietnam Airport Wireless Infrastructure Market (2026-2032)
- Thailand Airport Wireless Infrastructure Market (2026-2032)
- South Korea Airport Wireless Infrastructure Market (2026-2032)
- Romania Airport Wireless Infrastructure Market (2026-2032)
- Qatar Airport Wireless Infrastructure Market (2026-2032)
- Philippines Airport Wireless Infrastructure Market (2026-2032)
- Japan Airport Wireless Infrastructure Market (2026-2032)
- Taiwan Airport Winter Services Market (2026-2032)
- Vietnam Airport Winter Services Market (2026-2032)
Industry Events and Analyst Meet

HIMTEX 2026

India Refining Summit 2026

India EV Show 2026

EV tech India Expo 2026

Auto Tech Asia 2026
Whitepaper
- Middle East & Africa Commercial Security Market Click here to view more.
- Middle East & Africa Fire Safety Systems & Equipment Market Click here to view more.
- GCC Drone Market Click here to view more.
- Middle East Lighting Fixture Market Click here to view more.
- GCC Physical & Perimeter Security Market Click here to view more.