Philippines Non-Chocolate Candy Market (2025-2031) | Analysis, Value, Share, Growth, Outlook, Size & Revenue, Segmentation, Trends, Forecast, Industry, Competitive Landscape, Companies
Market Forecast By Type (Hard type, Chewing type, Scotch type), By Distribution channel (Supermarkets/Hypermarkets, Specialist Stores, Convenience Stores, Online Stores, Others) And Competitive Landscape
| Product Code: ETC8846794 | Publication Date: Sep 2024 | Updated Date: Nov 2025 | Product Type: Market Research Report | |
| Publisher: 6Wresearch | Author: Shubham Deep | No. of Pages: 75 | No. of Figures: 35 | No. of Tables: 20 |
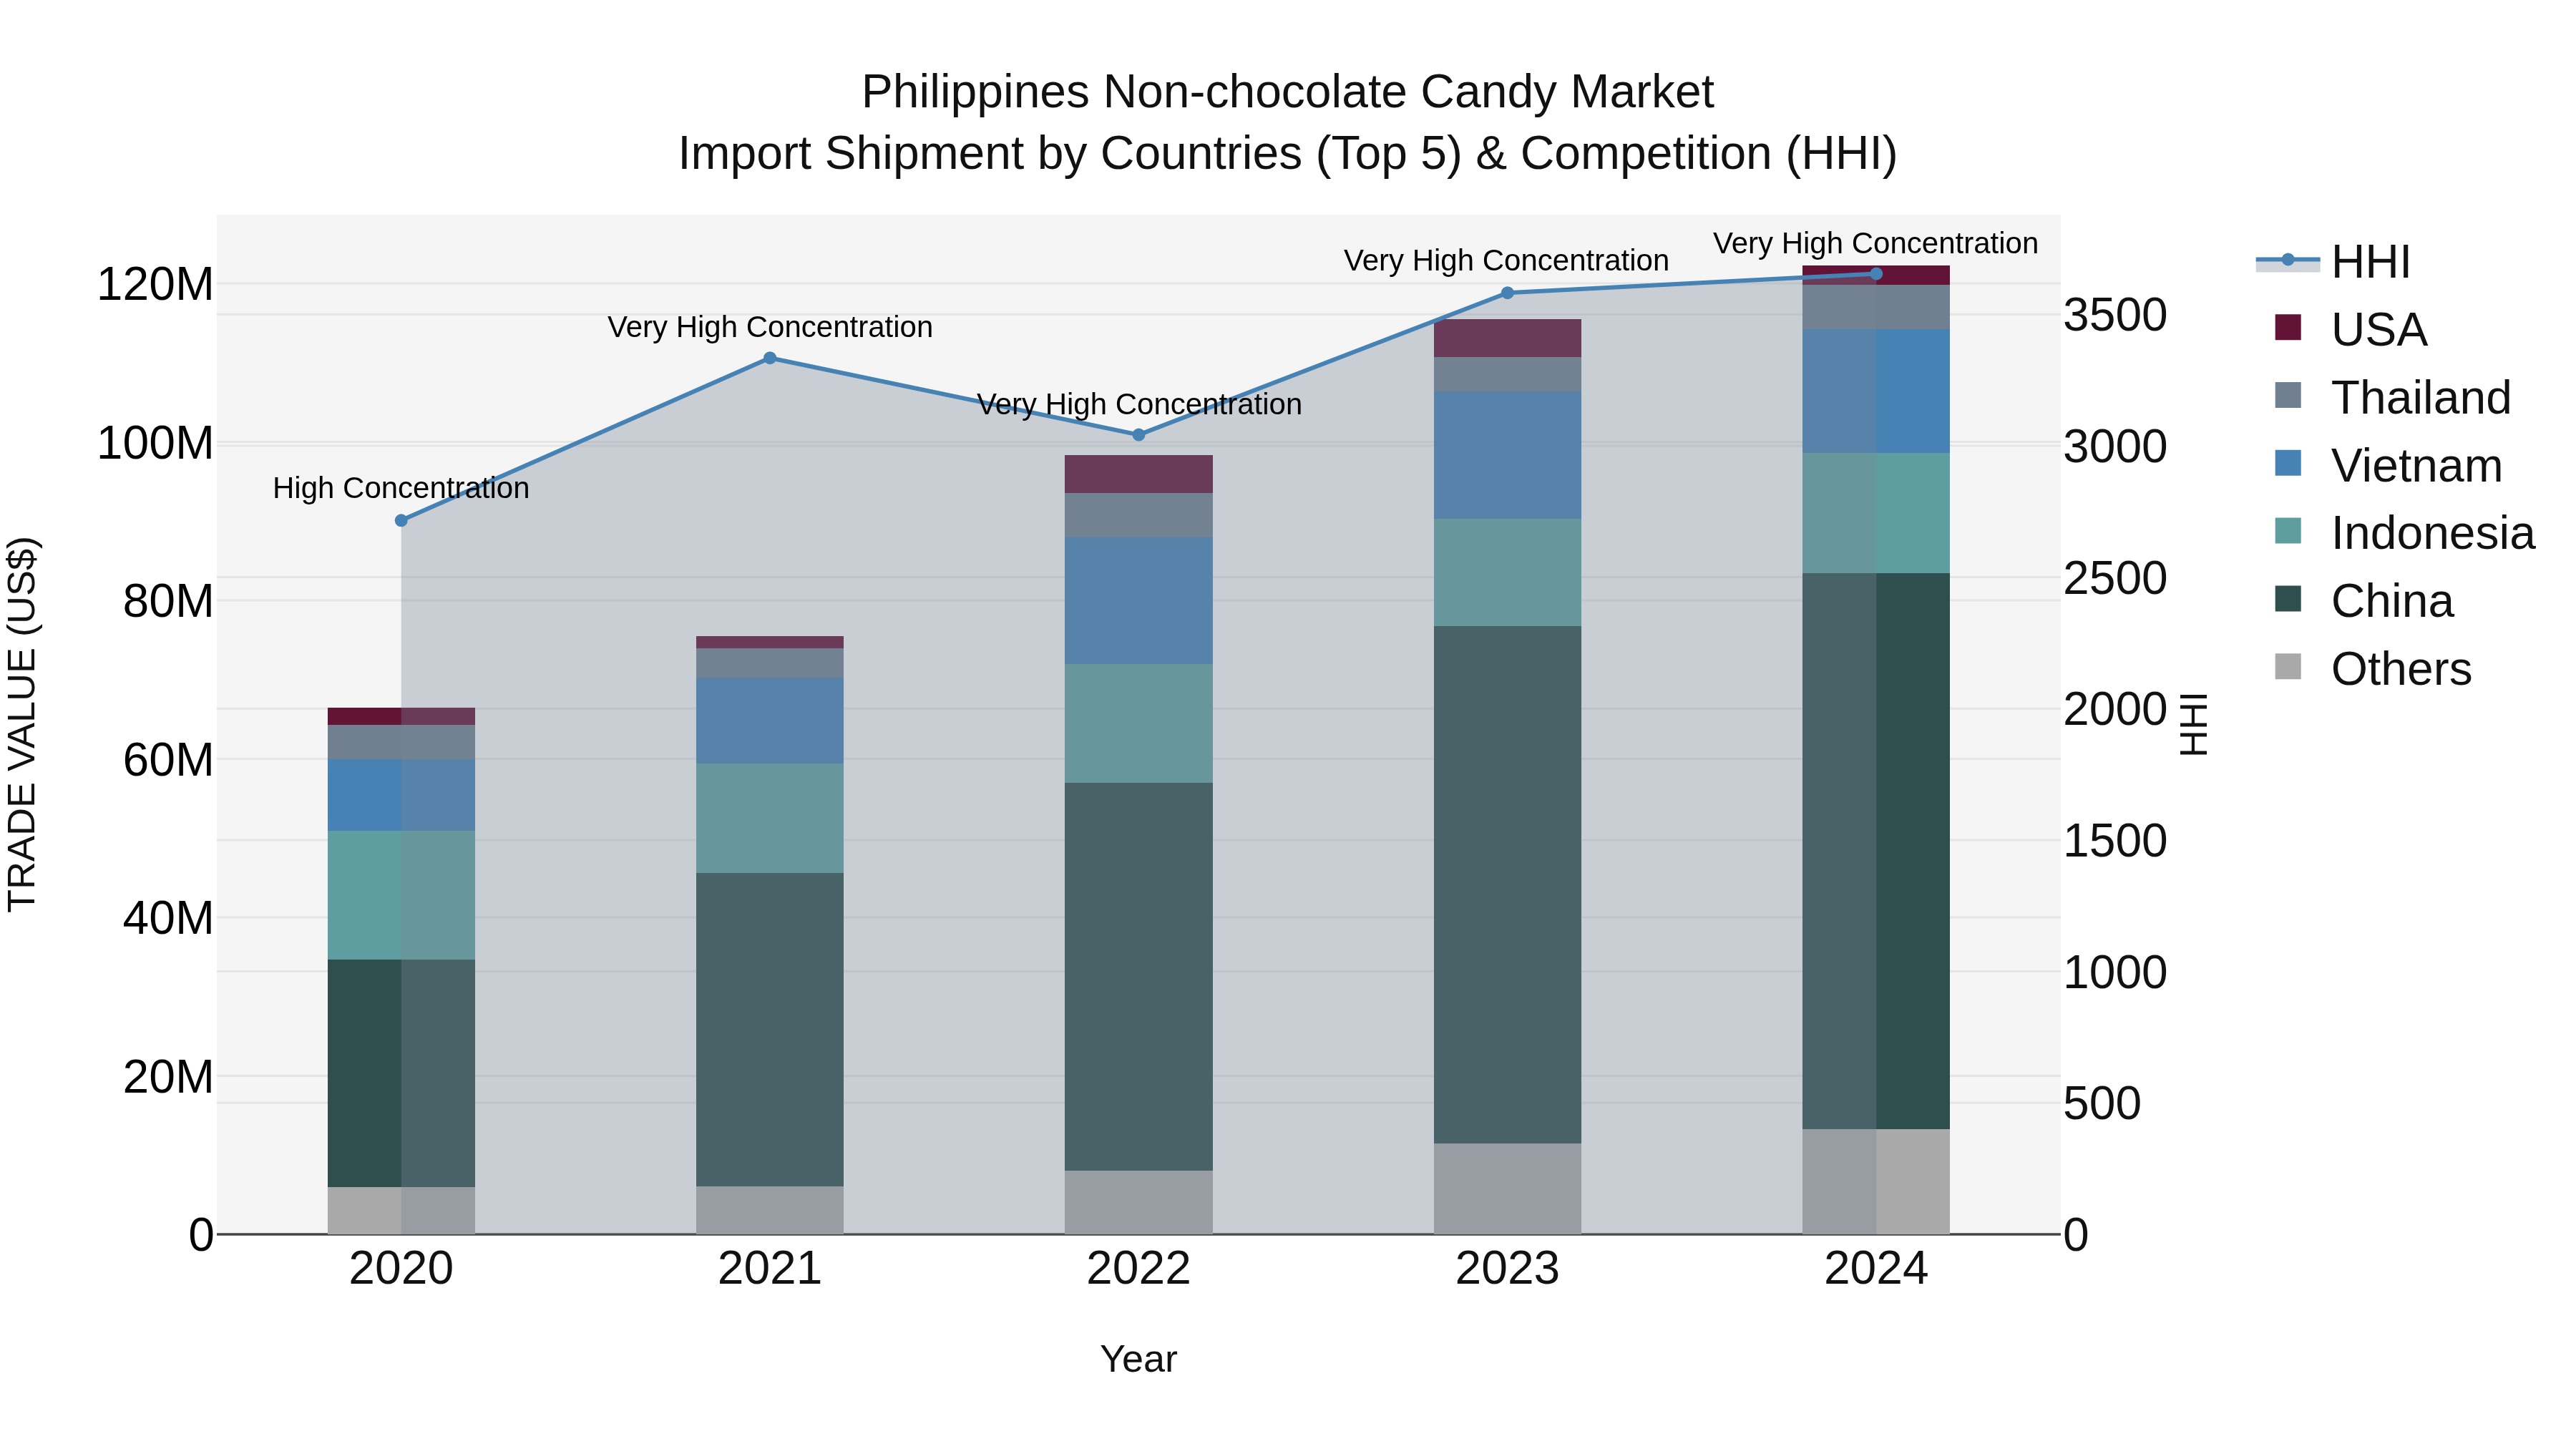
Philippines Non Chocolate Candy Market Top 5 Importing Countries and Market Competition (HHI) Analysis
The Philippines continues to see a steady increase in non-chocolate candy import shipments, with key exporters such as China, Vietnam, Indonesia, Thailand, and India dominating the market in 2024. The high Herfindahl-Hirschman Index (HHI) indicates a concentrated market, suggesting strong competition among these top exporting countries. The impressive compound annual growth rate (CAGR) of 16.46% from 2020 to 2024 highlights the growing demand for non-chocolate candies in the Philippines. Additionally, the growth rate of 5.87% from 2023 to 2024 indicates sustained momentum in the market, offering promising opportunities for both local retailers and international suppliers.
Philippines Non-Chocolate Candy Market Overview
The Philippines non-chocolate candy market is expanding with a variety of confectionery options gaining popularity, particularly fruit-flavored candies, gummies, hard candies, and marshmallows. With a young and dynamic population, the demand for affordable and easily accessible snacks is increasing. Additionally, the trend for healthier options in the candy sector, including sugar-free or natural ingredient-based alternatives, is gradually gaining traction. The convenience of smaller-sized packages and the continuous introduction of new flavors and textures by local and international brands are also boosting market growth.
Drivers of the market
The non-chocolate candy market in the Philippines thrives due to the strong demand for sugar-based confectioneries and the growing popularity of sweet snacks. Traditional Filipino sweets and candies, such as gummies and hard candies, continue to be a staple in the country`s snack culture. The increasing urbanization, along with changing lifestyles, contributes to a rise in impulse purchases of candy, particularly among young adults and children. Additionally, festive seasons and celebrations further stimulate the demand for non-chocolate candies as a treat for gatherings and gifts.
Challenges of the market
The non-chocolate candy market in the Philippines struggles with fluctuating raw material prices, including sugar and flavoring agents, which directly impact production costs. Moreover, increasing health awareness among consumers has led to a decline in the consumption of sugary treats, with many opting for healthier snack alternatives. Regulatory measures aimed at reducing sugar consumption, such as sugar taxes, further challenge market growth. Additionally, competition from both domestic and imported brands intensifies market saturation.
Investment opportunities in the Market
The Philippines non-chocolate candy market offers investment potential in the development of innovative, health-conscious confectionery products. There is increasing demand for sugar-free, organic, and natural-ingredient-based candies, providing opportunities for businesses focusing on healthier alternatives. Investing in automated production lines to increase efficiency and reduce costs can enhance profitability. Additionally, expanding e-commerce distribution channels and leveraging digital marketing strategies to reach a broader customer base can be a lucrative approach. Partnerships with local retailers and convenience stores also provide a direct route to market expansion.
Government Policy of the market
The Philippines non-chocolate candy market is subject to food safety regulations under the FDA, ensuring compliance with labeling, ingredient restrictions, and consumer health standards. The government has also imposed stricter sugar taxation under the SSB Tax, influencing manufacturers to explore healthier, sugar-free alternatives. Import policies and tariffs on raw materials such as gelatin and artificial sweeteners affect production costs. The governments push for eco-friendly packaging through the Extended Producer Responsibility (EPR) Act also impacts candy manufacturers, requiring them to adopt sustainable packaging practices.
Key Highlights of the Report:
- Philippines Non-Chocolate Candy Market Outlook
- Market Size of Philippines Non-Chocolate Candy Market, 2024
- Forecast of Philippines Non-Chocolate Candy Market, 2031
- Historical Data and Forecast of Philippines Non-Chocolate Candy Revenues & Volume for the Period 2021- 2031
- Philippines Non-Chocolate Candy Market Trend Evolution
- Philippines Non-Chocolate Candy Market Drivers and Challenges
- Philippines Non-Chocolate Candy Price Trends
- Philippines Non-Chocolate Candy Porter's Five Forces
- Philippines Non-Chocolate Candy Industry Life Cycle
- Historical Data and Forecast of Philippines Non-Chocolate Candy Market Revenues & Volume By Type for the Period 2021- 2031
- Historical Data and Forecast of Philippines Non-Chocolate Candy Market Revenues & Volume By Hard type for the Period 2021- 2031
- Historical Data and Forecast of Philippines Non-Chocolate Candy Market Revenues & Volume By Chewing type for the Period 2021- 2031
- Historical Data and Forecast of Philippines Non-Chocolate Candy Market Revenues & Volume By Scotch type for the Period 2021- 2031
- Historical Data and Forecast of Philippines Non-Chocolate Candy Market Revenues & Volume By Distribution channel for the Period 2021- 2031
- Historical Data and Forecast of Philippines Non-Chocolate Candy Market Revenues & Volume By Supermarkets/Hypermarkets for the Period 2021- 2031
- Historical Data and Forecast of Philippines Non-Chocolate Candy Market Revenues & Volume By Specialist Stores for the Period 2021- 2031
- Historical Data and Forecast of Philippines Non-Chocolate Candy Market Revenues & Volume By Convenience Stores for the Period 2021- 2031
- Historical Data and Forecast of Philippines Non-Chocolate Candy Market Revenues & Volume By Online Stores for the Period 2021- 2031
- Historical Data and Forecast of Philippines Non-Chocolate Candy Market Revenues & Volume By Others for the Period 2021- 2031
- Philippines Non-Chocolate Candy Import Export Trade Statistics
- Market Opportunity Assessment By Type
- Market Opportunity Assessment By Distribution channel
- Philippines Non-Chocolate Candy Top Companies Market Share
- Philippines Non-Chocolate Candy Competitive Benchmarking By Technical and Operational Parameters
- Philippines Non-Chocolate Candy Company Profiles
- Philippines Non-Chocolate Candy Key Strategic Recommendations
Frequently Asked Questions About the Market Study (FAQs):
6Wresearch actively monitors the Philippines Non-Chocolate Candy Market and publishes its comprehensive annual report, highlighting emerging trends, growth drivers, revenue analysis, and forecast outlook. Our insights help businesses to make data-backed strategic decisions with ongoing market dynamics. Our analysts track relevent industries related to the Philippines Non-Chocolate Candy Market, allowing our clients with actionable intelligence and reliable forecasts tailored to emerging regional needs.
Yes, we provide customisation as per your requirements. To learn more, feel free to contact us on sales@6wresearch.com
1 Executive Summary |
2 Introduction |
2.1 Key Highlights of the Report |
2.2 Report Description |
2.3 Market Scope & Segmentation |
2.4 Research Methodology |
2.5 Assumptions |
3 Philippines Non-Chocolate Candy Market Overview |
3.1 Philippines Country Macro Economic Indicators |
3.2 Philippines Non-Chocolate Candy Market Revenues & Volume, 2021 & 2031F |
3.3 Philippines Non-Chocolate Candy Market - Industry Life Cycle |
3.4 Philippines Non-Chocolate Candy Market - Porter's Five Forces |
3.5 Philippines Non-Chocolate Candy Market Revenues & Volume Share, By Type, 2021 & 2031F |
3.6 Philippines Non-Chocolate Candy Market Revenues & Volume Share, By Distribution channel, 2021 & 2031F |
4 Philippines Non-Chocolate Candy Market Dynamics |
4.1 Impact Analysis |
4.2 Market Drivers |
4.2.1 Increasing disposable income of the population in the Philippines |
4.2.2 Growing trend towards gifting non-chocolate candies for special occasions |
4.2.3 Rising demand for innovative and exotic flavors in non-chocolate candies |
4.3 Market Restraints |
4.3.1 Health concerns related to excessive sugar consumption |
4.3.2 Competition from healthier snack alternatives |
4.3.3 Fluctuating prices of raw materials such as sugar and flavorings |
5 Philippines Non-Chocolate Candy Market Trends |
6 Philippines Non-Chocolate Candy Market, By Types |
6.1 Philippines Non-Chocolate Candy Market, By Type |
6.1.1 Overview and Analysis |
6.1.2 Philippines Non-Chocolate Candy Market Revenues & Volume, By Type, 2021- 2031F |
6.1.3 Philippines Non-Chocolate Candy Market Revenues & Volume, By Hard type, 2021- 2031F |
6.1.4 Philippines Non-Chocolate Candy Market Revenues & Volume, By Chewing type, 2021- 2031F |
6.1.5 Philippines Non-Chocolate Candy Market Revenues & Volume, By Scotch type, 2021- 2031F |
6.2 Philippines Non-Chocolate Candy Market, By Distribution channel |
6.2.1 Overview and Analysis |
6.2.2 Philippines Non-Chocolate Candy Market Revenues & Volume, By Supermarkets/Hypermarkets, 2021- 2031F |
6.2.3 Philippines Non-Chocolate Candy Market Revenues & Volume, By Specialist Stores, 2021- 2031F |
6.2.4 Philippines Non-Chocolate Candy Market Revenues & Volume, By Convenience Stores, 2021- 2031F |
6.2.5 Philippines Non-Chocolate Candy Market Revenues & Volume, By Online Stores, 2021- 2031F |
6.2.6 Philippines Non-Chocolate Candy Market Revenues & Volume, By Others, 2021- 2031F |
7 Philippines Non-Chocolate Candy Market Import-Export Trade Statistics |
7.1 Philippines Non-Chocolate Candy Market Export to Major Countries |
7.2 Philippines Non-Chocolate Candy Market Imports from Major Countries |
8 Philippines Non-Chocolate Candy Market Key Performance Indicators |
8.1 Consumer engagement on social media platforms for non-chocolate candies |
8.2 Number of new product launches and flavor variations in the market |
8.3 Customer satisfaction scores for non-chocolate candy brands |
9 Philippines Non-Chocolate Candy Market - Opportunity Assessment |
9.1 Philippines Non-Chocolate Candy Market Opportunity Assessment, By Type, 2021 & 2031F |
9.2 Philippines Non-Chocolate Candy Market Opportunity Assessment, By Distribution channel, 2021 & 2031F |
10 Philippines Non-Chocolate Candy Market - Competitive Landscape |
10.1 Philippines Non-Chocolate Candy Market Revenue Share, By Companies, 2024 |
10.2 Philippines Non-Chocolate Candy Market Competitive Benchmarking, By Operating and Technical Parameters |
11 Company Profiles |
12 Recommendations |
13 Disclaimer |
Global Go To Market Strategy - 2030
Export potential enables firms to identify high-growth global markets with greater confidence by combining advanced trade intelligence with a structured quantitative methodology. The framework analyzes emerging demand trends and country-level import patterns while integrating macroeconomic and trade datasets such as GDP and population forecasts, bilateral import–export flows, tariff structures, elasticity differentials between developed and developing economies, geographic distance, and import demand projections. Using weighted trade values from 2020–2024 as the base period to project country-to-country export potential for 2030, these inputs are operationalized through calculated drivers such as gravity model parameters, tariff impact factors, and projected GDP per-capita growth. Through an analysis of hidden potentials, demand hotspots, and market conditions that are most favorable to success, this method enables firms to focus on target countries, maximize returns, and global expansion with data, backed by accuracy.
By factoring in the projected importer demand gap that is currently unmet and could be potential opportunity, it identifies the potential for the Exporter (Country) among 190 countries, against the general trade analysis, which identifies the biggest importer or exporter.
To discover high-growth global markets and optimize your business strategy:
Click Here
Pricing
- Single User License$ 1,995
- Department License$ 2,400
- Site License$ 3,120
- Global License$ 3,795

Leadership Perspectives from Industry Events
Search
Thought Leadership and Analyst Meet


Our Clients
6WResearch In News
- Doha a strategic location for EV manufacturing hub: IPA Qatar
- Demand for luxury TVs surging in the GCC, says Samsung
- Empowering Growth: The Thriving Journey of Bangladesh’s Cable Industry
- Demand for luxury TVs surging in the GCC, says Samsung
- Video call with a traditional healer? Once unthinkable, it’s now common in South Africa
- Intelligent Buildings To Smooth GCC’s Path To Net Zero
Latest Reports
- Taiwan Airport Wireless Infrastructure Market (2026-2032)
- Vietnam Airport Wireless Infrastructure Market (2026-2032)
- Thailand Airport Wireless Infrastructure Market (2026-2032)
- South Korea Airport Wireless Infrastructure Market (2026-2032)
- Romania Airport Wireless Infrastructure Market (2026-2032)
- Qatar Airport Wireless Infrastructure Market (2026-2032)
- Philippines Airport Wireless Infrastructure Market (2026-2032)
- Japan Airport Wireless Infrastructure Market (2026-2032)
- Taiwan Airport Winter Services Market (2026-2032)
- Vietnam Airport Winter Services Market (2026-2032)
Industry Events and Analyst Meet

HIMTEX 2026

India Refining Summit 2026

India EV Show 2026

EV tech India Expo 2026

Auto Tech Asia 2026
Whitepaper
- Middle East & Africa Commercial Security Market Click here to view more.
- Middle East & Africa Fire Safety Systems & Equipment Market Click here to view more.
- GCC Drone Market Click here to view more.
- Middle East Lighting Fixture Market Click here to view more.
- GCC Physical & Perimeter Security Market Click here to view more.