Philippines Non-Dairy Beverages Market (2025-2031) | Segmentation, Outlook, Competitive Landscape, Share, Industry, Size & Revenue, Trends, Companies, Value, Forecast, Growth, Analysis
Market Forecast By Source (Fruits, Vegetables, Cereals, Other), By Type (Dairy Free Drinkable Yogurts, Fermented Soft Drinks, Fermented Juices, Non-Dairy Kefir), By Distribution Channel (Online Retail, Supermarket/Hypermarket, Specialty Stores, Departmental Stores, Others) And Competitive Landscape
| Product Code: ETC8846799 | Publication Date: Sep 2024 | Updated Date: Nov 2025 | Product Type: Market Research Report | |
| Publisher: 6Wresearch | Author: Shubham Deep | No. of Pages: 75 | No. of Figures: 35 | No. of Tables: 20 |
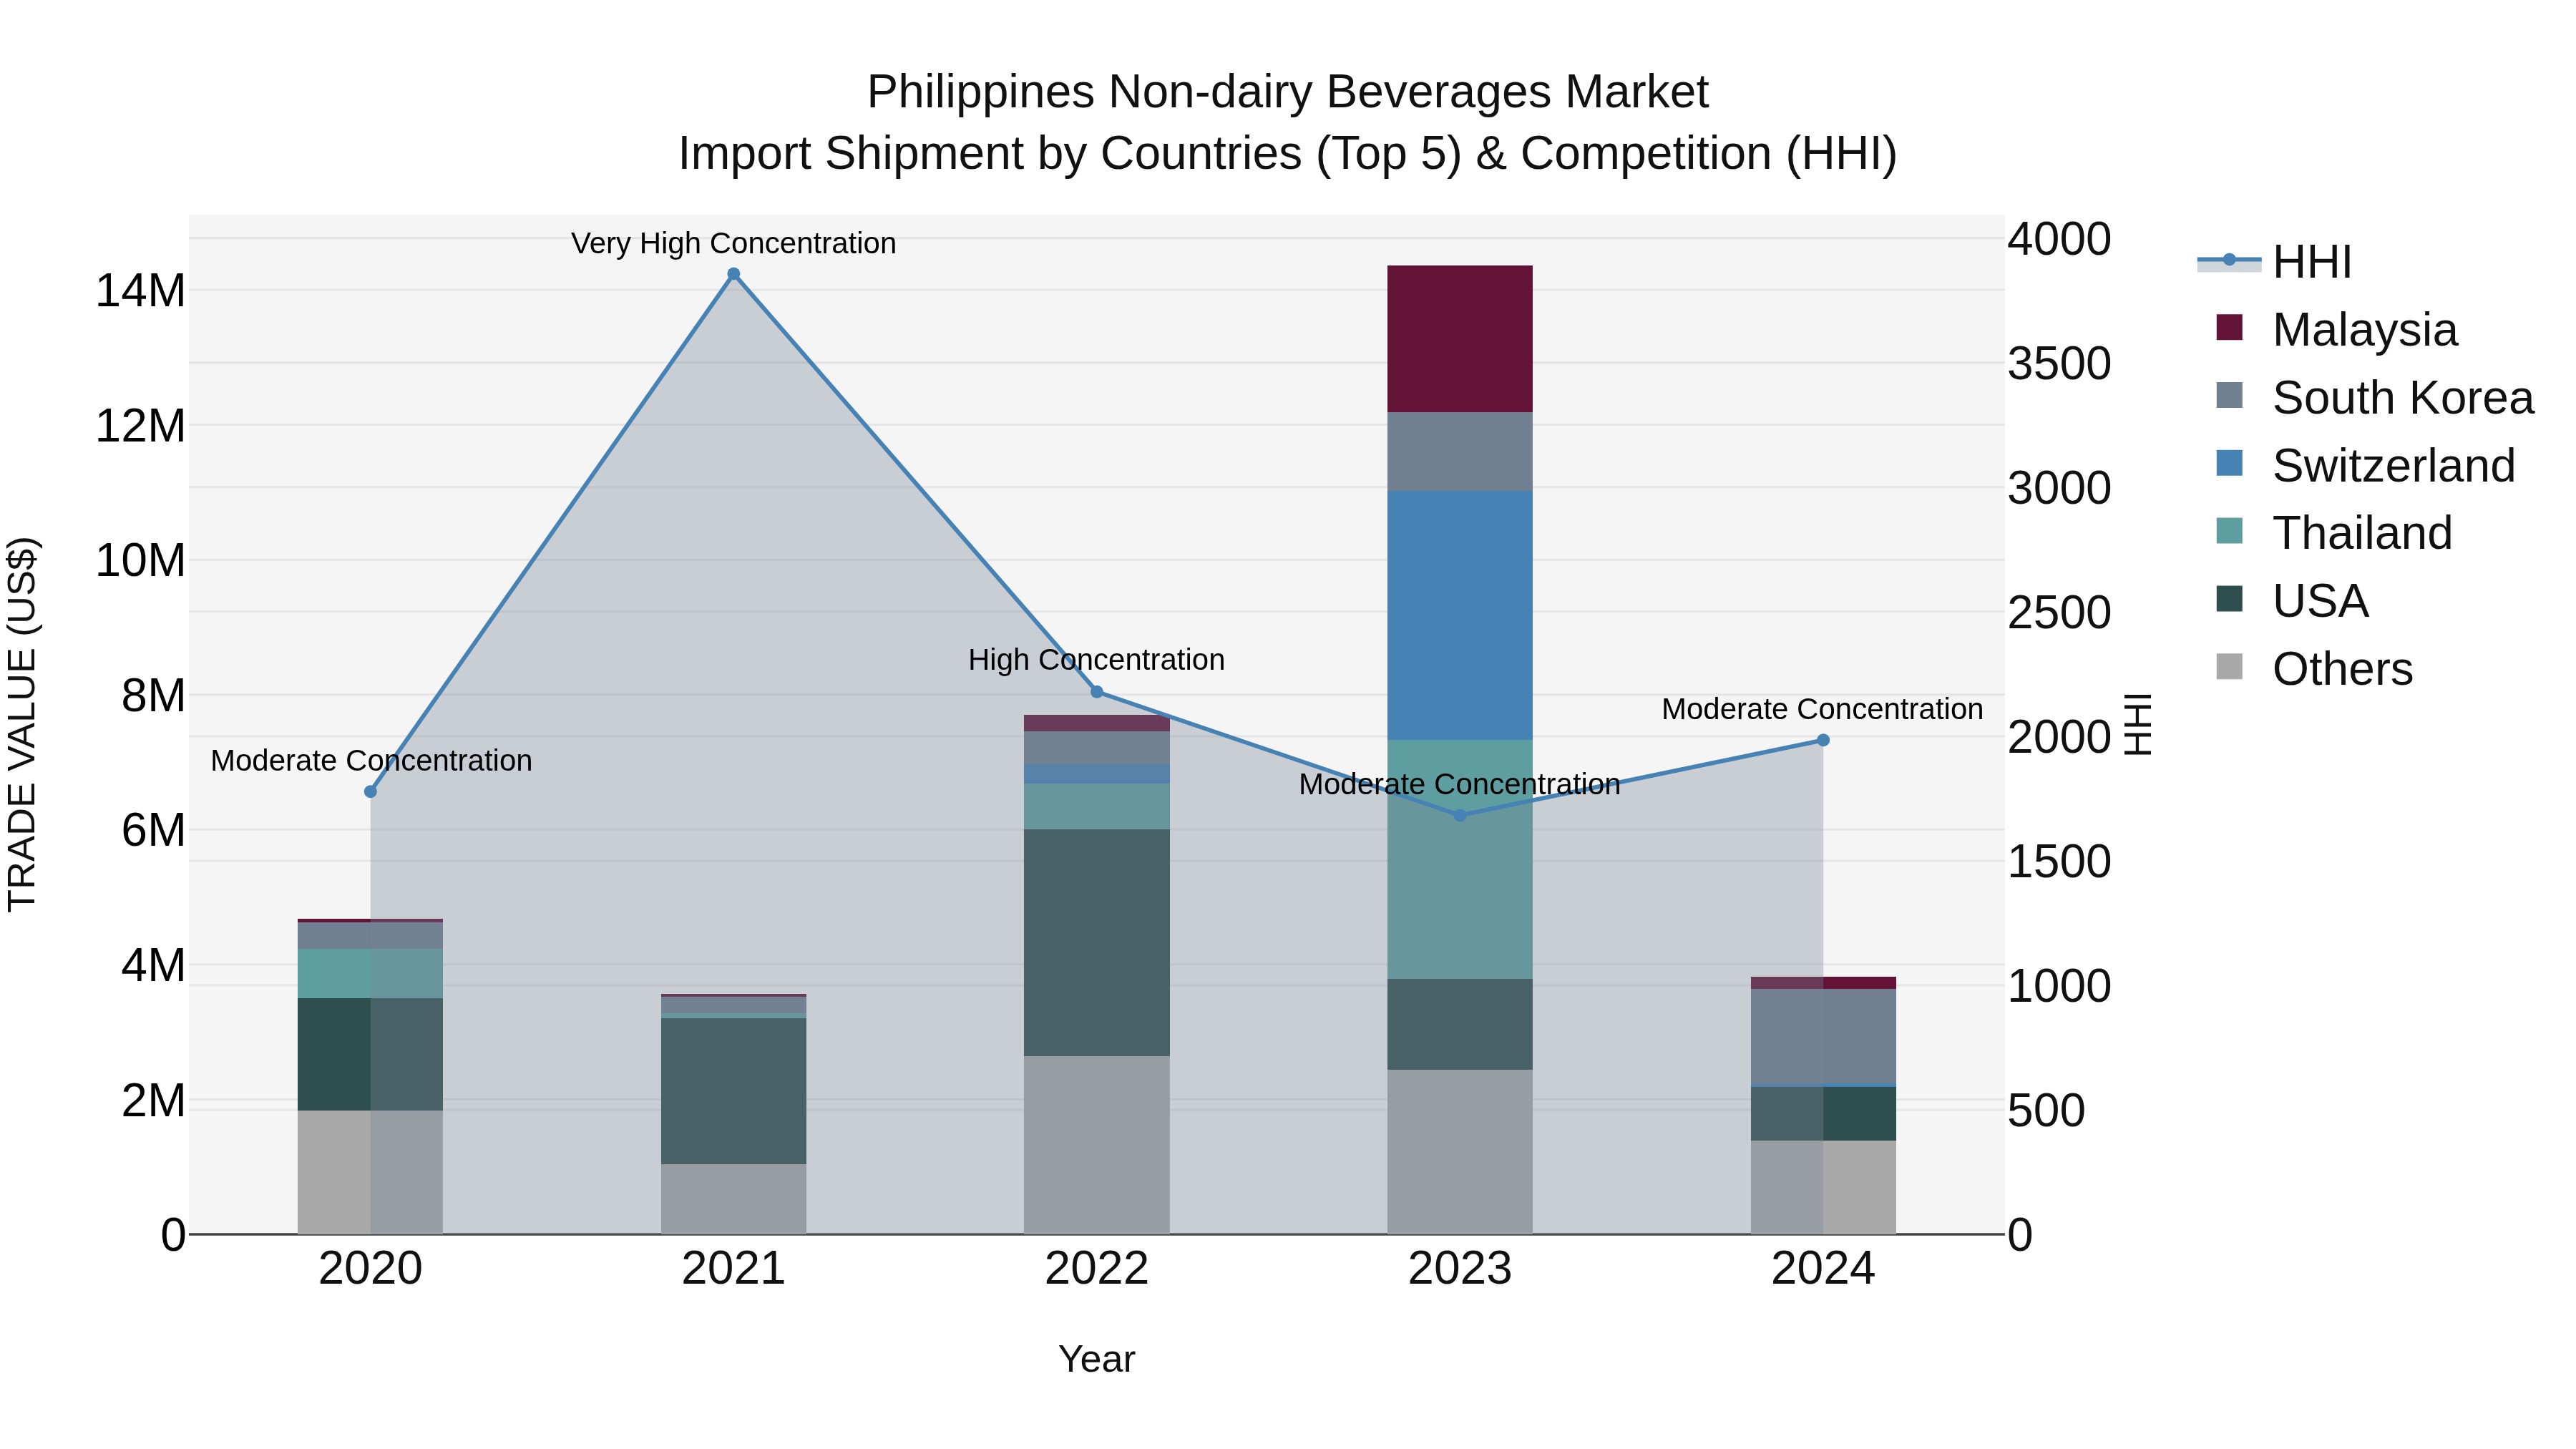
Philippines Non Dairy Beverages Market Top 5 Importing Countries and Market Competition (HHI) Analysis
In 2024, the Philippines saw a notable decline in non-dairy beverage imports, with a CAGR of -4.91% from 2020-24. Top exporting countries like South Korea, USA, UK, Metropolitan France, and Spain continued to supply the market. Despite a significant drop in growth rate by -73.38% from 2023-24, the market maintained moderate concentration levels based on the Herfindahl-Hirschman Index (HHI). This data suggests a challenging landscape for non-dairy beverage imports in the Philippines, possibly influenced by changing consumer preferences or market dynamics.
Philippines Non-Dairy Beverages Market Overview
The non-dairy beverages market in the Philippines has experienced significant growth due to the increasing preference for plant-based alternatives. Non-dairy beverages such as almond milk, oat milk, soy milk, and rice milk have become popular due to their lactose-free nature, offering a solution for lactose-intolerant consumers or those seeking vegan or dairy-free alternatives. This market has been driven by health-conscious consumers, the rise of veganism, and the trend of avoiding dairy due to health or ethical reasons.
Drivers of the market
The non-dairy beverages market in the Philippines is driven by a rising consumer preference for plant-based drinks, particularly among health-conscious individuals and those with lactose intolerance. The growing awareness about the health benefits of plant-based diets, including reduced cholesterol levels and better digestion, fuels the demand for non-dairy beverages. Innovations in flavors, variety, and availability of alternative milk options such as soy, almond, and oat milk are further propelling this market. Additionally, the increasing vegan and vegetarian population in the country supports market growth.
Challenges of the market
The non-dairy beverages market in the Philippines encounters challenges related to high production costs and limited local sourcing of raw materials like almonds, oats, and soy. Imported ingredients drive up prices, making non-dairy beverages less accessible to price-sensitive consumers. Additionally, many Filipinos are still accustomed to traditional dairy products, making it difficult for plant-based alternatives to gain widespread acceptance. Misconceptions about the nutritional value of non-dairy options further slow market growth.
Investment opportunities in the Market
The Philippines non-dairy beverages market offers a promising landscape for investment due to the growing demand for plant-based milk alternatives. Investors can tap into opportunities in manufacturing and distribution of soy, almond, oat, and coconut milk-based beverages. Establishing supply chains for locally sourced ingredients and launching private-label brands in retail and e-commerce channels can drive growth. Additionally, partnerships with food service providers and cafes offering non-dairy beverage options can enhance market penetration.
Government Policy of the market
The Philippine government actively supports the growth of the non-dairy beverages market through health and wellness initiatives. The Food and Drug Administration (FDA) regulates product labeling and quality standards, ensuring safety and transparency for consumers. The Department of Trade and Industry (DTI) offers incentives to local manufacturers producing plant-based beverages, promoting domestic industry growth. Additionally, the government has implemented reduced import duties on plant-based ingredients, encouraging the production of non-dairy beverages in the country.
Key Highlights of the Report:
- Philippines Non-Dairy Beverages Market Outlook
- Market Size of Philippines Non-Dairy Beverages Market, 2024
- Forecast of Philippines Non-Dairy Beverages Market, 2031
- Historical Data and Forecast of Philippines Non-Dairy Beverages Revenues & Volume for the Period 2021- 2031
- Philippines Non-Dairy Beverages Market Trend Evolution
- Philippines Non-Dairy Beverages Market Drivers and Challenges
- Philippines Non-Dairy Beverages Price Trends
- Philippines Non-Dairy Beverages Porter's Five Forces
- Philippines Non-Dairy Beverages Industry Life Cycle
- Historical Data and Forecast of Philippines Non-Dairy Beverages Market Revenues & Volume By Source for the Period 2021- 2031
- Historical Data and Forecast of Philippines Non-Dairy Beverages Market Revenues & Volume By Fruits for the Period 2021- 2031
- Historical Data and Forecast of Philippines Non-Dairy Beverages Market Revenues & Volume By Vegetables for the Period 2021- 2031
- Historical Data and Forecast of Philippines Non-Dairy Beverages Market Revenues & Volume By Cereals for the Period 2021- 2031
- Historical Data and Forecast of Philippines Non-Dairy Beverages Market Revenues & Volume By Other for the Period 2021- 2031
- Historical Data and Forecast of Philippines Non-Dairy Beverages Market Revenues & Volume By Type for the Period 2021- 2031
- Historical Data and Forecast of Philippines Non-Dairy Beverages Market Revenues & Volume By Dairy Free Drinkable Yogurts for the Period 2021- 2031
- Historical Data and Forecast of Philippines Non-Dairy Beverages Market Revenues & Volume By Fermented Soft Drinks for the Period 2021- 2031
- Historical Data and Forecast of Philippines Non-Dairy Beverages Market Revenues & Volume By Fermented Juices for the Period 2021- 2031
- Historical Data and Forecast of Philippines Non-Dairy Beverages Market Revenues & Volume By Non-Dairy Kefir for the Period 2021- 2031
- Historical Data and Forecast of Philippines Non-Dairy Beverages Market Revenues & Volume By Distribution Channel for the Period 2021- 2031
- Historical Data and Forecast of Philippines Non-Dairy Beverages Market Revenues & Volume By Online Retail for the Period 2021- 2031
- Historical Data and Forecast of Philippines Non-Dairy Beverages Market Revenues & Volume By Supermarket/Hypermarket for the Period 2021- 2031
- Historical Data and Forecast of Philippines Non-Dairy Beverages Market Revenues & Volume By Specialty Stores for the Period 2021- 2031
- Historical Data and Forecast of Philippines Non-Dairy Beverages Market Revenues & Volume By Departmental Stores for the Period 2021- 2031
- Historical Data and Forecast of Philippines Non-Dairy Beverages Market Revenues & Volume By Others for the Period 2021- 2031
- Philippines Non-Dairy Beverages Import Export Trade Statistics
- Market Opportunity Assessment By Source
- Market Opportunity Assessment By Type
- Market Opportunity Assessment By Distribution Channel
- Philippines Non-Dairy Beverages Top Companies Market Share
- Philippines Non-Dairy Beverages Competitive Benchmarking By Technical and Operational Parameters
- Philippines Non-Dairy Beverages Company Profiles
- Philippines Non-Dairy Beverages Key Strategic Recommendations
Frequently Asked Questions About the Market Study (FAQs):
6Wresearch actively monitors the Philippines Non-Dairy Beverages Market and publishes its comprehensive annual report, highlighting emerging trends, growth drivers, revenue analysis, and forecast outlook. Our insights help businesses to make data-backed strategic decisions with ongoing market dynamics. Our analysts track relevent industries related to the Philippines Non-Dairy Beverages Market, allowing our clients with actionable intelligence and reliable forecasts tailored to emerging regional needs.
Yes, we provide customisation as per your requirements. To learn more, feel free to contact us on sales@6wresearch.com
1 Executive Summary |
2 Introduction |
2.1 Key Highlights of the Report |
2.2 Report Description |
2.3 Market Scope & Segmentation |
2.4 Research Methodology |
2.5 Assumptions |
3 Philippines Non-Dairy Beverages Market Overview |
3.1 Philippines Country Macro Economic Indicators |
3.2 Philippines Non-Dairy Beverages Market Revenues & Volume, 2021 & 2031F |
3.3 Philippines Non-Dairy Beverages Market - Industry Life Cycle |
3.4 Philippines Non-Dairy Beverages Market - Porter's Five Forces |
3.5 Philippines Non-Dairy Beverages Market Revenues & Volume Share, By Source, 2021 & 2031F |
3.6 Philippines Non-Dairy Beverages Market Revenues & Volume Share, By Type, 2021 & 2031F |
3.7 Philippines Non-Dairy Beverages Market Revenues & Volume Share, By Distribution Channel, 2021 & 2031F |
4 Philippines Non-Dairy Beverages Market Dynamics |
4.1 Impact Analysis |
4.2 Market Drivers |
4.2.1 Increasing health awareness and dietary preferences favoring non-dairy beverages |
4.2.2 Growing demand for plant-based alternatives due to lactose intolerance and vegan diets |
4.2.3 Rising disposable income and changing consumer lifestyles driving the demand for healthier beverage options |
4.3 Market Restraints |
4.3.1 Price sensitivity of consumers towards premium non-dairy beverages |
4.3.2 Limited distribution channels hindering market penetration |
4.3.3 Lack of awareness and education regarding the benefits of non-dairy beverages |
5 Philippines Non-Dairy Beverages Market Trends |
6 Philippines Non-Dairy Beverages Market, By Types |
6.1 Philippines Non-Dairy Beverages Market, By Source |
6.1.1 Overview and Analysis |
6.1.2 Philippines Non-Dairy Beverages Market Revenues & Volume, By Source, 2021- 2031F |
6.1.3 Philippines Non-Dairy Beverages Market Revenues & Volume, By Fruits, 2021- 2031F |
6.1.4 Philippines Non-Dairy Beverages Market Revenues & Volume, By Vegetables, 2021- 2031F |
6.1.5 Philippines Non-Dairy Beverages Market Revenues & Volume, By Cereals, 2021- 2031F |
6.1.6 Philippines Non-Dairy Beverages Market Revenues & Volume, By Other, 2021- 2031F |
6.2 Philippines Non-Dairy Beverages Market, By Type |
6.2.1 Overview and Analysis |
6.2.2 Philippines Non-Dairy Beverages Market Revenues & Volume, By Dairy Free Drinkable Yogurts, 2021- 2031F |
6.2.3 Philippines Non-Dairy Beverages Market Revenues & Volume, By Fermented Soft Drinks, 2021- 2031F |
6.2.4 Philippines Non-Dairy Beverages Market Revenues & Volume, By Fermented Juices, 2021- 2031F |
6.2.5 Philippines Non-Dairy Beverages Market Revenues & Volume, By Non-Dairy Kefir, 2021- 2031F |
6.3 Philippines Non-Dairy Beverages Market, By Distribution Channel |
6.3.1 Overview and Analysis |
6.3.2 Philippines Non-Dairy Beverages Market Revenues & Volume, By Online Retail, 2021- 2031F |
6.3.3 Philippines Non-Dairy Beverages Market Revenues & Volume, By Supermarket/Hypermarket, 2021- 2031F |
6.3.4 Philippines Non-Dairy Beverages Market Revenues & Volume, By Specialty Stores, 2021- 2031F |
6.3.5 Philippines Non-Dairy Beverages Market Revenues & Volume, By Departmental Stores, 2021- 2031F |
6.3.6 Philippines Non-Dairy Beverages Market Revenues & Volume, By Others, 2021- 2031F |
7 Philippines Non-Dairy Beverages Market Import-Export Trade Statistics |
7.1 Philippines Non-Dairy Beverages Market Export to Major Countries |
7.2 Philippines Non-Dairy Beverages Market Imports from Major Countries |
8 Philippines Non-Dairy Beverages Market Key Performance Indicators |
8.1 Number of new product launches in the non-dairy beverages segment |
8.2 Percentage of consumers switching from dairy to non-dairy beverages |
8.3 Growth in the number of specialty stores offering a variety of non-dairy beverage options |
9 Philippines Non-Dairy Beverages Market - Opportunity Assessment |
9.1 Philippines Non-Dairy Beverages Market Opportunity Assessment, By Source, 2021 & 2031F |
9.2 Philippines Non-Dairy Beverages Market Opportunity Assessment, By Type, 2021 & 2031F |
9.3 Philippines Non-Dairy Beverages Market Opportunity Assessment, By Distribution Channel, 2021 & 2031F |
10 Philippines Non-Dairy Beverages Market - Competitive Landscape |
10.1 Philippines Non-Dairy Beverages Market Revenue Share, By Companies, 2024 |
10.2 Philippines Non-Dairy Beverages Market Competitive Benchmarking, By Operating and Technical Parameters |
11 Company Profiles |
12 Recommendations |
13 Disclaimer |
Export potential assessment - trade Analytics for 2030
Export potential enables firms to identify high-growth global markets with greater confidence by combining advanced trade intelligence with a structured quantitative methodology. The framework analyzes emerging demand trends and country-level import patterns while integrating macroeconomic and trade datasets such as GDP and population forecasts, bilateral import–export flows, tariff structures, elasticity differentials between developed and developing economies, geographic distance, and import demand projections. Using weighted trade values from 2020–2024 as the base period to project country-to-country export potential for 2030, these inputs are operationalized through calculated drivers such as gravity model parameters, tariff impact factors, and projected GDP per-capita growth. Through an analysis of hidden potentials, demand hotspots, and market conditions that are most favorable to success, this method enables firms to focus on target countries, maximize returns, and global expansion with data, backed by accuracy.
By factoring in the projected importer demand gap that is currently unmet and could be potential opportunity, it identifies the potential for the Exporter (Country) among 190 countries, against the general trade analysis, which identifies the biggest importer or exporter.
To discover high-growth global markets and optimize your business strategy:
Click Here
Pricing
- Single User License$ 1,995
- Department License$ 2,400
- Site License$ 3,120
- Global License$ 3,795

Search
Thought Leadership and Analyst Meet


Our Clients
Latest Reports
- Canada Cloud CFD Market (2026-2032) | Size & Revenue, Industry, Growth, Competitive Landscape, Forecast, Segmentation, Value, Outlook, Trends, Share, Analysis, Companies
- Taiwan Food Delivery Platform Market (2026-2032) | Companies, Outlook, Analysis, Trends, Value, Revenue, Segmentation, Share, Forecast, Competitive Landscape, Growth, Size & Forecast
- United Kingdom (UK) Long-term Care Insurance Market (2026-2032) | Growth, Share, Consumer Insights, Drivers, Opportunities, Competition, Pricing Analysis, Segments, Restraints, Companies, Competitive, Value, Outlook, Size, Demand, Analysis, Challenges, Strategic Insights, Investment Trends, Revenue, Trends, Supply, Forecast
- United Kingdom (UK) Long Term Care Market (2026-2032) | Companies, Outlook, Analysis, Trends, Value, Revenue, Segmentation, Share, Forecast, Competitive Landscape, Growth, Size & Forecast
- Iraq Insulation and Waterproofing Market (2026-2032) | Outlook, Drivers, Growth, Size, Share, Industry, Revenue, Trends, Demand, Competitive, Strategic Insights, Opportunities, Segments, Companies, Challenges, Strategy, Consumer Insights, Analysis, Investment Trends, Value, Segmentation, Forecast, Restraints
- India Switchgear Market Outlook (2026-2032) | Size, Share, Trends, Growth, Revenue, Forecast, Analysis, Value, Outlook
- Pakistan Contraceptive Implants Market (2025-2031) | Demand, Growth, Size, Share, Industry, Pricing Analysis, Competitive, Strategic Insights, Strategy, Consumer Insights, Analysis, Investment Trends, Opportunities, Revenue, Segments, Value, Segmentation, Supply, Forecast, Restraints, Outlook, Competition, Drivers, Trends, Companies, Challenges
- Sri Lanka Packaging Market (2026-2032) | Outlook, Competition, Drivers, Trends, Demand, Pricing Analysis, Competitive, Strategic Insights, Companies, Challenges, Strategy, Consumer Insights, Analysis, Investment Trends, Opportunities, Growth, Size, Share, Industry, Revenue, Segments, Value, Segmentation, Supply, Forecast, Restraints
- India Kids Watches Market (2026-2032) | Strategy, Consumer Insights, Analysis, Investment Trends, Opportunities, Growth, Size, Share, Industry, Revenue, Segments, Value, Segmentation, Supply, Forecast, Restraints, Outlook, Competition, Drivers, Trends, Demand, Pricing Analysis, Competitive, Strategic Insights, Companies, Challenges
- Saudi Arabia Core Assurance Service Market (2025-2031) | Strategy, Consumer Insights, Analysis, Investment Trends, Opportunities, Growth, Size, Share, Industry, Revenue, Segments, Value, Segmentation, Supply, Forecast, Restraints, Outlook, Competition, Drivers, Trends, Demand, Pricing Analysis, Competitive, Strategic Insights, Companies, Challenges
Industry Events and Analyst Meet

India EV Show 2026

EV tech India Expo 2026

Auto Tech Asia 2026

Battery Tech India 2026

Smart Production Solutions Guangzhou 2026
Whitepaper
- Middle East & Africa Commercial Security Market Click here to view more.
- Middle East & Africa Fire Safety Systems & Equipment Market Click here to view more.
- GCC Drone Market Click here to view more.
- Middle East Lighting Fixture Market Click here to view more.
- GCC Physical & Perimeter Security Market Click here to view more.
6WResearch In News
- Doha a strategic location for EV manufacturing hub: IPA Qatar
- Demand for luxury TVs surging in the GCC, says Samsung
- Empowering Growth: The Thriving Journey of Bangladesh’s Cable Industry
- Demand for luxury TVs surging in the GCC, says Samsung
- Video call with a traditional healer? Once unthinkable, it’s now common in South Africa
- Intelligent Buildings To Smooth GCC’s Path To Net Zero