Philippines Polyurethane (PU) Microspheres Market (2025-2031) Outlook | Forecast, Share, Value, Industry, Growth, Companies, Size, Analysis, Revenue & Trends
Market Forecast By Applications (Encapsulation, Paints & coatings, Adhesives films, Cosmetics, Other applications) And Competitive Landscape
| Product Code: ETC4512210 | Publication Date: Jul 2023 | Updated Date: Nov 2025 | Product Type: Report | |
| Publisher: 6Wresearch | Author: Ravi Bhandari | No. of Pages: 85 | No. of Figures: 45 | No. of Tables: 25 |
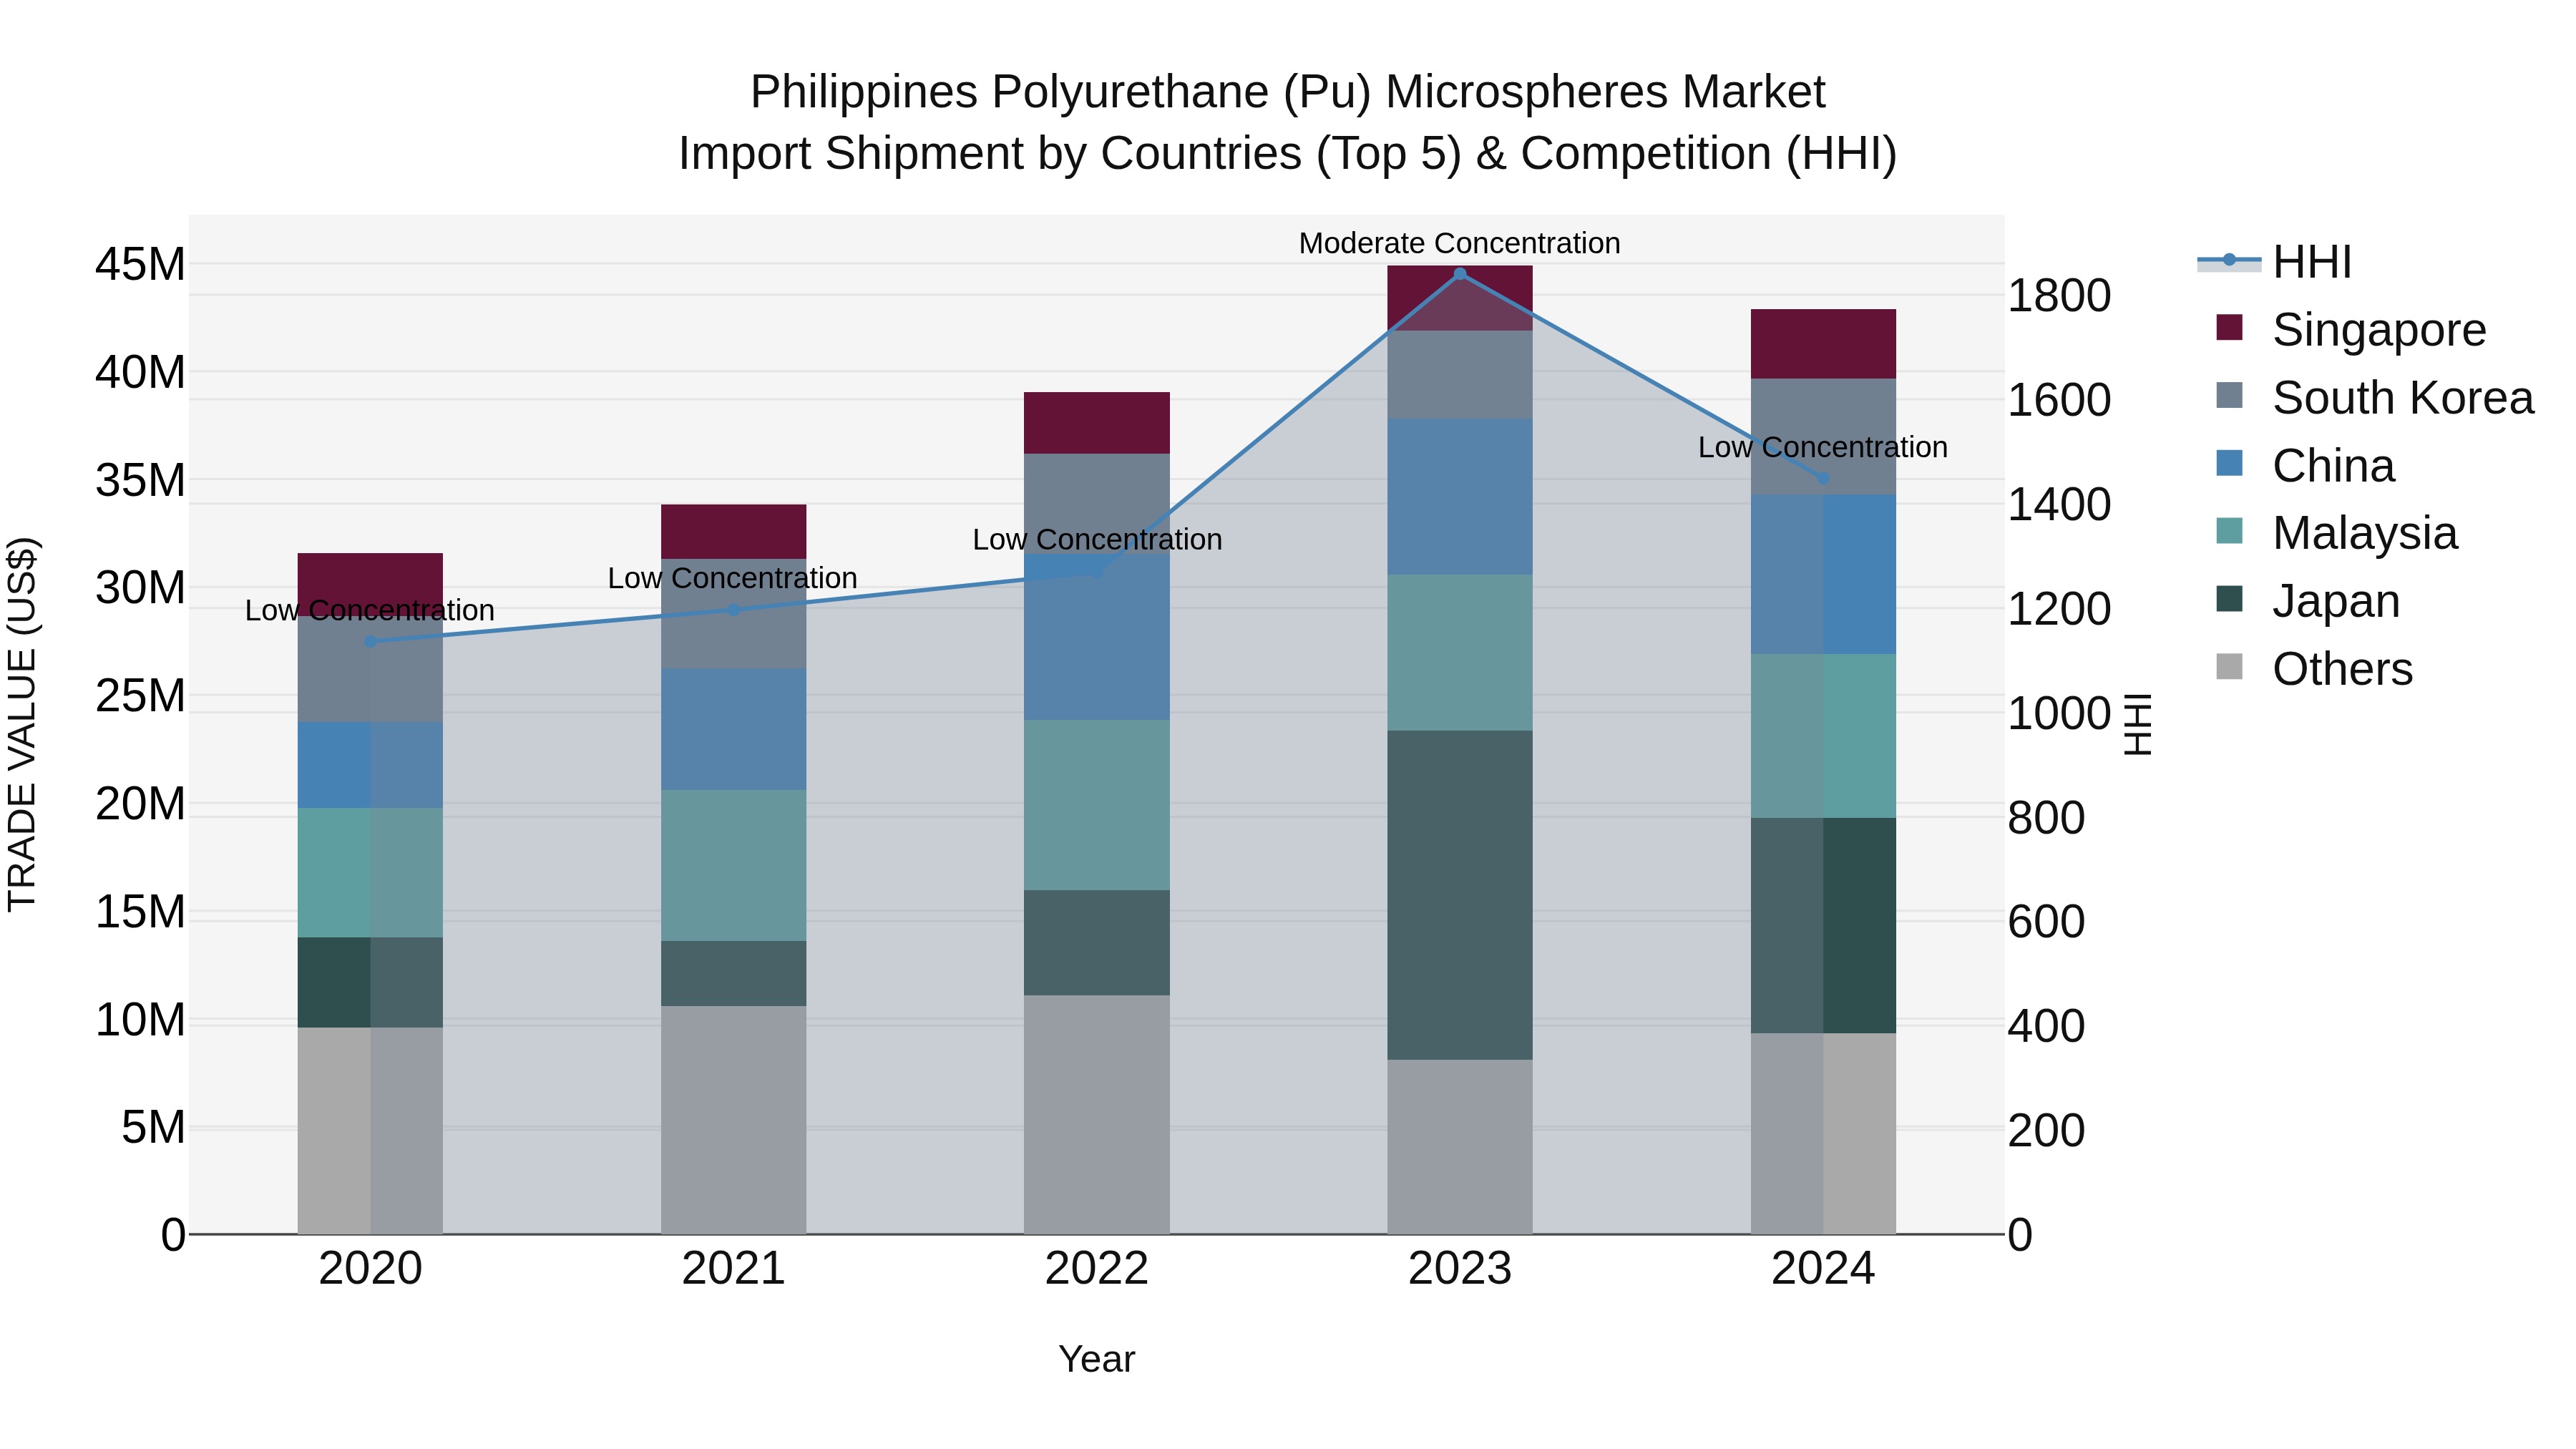
Philippines Polyurethane Pu Microspheres Market Top 5 Importing Countries and Market Competition (HHI) Analysis
The Philippines saw a notable shift in the import of polyurethane microspheres in 2024, with key exporters being Japan, Malaysia, China, South Korea, and Singapore. The market exhibited a decrease in concentration levels from moderate to low, indicating a more diversified import market. The compound annual growth rate (CAGR) from 2020 to 2024 was a healthy 7.95%, despite a slight decline in growth rate from 2023 to 2024. This data suggests a stable demand for polyurethane microspheres in the Philippines, with opportunities for further market expansion and diversification in the coming years.
Philippines Polyurethane (PU) Microspheres Market Overview
Polyurethane microspheres are utilized in coatings, paints, and cosmetics. The cosmetics and construction industries in the Philippines are significant consumers of PU microspheres. The demand for lightweight and efficient materials in coatings and paints
Drivers of the Markets
The Philippines Polyurethane (PU) Microspheres Market has been on an upward trajectory due to the expanding use of microspheres in diverse industries. PU microspheres are valued for their lightweight and insulating properties, making them ideal for applic
Challenges of the Markets
The Philippines Polyurethane Microspheres Market faces challenges related to market awareness and the adoption of advanced materials. Educating potential consumers about the benefits and diverse applications of PU microspheres is crucial. Additionally, th
COVID-19 Impact on the Market
The impact here would depend on the specific industries using PU microspheres. Sectors like construction and automotive, which utilize these microspheres in various applications, may have seen fluctuations in demand based on their pandemic-induced challen
Key Players of the market
In the Philippines, the polyurethane microspheres market features leading companies engaged in the production of PU microspheres, which are used in various industries, including cosmetics, coatings, and automotive. Key players in this market include Micro
Key Highlights of the Report:
- Philippines Polyurethane (PU) Microspheres Market Outlook
- Market Size of Philippines Polyurethane (PU) Microspheres Market, 2024
- Forecast of Philippines Polyurethane (PU) Microspheres Market, 2031
- Historical Data and Forecast of Philippines Polyurethane (PU) Microspheres Revenues & Volume for the Period 2021-2031
- Philippines Polyurethane (PU) Microspheres Market Trend Evolution
- Philippines Polyurethane (PU) Microspheres Market Drivers and Challenges
- Philippines Polyurethane (PU) Microspheres Price Trends
- Philippines Polyurethane (PU) Microspheres Porter's Five Forces
- Philippines Polyurethane (PU) Microspheres Industry Life Cycle
- Historical Data and Forecast of Philippines Polyurethane (PU) Microspheres Market Revenues & Volume By Applications for the Period 2021-2031
- Historical Data and Forecast of Philippines Polyurethane (PU) Microspheres Market Revenues & Volume By Encapsulation for the Period 2021-2031
- Historical Data and Forecast of Philippines Polyurethane (PU) Microspheres Market Revenues & Volume By Paints & coatings for the Period 2021-2031
- Historical Data and Forecast of Philippines Polyurethane (PU) Microspheres Market Revenues & Volume By Adhesives films for the Period 2021-2031
- Historical Data and Forecast of Philippines Polyurethane (PU) Microspheres Market Revenues & Volume By Cosmetics for the Period 2021-2031
- Historical Data and Forecast of Philippines Polyurethane (PU) Microspheres Market Revenues & Volume By Other applications for the Period 2021-2031
- Philippines Polyurethane (PU) Microspheres Import Export Trade Statistics
- Market Opportunity Assessment By Applications
- Philippines Polyurethane (PU) Microspheres Top Companies Market Share
- Philippines Polyurethane (PU) Microspheres Competitive Benchmarking By Technical and Operational Parameters
- Philippines Polyurethane (PU) Microspheres Company Profiles
- Philippines Polyurethane (PU) Microspheres Key Strategic Recommendations
Frequently Asked Questions About the Market Study (FAQs):
6Wresearch actively monitors the Philippines Polyurethane (PU) Microspheres Market and publishes its comprehensive annual report, highlighting emerging trends, growth drivers, revenue analysis, and forecast outlook. Our insights help businesses to make data-backed strategic decisions with ongoing market dynamics. Our analysts track relevent industries related to the Philippines Polyurethane (PU) Microspheres Market, allowing our clients with actionable intelligence and reliable forecasts tailored to emerging regional needs.
Yes, we provide customisation as per your requirements. To learn more, feel free to contact us on sales@6wresearch.com
1 Executive Summary |
2 Introduction |
2.1 Key Highlights of the Report |
2.2 Report Description |
2.3 Market Scope & Segmentation |
2.4 Research Methodology |
2.5 Assumptions |
3 Philippines Polyurethane (PU) Microspheres Market Overview |
3.1 Philippines Country Macro Economic Indicators |
3.2 Philippines Polyurethane (PU) Microspheres Market Revenues & Volume, 2021 & 2031F |
3.3 Philippines Polyurethane (PU) Microspheres Market - Industry Life Cycle |
3.4 Philippines Polyurethane (PU) Microspheres Market - Porter's Five Forces |
3.5 Philippines Polyurethane (PU) Microspheres Market Revenues & Volume Share, By Applications, 2021 & 2031F |
4 Philippines Polyurethane (PU) Microspheres Market Dynamics |
4.1 Impact Analysis |
4.2 Market Drivers |
4.2.1 Growing demand for lightweight materials in various industries such as automotive, construction, and aerospace |
4.2.2 Increasing usage of polyurethane microspheres in the cosmetics and personal care industry for applications like anti-aging products and sunscreens |
4.3 Market Restraints |
4.3.1 Fluctuating raw material prices impacting the production cost of polyurethane microspheres |
4.3.2 Stringent regulations related to environmental concerns and product safety affecting the market growth |
5 Philippines Polyurethane (PU) Microspheres Market Trends |
6 Philippines Polyurethane (PU) Microspheres Market, By Types |
6.1 Philippines Polyurethane (PU) Microspheres Market, By Applications |
6.1.1 Overview and Analysis |
6.1.2 Philippines Polyurethane (PU) Microspheres Market Revenues & Volume, By Applications, 2021-2031F |
6.1.3 Philippines Polyurethane (PU) Microspheres Market Revenues & Volume, By Encapsulation, 2021-2031F |
6.1.4 Philippines Polyurethane (PU) Microspheres Market Revenues & Volume, By Paints & coatings, 2021-2031F |
6.1.5 Philippines Polyurethane (PU) Microspheres Market Revenues & Volume, By Adhesives films, 2021-2031F |
6.1.6 Philippines Polyurethane (PU) Microspheres Market Revenues & Volume, By Cosmetics, 2021-2031F |
6.1.7 Philippines Polyurethane (PU) Microspheres Market Revenues & Volume, By Other applications, 2021-2031F |
7 Philippines Polyurethane (PU) Microspheres Market Import-Export Trade Statistics |
7.1 Philippines Polyurethane (PU) Microspheres Market Export to Major Countries |
7.2 Philippines Polyurethane (PU) Microspheres Market Imports from Major Countries |
8 Philippines Polyurethane (PU) Microspheres Market Key Performance Indicators |
8.1 Research and development investments in innovative applications of polyurethane microspheres |
8.2 Adoption rate of polyurethane microspheres in new industries and applications |
8.3 Number of patents filed for new technologies or processes related to polyurethane microspheres |
9 Philippines Polyurethane (PU) Microspheres Market - Opportunity Assessment |
9.1 Philippines Polyurethane (PU) Microspheres Market Opportunity Assessment, By Applications, 2021 & 2031F |
10 Philippines Polyurethane (PU) Microspheres Market - Competitive Landscape |
10.1 Philippines Polyurethane (PU) Microspheres Market Revenue Share, By Companies, 2024 |
10.2 Philippines Polyurethane (PU) Microspheres Market Competitive Benchmarking, By Operating and Technical Parameters |
11 Company Profiles |
12 Recommendations |
13 Disclaimer |
Global Go To Market Strategy - 2030
Export potential enables firms to identify high-growth global markets with greater confidence by combining advanced trade intelligence with a structured quantitative methodology. The framework analyzes emerging demand trends and country-level import patterns while integrating macroeconomic and trade datasets such as GDP and population forecasts, bilateral import–export flows, tariff structures, elasticity differentials between developed and developing economies, geographic distance, and import demand projections. Using weighted trade values from 2020–2024 as the base period to project country-to-country export potential for 2030, these inputs are operationalized through calculated drivers such as gravity model parameters, tariff impact factors, and projected GDP per-capita growth. Through an analysis of hidden potentials, demand hotspots, and market conditions that are most favorable to success, this method enables firms to focus on target countries, maximize returns, and global expansion with data, backed by accuracy.
By factoring in the projected importer demand gap that is currently unmet and could be potential opportunity, it identifies the potential for the Exporter (Country) among 190 countries, against the general trade analysis, which identifies the biggest importer or exporter.
To discover high-growth global markets and optimize your business strategy:
Click Here
Pricing
- Single User License$ 1,995
- Department License$ 2,400
- Site License$ 3,120
- Global License$ 3,795

Leadership Perspectives from Industry Events
Search
Thought Leadership and Analyst Meet


Our Clients
6WResearch In News
- Doha a strategic location for EV manufacturing hub: IPA Qatar
- Demand for luxury TVs surging in the GCC, says Samsung
- Empowering Growth: The Thriving Journey of Bangladesh’s Cable Industry
- Demand for luxury TVs surging in the GCC, says Samsung
- Video call with a traditional healer? Once unthinkable, it’s now common in South Africa
- Intelligent Buildings To Smooth GCC’s Path To Net Zero
Latest Reports
- Cape Verde Portable Hand-Thrown Extinguisher Market (2026-2032)
- Canada Portable Hand-Thrown Extinguisher Market (2026-2032)
- Cameroon Portable Hand-Thrown Extinguisher Market (2026-2032)
- Burundi Portable Hand-Thrown Extinguisher Market (2026-2032)
- Burkina Faso Portable Hand-Thrown Extinguisher Market (2026-2032)
- Bulgaria Portable Hand-Thrown Extinguisher Market (2026-2032)
- Brunei Portable Hand-Thrown Extinguisher Market (2026-2032)
- Botswana Portable Hand-Thrown Extinguisher Market (2026-2032)
- Bosnia and Herzegovina Portable Hand-Thrown Extinguisher Market (2026-2032)
- Bolivia Portable Hand-Thrown Extinguisher Market (2026-2032)
Industry Events and Analyst Meet

HIMTEX 2026

India Refining Summit 2026

India EV Show 2026

EV tech India Expo 2026

Auto Tech Asia 2026
Whitepaper
- Middle East & Africa Commercial Security Market Click here to view more.
- Middle East & Africa Fire Safety Systems & Equipment Market Click here to view more.
- GCC Drone Market Click here to view more.
- Middle East Lighting Fixture Market Click here to view more.
- GCC Physical & Perimeter Security Market Click here to view more.