Philippines Pulleys Market (2026-2032) | Value, Forecast, Growth, Companies, Share, Revenue, Trends, Outlook, Size, Analysis & Industry
Market Forecast By Type (Steel, Cast Iron, Glass Filled Polymer), By Applications (OEM, Aftermarket) And Competitive Landscape
| Product Code: ETC045249 | Publication Date: Jul 2023 | Updated Date: Jun 2026 | Product Type: Report | |
| Publisher: 6Wresearch | Author: Ravi Bhandari | No. of Pages: 70 | No. of Figures: 35 | No. of Tables: 5 |
Philippines Pulleys Market Summary
The philippines pulleys market was estimated at USD 275 Million in 2025 and is projected to reach USD 366 Million by 2032, growing at a CAGR of 5.0% from 2026 to 2032.
Philippines Pulleys Market Growth Rate Analysis (2021-2032)
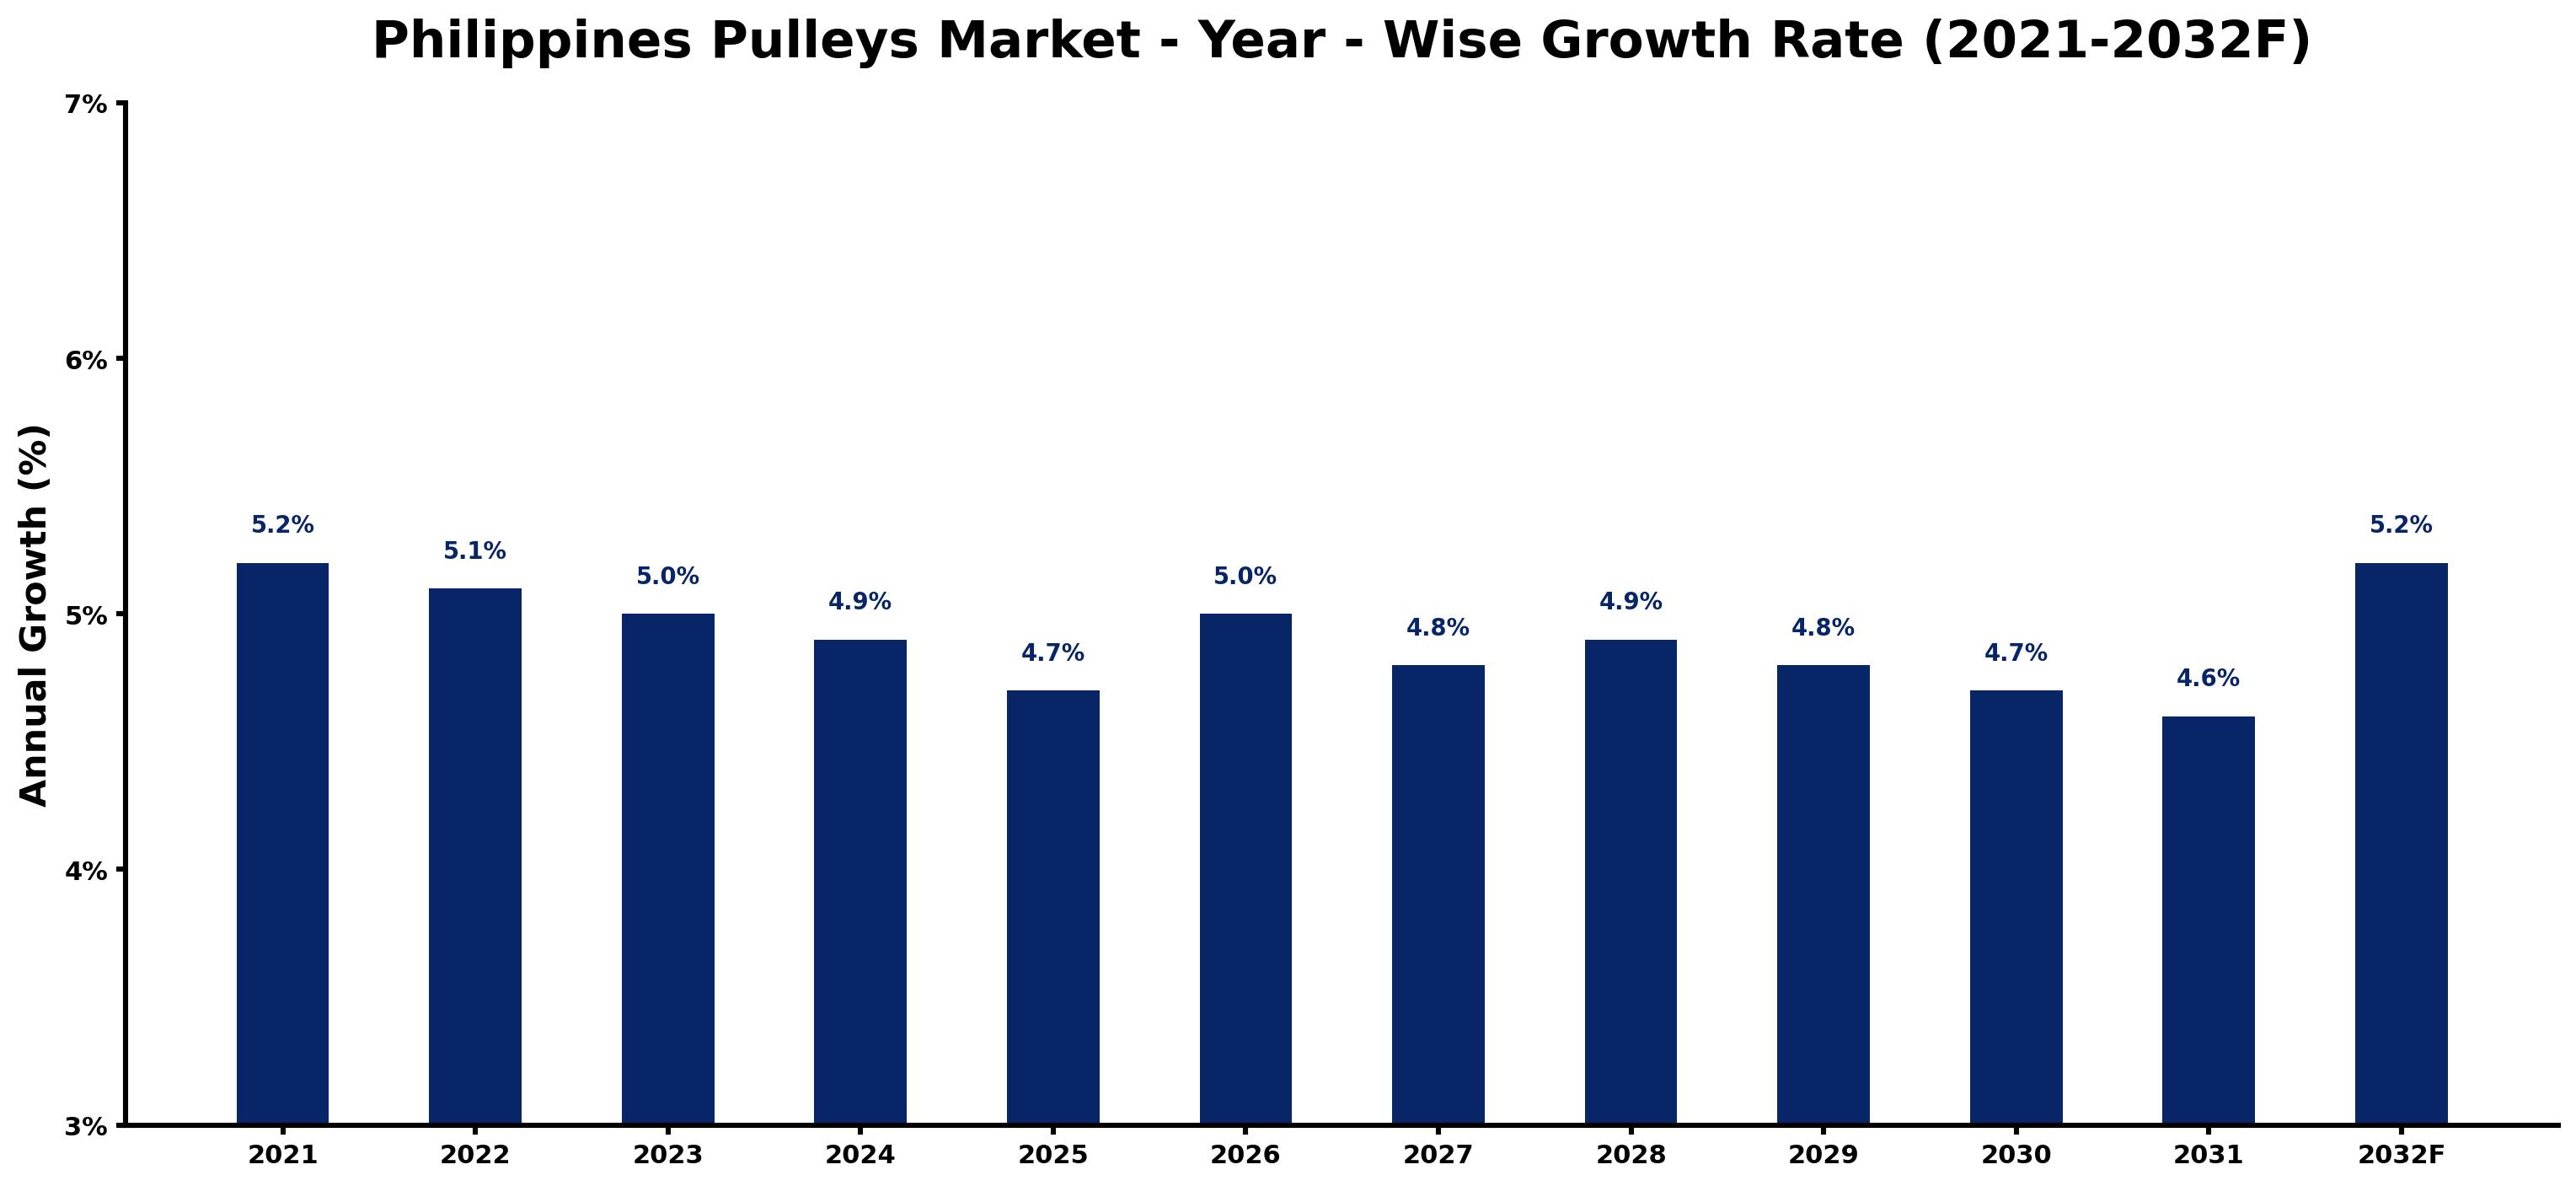
The Philippines pulleys market has exhibited a stable growth pattern, with a notable 5.2% increase in 2021 gradually tapering to 4.6% by 2031. This trend reflects a combination of factors, including rising industrial activity and sustained investments in infrastructure projects, which bolster demand for various lifting and conveying systems. Despite slight declines to 4.9% in 2024 and 4.7% in 2029, the sector recovers to 5.0% in 2026, driven by a renewed focus on digitalization and smart manufacturing technologies. Additionally, energy transition initiatives and evolving consumer demands are further influencing market dynamics, ensuring a robust yet fluctuating growth landscape through 2032 and beyond.
Philippines Pulleys Market Year-wise Growth Rate and Key Drivers
This graph highlights how the Philippines Pulleys Market has steadily grown over the past five years, supported by major growth factors.
The table below presents the year wise growth rates along with the key drivers influencing the market
| Year | Growth Rate | Major Drivers |
| 2021 | 5.2% | Post-lockdown retail projects signal a revival in construction, boosting pulley needs. |
| 2022 | 5.1% | Local manufacturers enhance production capabilities to meet rising industrial demands. |
| 2023 | 5.0% | Infrastructure projects in urban areas highlight the necessity for efficient pulley systems. |
| 2024 | 4.9% | Increased investment in renewable energy pushes demand for specialized lifting equipment. |
| 2025 | 4.7% | Construction industry shifts towards automation, creating a need for advanced pulley technology. |
| 2026 | 5.0% | Urban migration drives demand for infrastructure improvements, necessitating pulley installations. |
| 2027 | 4.8% | Large-scale mining operations enhance equipment requirements, particularly for lifting solutions. |
| 2028 | 4.9% | Focus on disaster resilience promotes the installation of reliable pulley systems in structures. |
| 2029 | 4.8% | Manufacturers prioritize local sourcing, boosting the domestic pulley production landscape. |
| 2030 | 4.7% | Green building certifications encourage the use of sustainable materials in pulley manufacturing. |
| 2031 | 4.6% | Technological innovations in materials lead to stronger and lighter pulleys in various sectors. |
| 2032 | 5.2% | Market consolidation among suppliers results in improved quality standards across the industry. |
Note - Market size estimations and growth projections presented in this report are based on 6Wresearch's advanced forecasting approach, validated with industry datasets as of June 2026.
Philippines Pulleys Market Synopsis
The Philippines Pulleys Market is projected to reach 5.0% and witness significant growth during the forecast period (2026-2032). The anticipated expansion is driven by various factors including increasing industrialization, heightened demand for pulley systems across end-use sectors, and rapid urbanization trends observed in the country. Additionally, ongoing technological advancements in pulley design and functionality are expected to further catalyze market growth, creating opportunities for innovative solutions in the industry.
Philippines Pulleys Market Growth Drivers
The Philippines Pulleys Market is propelled by several key growth drivers that underscore the potential for robust expansion.
- The significant growth in industrialization, particularly in the manufacturing sector, is a driving force behind the rising demand for pulley systems in the country.
- Government initiatives aimed at boosting domestic production, including the 'Make In India' campaign, encourage investments in new projects and infrastructural developments that necessitate efficient equipment like pulleys.
- Technological innovations in the pulley sector have enhanced production processes, allowing for greater output with minimized effort, which further stimulates demand for advanced products.
- The introduction of pulley systems that feature integrated remote monitoring capabilities and superior power efficiency ratings is expected to attract a wider range of industries seeking to optimize their operations.
- As the urbanization trend continues, there is an increasing need for modern material handling systems, thereby enhancing the demand for innovative pulley technologies that meet contemporary operational requirements.
Philippines Pulleys Market Challenges and Restraints
Despite the growth potential, the Philippines Pulleys Market faces several challenges that could impede its progress.
- A significant barrier to market growth is the high cost associated with modern, sophisticated pulley systems, which can constrain investment, particularly for small and medium-sized enterprises (SMEs).
- Budget limitations faced by domestic SMEs often restrict their ability to invest in advanced technologies, leading to a reliance on traditional systems that may lack efficiency.
- The need for skilled labor to operate and maintain advanced pulley systems can present a challenge, particularly in regions where educational resources are limited.
- Market players may experience competitive pressure as they strive to innovate while managing cost structures, which can affect profit margins under tight market conditions.
- Environmental concerns surrounding manufacturing processes and resource utilization may impose additional regulatory requirements, challenging companies to adapt without incurring excessive costs.
Philippines Pulleys Market Government Investment and Initiatives
The government of the Philippines is actively investing in initiatives that promote the growth of the Pulleys Market. These efforts include various public spending projects aimed at enhancing infrastructure and manufacturing capabilities. Policies promoting industrial growth encourage substantial investments in energy-efficient machinery, including pulleys, as part of broader sustainability efforts.
Additionally, the government is providing incentives for companies that adopt innovative technologies and practices, thereby supporting the adoption of advanced pulley systems across multiple sectors. Collaboration between government agencies and private sectors is becoming increasingly prevalent, leading to comprehensive development plans that enhance overall market attractiveness. Such policy frameworks not only aim to bolster domestic manufacturing but also to position the Philippines as a competitive player in the global market.
Philippines Pulleys Market Latest Developments (May 2025 - June 2026)
From May 2025 to June 2026, the Philippines Pulleys Market experienced notable developments that signal a shift in industry direction. Companies are prioritizing research and development efforts to create more energy-efficient and technologically advanced pulley systems, responding to the rising demand for sustainable manufacturing practices.
New partnerships and collaborative projects between technology providers and manufacturing firms have emerged, focused on integrating cutting-edge technologies such as IoT (Internet of Things) into pulley systems, enhancing real-time monitoring and operational efficiency. Additionally, there has been an uptick in trade activities aimed at reinforcing the supply chain capabilities for pulley manufacturers, facilitating better accessibility to advanced components.
As industries adapt to post-pandemic realities, a notable shift towards automation has prompted a reevaluation of material handling systems, including pulleys, thereby creating a fertile ground for innovative solutions and products designed to meet the evolving needs of the marketplace.
Philippines Pulleys Market - Key Attractiveness of the Report
- 10 Years of Market Numbers
- Historical Data Starting from 2022 to 2025
- Base Year: 2025
- Forecast Data until 2032
- Key Performance Indicators Impacting the Market
- Major Upcoming Developments and Projects
Key Highlights of the Report:
- Philippines Pulleys Market Outlook
- Market Size of Philippines Pulleys Market, 2025
- Forecast of Philippines Pulleys Market, 2032
- Historical Data and Forecast of Philippines Pulleys Revenues & Volume for the Period 2022-2032F
- Philippines Pulleys Market Trend Evolution
- Philippines Pulleys Market Drivers and Challenges
- Philippines Pulleys Price Trends
- Philippines Pulleys Porter's Five Forces
- Philippines Pulleys Industry Life Cycle
- Historical Data and Forecast of Philippines Pulleys Market Revenues & Volume By Type for the Period 2022-2032F
- Historical Data and Forecast of Philippines Pulleys Market Revenues & Volume By Steel for the Period 2022-2032F
- Historical Data and Forecast of Philippines Pulleys Market Revenues & Volume By Cast Iron for the Period 2022-2032F
- Historical Data and Forecast of Philippines Pulleys Market Revenues & Volume By Glass Filled Polymer for the Period 2022-2032F
- Historical Data and Forecast of Philippines Pulleys Market Revenues & Volume By Applications for the Period 2022-2032F
- Historical Data and Forecast of Philippines Pulleys Market Revenues & Volume By OEM for the Period 2022-2032F
- Historical Data and Forecast of Philippines Pulleys Market Revenues & Volume By Aftermarket for the Period 2022-2032F
- Philippines Pulleys Import Export Trade Statistics
- Market Opportunity Assessment By Type
- Market Opportunity Assessment By Applications
- Philippines Pulleys Top Companies Market Share
- Philippines Pulleys Competitive Benchmarking By Technical and Operational Parameters
- Philippines Pulleys Company Profiles
- Philippines Pulleys Key Strategic Recommendations
Frequently Asked Questions About the Market Study (FAQs):
The growth is primarily driven by increasing industrialization, government initiatives promoting domestic manufacturing, and advancements in pulley technology catering to modern operational needs.
Challenges include high costs associated with advanced machinery, budget constraints for SMEs, and the need for skilled labor in operating modern pulley systems.
The government is investing in infrastructure projects, providing incentives for technology adoption, and fostering collaborations between public and private sectors to enhance market growth.
Recent developments include increased R&D activities focusing on energy-efficient solutions, the integration of IoT in pulley systems, and collaborative projects aimed at enhancing supply chain efficiency.
6Wresearch actively monitors the Philippines Pulleys Market and publishes its comprehensive annual report, highlighting emerging trends, growth drivers, revenue analysis, and forecast outlook. Our insights help businesses to make data-backed strategic decisions with ongoing market dynamics. Our analysts track relevent industries related to the Philippines Pulleys Market, allowing our clients with actionable intelligence and reliable forecasts tailored to emerging regional needs.
Yes, we provide customisation as per your requirements. To learn more, feel free to contact us on sales@6wresearch.com
1 Executive Summary |
2 Introduction |
2.1 Key Highlights of the Report |
2.2 Report Description |
2.3 Market Scope & Segmentation |
2.4 Research Methodology |
2.5 Assumptions |
3 Philippines Pulleys Market Overview |
3.1 Philippines Country Macro Economic Indicators |
3.2 Philippines Pulleys Market Revenues & Volume, 2022 & 2032F |
3.3 Philippines Pulleys Market - Industry Life Cycle |
3.4 Philippines Pulleys Market - Porter's Five Forces |
3.5 Philippines Pulleys Market Revenues & Volume Share, By Type, 2022 & 2032F |
3.6 Philippines Pulleys Market Revenues & Volume Share, By Applications, 2022 & 2032F |
4 Philippines Pulleys Market Dynamics |
4.1 Impact Analysis |
4.2 Market Drivers |
4.3 Market Restraints |
5 Philippines Pulleys Market Trends |
6 Philippines Pulleys Market, By Types |
6.1 Philippines Pulleys Market, By Type |
6.1.1 Overview and Analysis |
6.1.2 Philippines Pulleys Market Revenues & Volume, By Type, 2022-2032F |
6.1.3 Philippines Pulleys Market Revenues & Volume, By Steel, 2022-2032F |
6.1.4 Philippines Pulleys Market Revenues & Volume, By Cast Iron, 2022-2032F |
6.1.5 Philippines Pulleys Market Revenues & Volume, By Glass Filled Polymer, 2022-2032F |
6.2 Philippines Pulleys Market, By Applications |
6.2.1 Overview and Analysis |
6.2.2 Philippines Pulleys Market Revenues & Volume, By OEM, 2022-2032F |
6.2.3 Philippines Pulleys Market Revenues & Volume, By Aftermarket, 2022-2032F |
7 Philippines Pulleys Market Import-Export Trade Statistics |
7.1 Philippines Pulleys Market Export to Major Countries |
7.2 Philippines Pulleys Market Imports from Major Countries |
8 Philippines Pulleys Market Key Performance Indicators |
9 Philippines Pulleys Market - Opportunity Assessment |
9.1 Philippines Pulleys Market Opportunity Assessment, By Type, 2022 & 2032F |
9.2 Philippines Pulleys Market Opportunity Assessment, By Applications, 2022 & 2032F |
10 Philippines Pulleys Market - Competitive Landscape |
10.1 Philippines Pulleys Market Revenue Share, By Companies, 2025 |
10.2 Philippines Pulleys Market Competitive Benchmarking, By Operating and Technical Parameters |
11 Company Profiles |
12 Recommendations |
13 Disclaimer |
Global Go To Market Strategy - 2030
Export potential enables firms to identify high-growth global markets with greater confidence by combining advanced trade intelligence with a structured quantitative methodology. The framework analyzes emerging demand trends and country-level import patterns while integrating macroeconomic and trade datasets such as GDP and population forecasts, bilateral import–export flows, tariff structures, elasticity differentials between developed and developing economies, geographic distance, and import demand projections. Using weighted trade values from 2020–2024 as the base period to project country-to-country export potential for 2030, these inputs are operationalized through calculated drivers such as gravity model parameters, tariff impact factors, and projected GDP per-capita growth. Through an analysis of hidden potentials, demand hotspots, and market conditions that are most favorable to success, this method enables firms to focus on target countries, maximize returns, and global expansion with data, backed by accuracy.
By factoring in the projected importer demand gap that is currently unmet and could be potential opportunity, it identifies the potential for the Exporter (Country) among 190 countries, against the general trade analysis, which identifies the biggest importer or exporter.
To discover high-growth global markets and optimize your business strategy:
Click Here
Pricing
- Single User License$ 1,995
- Department License$ 2,400
- Site License$ 3,120
- Global License$ 3,795

Leadership Perspectives from Industry Events
Search
Thought Leadership and Analyst Meet


Our Clients
6WResearch In News
- India Air Conditioner Market Set for Strong Rebound in 2026 After Weather-Led Correction and GST-Driven Recovery: 6Wresearch
- ADAS in India: How Automatic Emergency Braking, Blind Spot Detection & Driver Monitoring are Transforming Road Safety
- Doha a strategic location for EV manufacturing hub: IPA Qatar
- Demand for luxury TVs surging in the GCC, says Samsung
- Empowering Growth: The Thriving Journey of Bangladesh’s Cable Industry
- Demand for luxury TVs surging in the GCC, says Samsung
Latest Reports
- Nicaragua RPG Gaming Market (2026-2032)
- New Zealand RPG Gaming Market (2026-2032)
- Netherlands RPG Gaming Market (2026-2032)
- Nauru RPG Gaming Market (2026-2032)
- Namibia RPG Gaming Market (2026-2032)
- Mozambique RPG Gaming Market (2026-2032)
- Montenegro RPG Gaming Market (2026-2032)
- Mongolia RPG Gaming Market (2026-2032)
- Monaco RPG Gaming Market (2026-2032)
- Micronesia RPG Gaming Market (2026-2032)
Industry Events and Analyst Meet

HIMTEX 2026

India Refining Summit 2026

India EV Show 2026

EV tech India Expo 2026

Auto Tech Asia 2026
Whitepaper
- Middle East & Africa Commercial Security Market Click here to view more.
- Middle East & Africa Fire Safety Systems & Equipment Market Click here to view more.
- GCC Drone Market Click here to view more.
- Middle East Lighting Fixture Market Click here to view more.
- GCC Physical & Perimeter Security Market Click here to view more.