Philippines Steel Drawn Wire Market (2025-2031) | Segmentation, Forecast, Size & Revenue, Growth, Outlook, Competitive Landscape, Analysis, Share, Value, Industry, Trends, Companies
Market Forecast By Product Type (Carbon Steel, Stainless Steel, Alloy Steel), By Diameter (Up to 5 mm, 6-10 mm, 11-15 mm, 16-20 mm, Above 20 mm), By End-user (Automotive, Construction, Military, Telecom, Power & Energy, Heavy Machinery, Others (Aviation, Agriculture, etc.)), By Distribution Channel (Direct Sales, Indirect Sales) And Competitive Landscape
| Product Code: ETC8852404 | Publication Date: Sep 2024 | Updated Date: Nov 2025 | Product Type: Market Research Report | |
| Publisher: 6Wresearch | Author: Dhaval Chaurasia | No. of Pages: 75 | No. of Figures: 35 | No. of Tables: 20 |
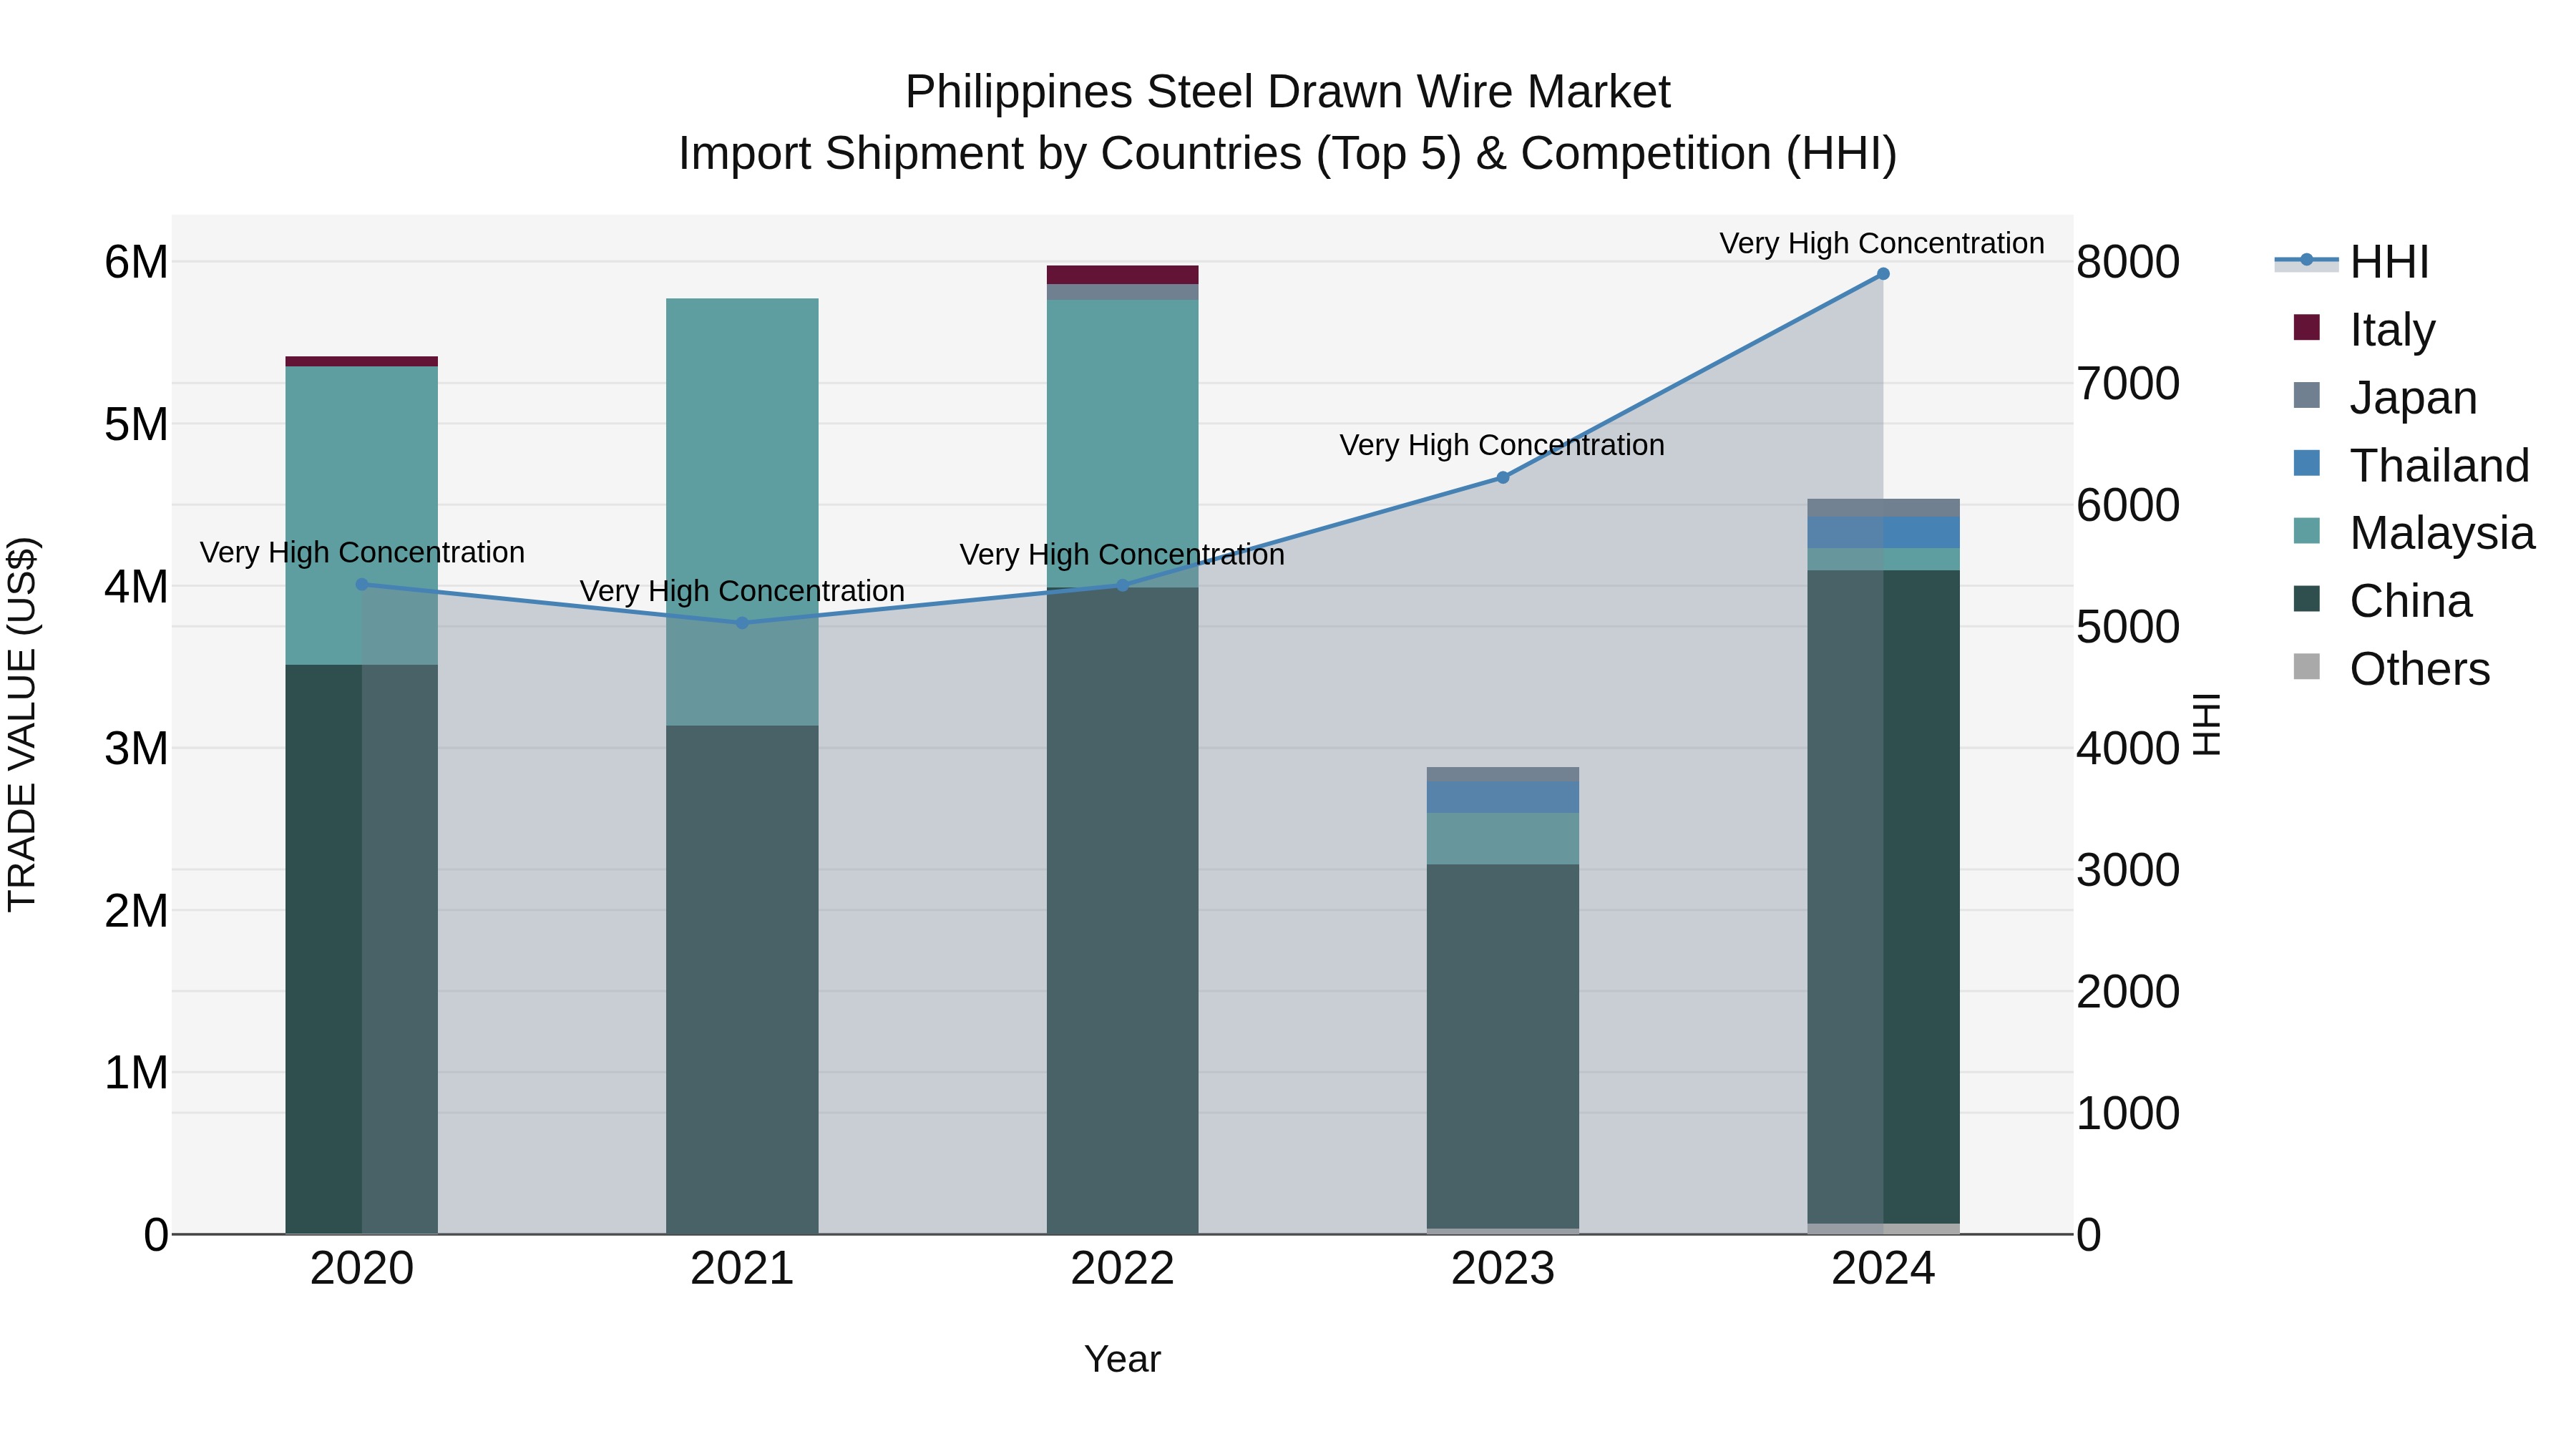
Philippines Steel Drawn Wire Market Top 5 Importing Countries and Market Competition (HHI) Analysis
The Philippines steel drawn wire import market in 2024 continued to be dominated by top exporters such as China, Thailand, Malaysia, Japan, and South Korea. Despite a high Herfindahl-Hirschman Index indicating concentrated market share, the industry experienced a negative compound annual growth rate of -4.32% from 2020 to 2024. However, there was a notable uptick in growth in 2024 with a growth rate of 57.41% compared to the previous year, suggesting potential shifts in market dynamics and opportunities for stakeholders in the steel drawn wire sector.
Philippines Steel Drawn Wire Market Overview
The steel drawn wire market in the Philippines is expanding with increasing construction, infrastructure, and manufacturing activities. Steel wires are essential for reinforcement, fencing, and industrial applications. Technological advancements in wire production are improving tensile strength and corrosion resistance.
Drivers of the market
Steel drawn wire is widely used in construction, automotive, and industrial manufacturing in the Philippines. The booming real estate and infrastructure sectors are driving demand for high-strength steel wires. Advances in wire processing technologies and the increasing adoption of galvanized and coated steel wires are shaping market trends.
Challenges of the market
The steel drawn wire market struggles with high production costs, raw material supply fluctuations, and competition from imported steel products. The volatility of steel prices affects manufacturing expenses, impacting profit margins. Additionally, the Philippines relies on imported raw materials for steel production, leading to supply chain disruptions. The availability of cheaper imported steel products from neighboring countries also creates competitive pressures.
Investment opportunities in the Market
The construction, automotive, and industrial manufacturing sectors are driving demand for high-strength steel drawn wire. Investment in advanced production techniques, corrosion-resistant coatings, and customized wire solutions will expand market opportunities. Companies catering to infrastructure development projects will benefit from rising demand.
Government Policy of the market
The steel industry is governed by policies from the Department of Trade and Industry (DTI), ensuring quality standards for drawn wire products. Tariff regulations protect local manufacturers from unfair foreign competition, while infrastructure projects drive demand for high-quality steel products.
Key Highlights of the Report:
- Philippines Steel Drawn Wire Market Outlook
- Market Size of Philippines Steel Drawn Wire Market, 2024
- Forecast of Philippines Steel Drawn Wire Market, 2031
- Historical Data and Forecast of Philippines Steel Drawn Wire Revenues & Volume for the Period 2021- 2031
- Philippines Steel Drawn Wire Market Trend Evolution
- Philippines Steel Drawn Wire Market Drivers and Challenges
- Philippines Steel Drawn Wire Price Trends
- Philippines Steel Drawn Wire Porter's Five Forces
- Philippines Steel Drawn Wire Industry Life Cycle
- Historical Data and Forecast of Philippines Steel Drawn Wire Market Revenues & Volume By Product Type for the Period 2021- 2031
- Historical Data and Forecast of Philippines Steel Drawn Wire Market Revenues & Volume By Carbon Steel for the Period 2021- 2031
- Historical Data and Forecast of Philippines Steel Drawn Wire Market Revenues & Volume By Stainless Steel for the Period 2021- 2031
- Historical Data and Forecast of Philippines Steel Drawn Wire Market Revenues & Volume By Alloy Steel for the Period 2021- 2031
- Historical Data and Forecast of Philippines Steel Drawn Wire Market Revenues & Volume By Diameter for the Period 2021- 2031
- Historical Data and Forecast of Philippines Steel Drawn Wire Market Revenues & Volume By Up to 5 mm for the Period 2021- 2031
- Historical Data and Forecast of Philippines Steel Drawn Wire Market Revenues & Volume By 6-10 mm for the Period 2021- 2031
- Historical Data and Forecast of Philippines Steel Drawn Wire Market Revenues & Volume By 11-15 mm for the Period 2021- 2031
- Historical Data and Forecast of Philippines Steel Drawn Wire Market Revenues & Volume By 16-20 mm for the Period 2021- 2031
- Historical Data and Forecast of Philippines Steel Drawn Wire Market Revenues & Volume By Above 20 mm for the Period 2021- 2031
- Historical Data and Forecast of Philippines Steel Drawn Wire Market Revenues & Volume By End-user for the Period 2021- 2031
- Historical Data and Forecast of Philippines Steel Drawn Wire Market Revenues & Volume By Automotive for the Period 2021- 2031
- Historical Data and Forecast of Philippines Steel Drawn Wire Market Revenues & Volume By Construction for the Period 2021- 2031
- Historical Data and Forecast of Philippines Steel Drawn Wire Market Revenues & Volume By Military for the Period 2021- 2031
- Historical Data and Forecast of Philippines Steel Drawn Wire Market Revenues & Volume By Telecom for the Period 2021- 2031
- Historical Data and Forecast of Philippines Steel Drawn Wire Market Revenues & Volume By Power & Energy for the Period 2021- 2031
- Historical Data and Forecast of Philippines Steel Drawn Wire Market Revenues & Volume By Heavy Machinery for the Period 2021- 2031
- Historical Data and Forecast of Philippines Steel Drawn Wire Market Revenues & Volume By Others (Aviation, Agriculture, etc.) for the Period 2021- 2031
- Historical Data and Forecast of Philippines Steel Drawn Wire Market Revenues & Volume By Distribution Channel for the Period 2021- 2031
- Historical Data and Forecast of Philippines Steel Drawn Wire Market Revenues & Volume By Direct Sales for the Period 2021- 2031
- Historical Data and Forecast of Philippines Steel Drawn Wire Market Revenues & Volume By Indirect Sales for the Period 2021- 2031
- Philippines Steel Drawn Wire Import Export Trade Statistics
- Market Opportunity Assessment By Product Type
- Market Opportunity Assessment By Diameter
- Market Opportunity Assessment By End-user
- Market Opportunity Assessment By Distribution Channel
- Philippines Steel Drawn Wire Top Companies Market Share
- Philippines Steel Drawn Wire Competitive Benchmarking By Technical and Operational Parameters
- Philippines Steel Drawn Wire Company Profiles
- Philippines Steel Drawn Wire Key Strategic Recommendations
Frequently Asked Questions About the Market Study (FAQs):
6Wresearch actively monitors the Philippines Steel Drawn Wire Market and publishes its comprehensive annual report, highlighting emerging trends, growth drivers, revenue analysis, and forecast outlook. Our insights help businesses to make data-backed strategic decisions with ongoing market dynamics. Our analysts track relevent industries related to the Philippines Steel Drawn Wire Market, allowing our clients with actionable intelligence and reliable forecasts tailored to emerging regional needs.
Yes, we provide customisation as per your requirements. To learn more, feel free to contact us on sales@6wresearch.com
1 Executive Summary |
2 Introduction |
2.1 Key Highlights of the Report |
2.2 Report Description |
2.3 Market Scope & Segmentation |
2.4 Research Methodology |
2.5 Assumptions |
3 Philippines Steel Drawn Wire Market Overview |
3.1 Philippines Country Macro Economic Indicators |
3.2 Philippines Steel Drawn Wire Market Revenues & Volume, 2021 & 2031F |
3.3 Philippines Steel Drawn Wire Market - Industry Life Cycle |
3.4 Philippines Steel Drawn Wire Market - Porter's Five Forces |
3.5 Philippines Steel Drawn Wire Market Revenues & Volume Share, By Product Type, 2021 & 2031F |
3.6 Philippines Steel Drawn Wire Market Revenues & Volume Share, By Diameter, 2021 & 2031F |
3.7 Philippines Steel Drawn Wire Market Revenues & Volume Share, By End-user, 2021 & 2031F |
3.8 Philippines Steel Drawn Wire Market Revenues & Volume Share, By Distribution Channel, 2021 & 2031F |
4 Philippines Steel Drawn Wire Market Dynamics |
4.1 Impact Analysis |
4.2 Market Drivers |
4.2.1 Growing construction industry in the Philippines, leading to increased demand for steel drawn wire for reinforcement purposes. |
4.2.2 Infrastructure development projects in the country driving the demand for steel drawn wire for various applications. |
4.2.3 Increasing investments in industrial and manufacturing sectors using steel drawn wire for production processes. |
4.3 Market Restraints |
4.3.1 Fluctuating prices of raw materials impacting the production cost of steel drawn wire. |
4.3.2 Competition from alternative materials like aluminum and composite materials affecting the market growth. |
4.3.3 Environmental regulations and sustainability concerns influencing the production and usage of steel drawn wire. |
5 Philippines Steel Drawn Wire Market Trends |
6 Philippines Steel Drawn Wire Market, By Types |
6.1 Philippines Steel Drawn Wire Market, By Product Type |
6.1.1 Overview and Analysis |
6.1.2 Philippines Steel Drawn Wire Market Revenues & Volume, By Product Type, 2021- 2031F |
6.1.3 Philippines Steel Drawn Wire Market Revenues & Volume, By Carbon Steel, 2021- 2031F |
6.1.4 Philippines Steel Drawn Wire Market Revenues & Volume, By Stainless Steel, 2021- 2031F |
6.1.5 Philippines Steel Drawn Wire Market Revenues & Volume, By Alloy Steel, 2021- 2031F |
6.2 Philippines Steel Drawn Wire Market, By Diameter |
6.2.1 Overview and Analysis |
6.2.2 Philippines Steel Drawn Wire Market Revenues & Volume, By Up to 5 mm, 2021- 2031F |
6.2.3 Philippines Steel Drawn Wire Market Revenues & Volume, By 6-10 mm, 2021- 2031F |
6.2.4 Philippines Steel Drawn Wire Market Revenues & Volume, By 11-15 mm, 2021- 2031F |
6.2.5 Philippines Steel Drawn Wire Market Revenues & Volume, By 16-20 mm, 2021- 2031F |
6.2.6 Philippines Steel Drawn Wire Market Revenues & Volume, By Above 20 mm, 2021- 2031F |
6.3 Philippines Steel Drawn Wire Market, By End-user |
6.3.1 Overview and Analysis |
6.3.2 Philippines Steel Drawn Wire Market Revenues & Volume, By Automotive, 2021- 2031F |
6.3.3 Philippines Steel Drawn Wire Market Revenues & Volume, By Construction, 2021- 2031F |
6.3.4 Philippines Steel Drawn Wire Market Revenues & Volume, By Military, 2021- 2031F |
6.3.5 Philippines Steel Drawn Wire Market Revenues & Volume, By Telecom, 2021- 2031F |
6.3.6 Philippines Steel Drawn Wire Market Revenues & Volume, By Power & Energy, 2021- 2031F |
6.3.7 Philippines Steel Drawn Wire Market Revenues & Volume, By Heavy Machinery, 2021- 2031F |
6.4 Philippines Steel Drawn Wire Market, By Distribution Channel |
6.4.1 Overview and Analysis |
6.4.2 Philippines Steel Drawn Wire Market Revenues & Volume, By Direct Sales, 2021- 2031F |
6.4.3 Philippines Steel Drawn Wire Market Revenues & Volume, By Indirect Sales, 2021- 2031F |
7 Philippines Steel Drawn Wire Market Import-Export Trade Statistics |
7.1 Philippines Steel Drawn Wire Market Export to Major Countries |
7.2 Philippines Steel Drawn Wire Market Imports from Major Countries |
8 Philippines Steel Drawn Wire Market Key Performance Indicators |
8.1 Average selling price of steel drawn wire in the Philippines market. |
8.2 Adoption rate of new technologies in steel drawn wire production. |
8.3 Number of construction permits issued in the Philippines. |
8.4 Capacity utilization rate of steel drawn wire manufacturers in the country. |
8.5 Percentage of steel drawn wire imports compared to domestic production. |
9 Philippines Steel Drawn Wire Market - Opportunity Assessment |
9.1 Philippines Steel Drawn Wire Market Opportunity Assessment, By Product Type, 2021 & 2031F |
9.2 Philippines Steel Drawn Wire Market Opportunity Assessment, By Diameter, 2021 & 2031F |
9.3 Philippines Steel Drawn Wire Market Opportunity Assessment, By End-user, 2021 & 2031F |
9.4 Philippines Steel Drawn Wire Market Opportunity Assessment, By Distribution Channel, 2021 & 2031F |
10 Philippines Steel Drawn Wire Market - Competitive Landscape |
10.1 Philippines Steel Drawn Wire Market Revenue Share, By Companies, 2024 |
10.2 Philippines Steel Drawn Wire Market Competitive Benchmarking, By Operating and Technical Parameters |
11 Company Profiles |
12 Recommendations |
13 Disclaimer |
Export potential assessment - trade Analytics for 2030
Export potential enables firms to identify high-growth global markets with greater confidence by combining advanced trade intelligence with a structured quantitative methodology. The framework analyzes emerging demand trends and country-level import patterns while integrating macroeconomic and trade datasets such as GDP and population forecasts, bilateral import–export flows, tariff structures, elasticity differentials between developed and developing economies, geographic distance, and import demand projections. Using weighted trade values from 2020–2024 as the base period to project country-to-country export potential for 2030, these inputs are operationalized through calculated drivers such as gravity model parameters, tariff impact factors, and projected GDP per-capita growth. Through an analysis of hidden potentials, demand hotspots, and market conditions that are most favorable to success, this method enables firms to focus on target countries, maximize returns, and global expansion with data, backed by accuracy.
By factoring in the projected importer demand gap that is currently unmet and could be potential opportunity, it identifies the potential for the Exporter (Country) among 190 countries, against the general trade analysis, which identifies the biggest importer or exporter.
To discover high-growth global markets and optimize your business strategy:
Click Here
Pricing
- Single User License$ 1,995
- Department License$ 2,400
- Site License$ 3,120
- Global License$ 3,795

Search
Thought Leadership and Analyst Meet


Our Clients
Latest Reports
- United Kingdom (UK) Long-term Care Insurance Market (2026-2032) | Growth, Share, Consumer Insights, Drivers, Opportunities, Competition, Pricing Analysis, Segments, Restraints, Companies, Competitive, Value, Outlook, Size, Demand, Analysis, Challenges, Strategic Insights, Investment Trends, Revenue, Trends, Supply, Forecast
- United Kingdom (UK) Long Term Care Market (2026-2032) | Companies, Outlook, Analysis, Trends, Value, Revenue, Segmentation, Share, Forecast, Competitive Landscape, Growth, Size & Forecast
- Iraq Insulation and Waterproofing Market (2026-2032) | Outlook, Drivers, Growth, Size, Share, Industry, Revenue, Trends, Demand, Competitive, Strategic Insights, Opportunities, Segments, Companies, Challenges, Strategy, Consumer Insights, Analysis, Investment Trends, Value, Segmentation, Forecast, Restraints
- India Switchgear Market Outlook (2026 - 2032) | Size, Share, Trends, Growth, Revenue, Forecast, Analysis, Value, Outlook
- Pakistan Contraceptive Implants Market (2025-2031) | Demand, Growth, Size, Share, Industry, Pricing Analysis, Competitive, Strategic Insights, Strategy, Consumer Insights, Analysis, Investment Trends, Opportunities, Revenue, Segments, Value, Segmentation, Supply, Forecast, Restraints, Outlook, Competition, Drivers, Trends, Companies, Challenges
- Sri Lanka Packaging Market (2026-2032) | Outlook, Competition, Drivers, Trends, Demand, Pricing Analysis, Competitive, Strategic Insights, Companies, Challenges, Strategy, Consumer Insights, Analysis, Investment Trends, Opportunities, Growth, Size, Share, Industry, Revenue, Segments, Value, Segmentation, Supply, Forecast, Restraints
- India Kids Watches Market (2026-2032) | Strategy, Consumer Insights, Analysis, Investment Trends, Opportunities, Growth, Size, Share, Industry, Revenue, Segments, Value, Segmentation, Supply, Forecast, Restraints, Outlook, Competition, Drivers, Trends, Demand, Pricing Analysis, Competitive, Strategic Insights, Companies, Challenges
- Saudi Arabia Core Assurance Service Market (2025-2031) | Strategy, Consumer Insights, Analysis, Investment Trends, Opportunities, Growth, Size, Share, Industry, Revenue, Segments, Value, Segmentation, Supply, Forecast, Restraints, Outlook, Competition, Drivers, Trends, Demand, Pricing Analysis, Competitive, Strategic Insights, Companies, Challenges
- Romania Uninterruptible Power Supply (UPS) Market (2026-2032) | Industry, Analysis, Revenue, Size, Forecast, Outlook, Value, Trends, Share, Growth & Companies
- Saudi Arabia Car Window Tinting Film, Paint Protection Film (PPF), and Ceramic Coating Market (2025-2031) | Strategy, Consumer Insights, Analysis, Investment Trends, Opportunities, Growth, Size, Share, Industry, Revenue, Segments, Value, Segmentation, Supply, Forecast, Restraints, Outlook, Competition, Drivers, Trends, Demand, Pricing Analysis, Competitive, Strategic Insights, Companies, Challenges
Industry Events and Analyst Meet

India EV Show 2026

EV tech India Expo 2026

Auto Tech Asia 2026

Battery Tech India 2026

Smart Production Solutions Guangzhou 2026
Whitepaper
- Middle East & Africa Commercial Security Market Click here to view more.
- Middle East & Africa Fire Safety Systems & Equipment Market Click here to view more.
- GCC Drone Market Click here to view more.
- Middle East Lighting Fixture Market Click here to view more.
- GCC Physical & Perimeter Security Market Click here to view more.
6WResearch In News
- Doha a strategic location for EV manufacturing hub: IPA Qatar
- Demand for luxury TVs surging in the GCC, says Samsung
- Empowering Growth: The Thriving Journey of Bangladesh’s Cable Industry
- Demand for luxury TVs surging in the GCC, says Samsung
- Video call with a traditional healer? Once unthinkable, it’s now common in South Africa
- Intelligent Buildings To Smooth GCC’s Path To Net Zero