Philippines Table Top Sweeteners Market (2025-2031) | Trends, Outlook, Analysis, Forecast, Industry, Share, Value, Size & Revenue, Competitive Landscape, Segmentation, Growth, Companies
Market Forecast By Type (Natural, Artificial), By Application (Dining Room, Family, Others) And Competitive Landscape
| Product Code: ETC8853001 | Publication Date: Sep 2024 | Updated Date: Nov 2025 | Product Type: Market Research Report | |
| Publisher: 6Wresearch | Author: Summon Dutta | No. of Pages: 75 | No. of Figures: 35 | No. of Tables: 20 |
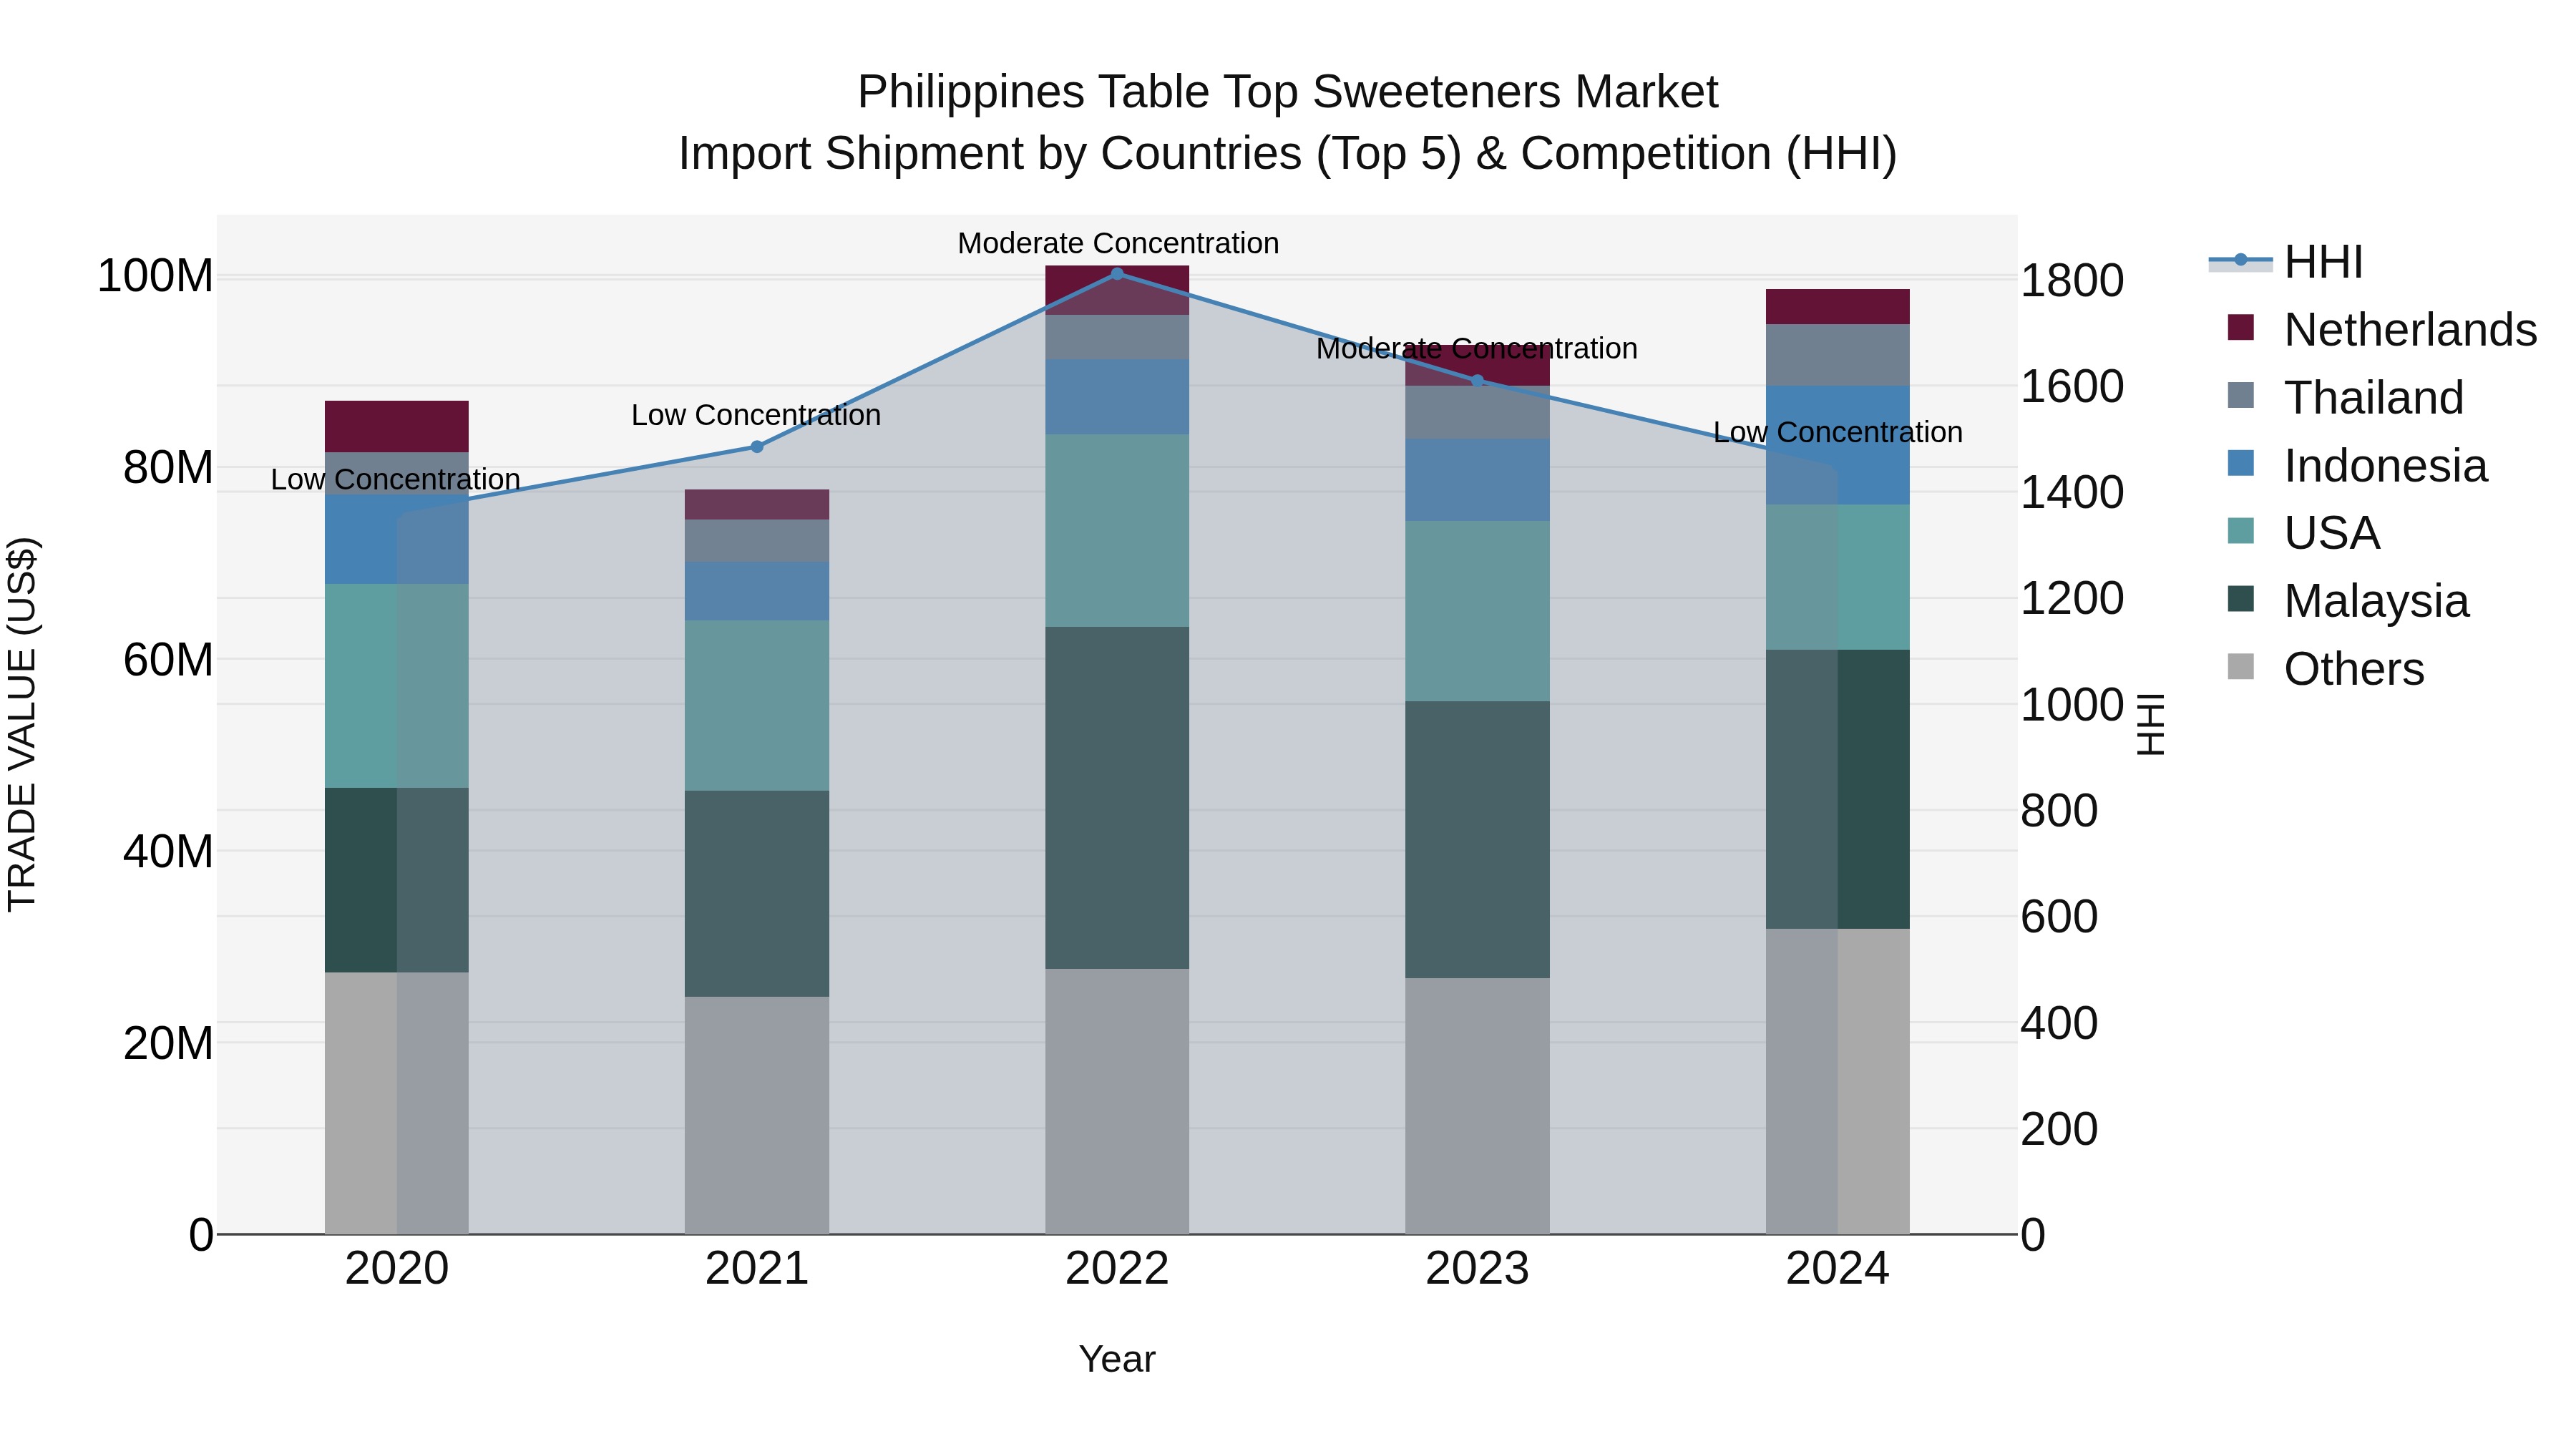
Philippines Table Top Sweeteners Market Top 5 Importing Countries and Market Competition (HHI) Analysis
The Philippines saw significant growth in table top sweeteners import shipments in 2024, with top exporting countries being Malaysia, USA, Indonesia, South Korea, and Thailand. The market concentration, as measured by the HHI, decreased from moderate to low in 2024, indicating a more diversified import market. The compound annual growth rate (CAGR) from 2020 to 2024 was 3.17%, and the growth rate from 2023 to 2024 stood at an impressive 6.27%. This suggests a positive outlook for the table top sweeteners market in the Philippines, driven by a variety of sources and sustained growth momentum.
Philippines Table Top Sweeteners Market Overview
Tabletop sweeteners, especially those using stevia, sucralose, and aspartame, are gaining popularity in the Philippines among health-conscious individuals. The market benefits from increased demand for sugar alternatives in home use, especially among diabetic and calorie-conscious consumers. Retail distribution and online sales support market penetration.
Drivers of the market
The market for tabletop sweeteners in the Philippines is expanding as consumers look for healthier alternatives to sugar. Products based on aspartame, sucralose, and stevia dominate retail shelves, with demand growing from diabetic and weight-conscious consumers seeking sugar substitutes for daily use.
Challenges of the market
The market for tabletop sweeteners is constrained by low consumer awareness, skepticism about the health implications of artificial sweeteners, and stiff competition from natural alternatives like honey and stevia. Price sensitivity and limited promotional campaigns also prevent widespread market penetration.
Investment opportunities in the Market
Demand for tabletop sweeteners is rising alongside a greater awareness of sugar intake. Investors can enter the market by offering competitively priced products, especially those based on natural sources, targeting cafés, restaurants, and retail chains.
Government Policy of the market
The food and health regulatory bodies ensure that tabletop sweeteners comply with national food safety laws. FDA Philippines sets strict guidelines on artificial and natural sweeteners, requiring rigorous testing and labeling. There is also growing government interest in promoting healthier food alternatives in line with public health strategies.
Key Highlights of the Report:
- Philippines Table Top Sweeteners Market Outlook
- Market Size of Philippines Table Top Sweeteners Market, 2024
- Forecast of Philippines Table Top Sweeteners Market, 2031
- Historical Data and Forecast of Philippines Table Top Sweeteners Revenues & Volume for the Period 2021- 2031
- Philippines Table Top Sweeteners Market Trend Evolution
- Philippines Table Top Sweeteners Market Drivers and Challenges
- Philippines Table Top Sweeteners Price Trends
- Philippines Table Top Sweeteners Porter's Five Forces
- Philippines Table Top Sweeteners Industry Life Cycle
- Historical Data and Forecast of Philippines Table Top Sweeteners Market Revenues & Volume By Type for the Period 2021- 2031
- Historical Data and Forecast of Philippines Table Top Sweeteners Market Revenues & Volume By Natural for the Period 2021- 2031
- Historical Data and Forecast of Philippines Table Top Sweeteners Market Revenues & Volume By Artificial for the Period 2021- 2031
- Historical Data and Forecast of Philippines Table Top Sweeteners Market Revenues & Volume By Application for the Period 2021- 2031
- Historical Data and Forecast of Philippines Table Top Sweeteners Market Revenues & Volume By Dining Room for the Period 2021- 2031
- Historical Data and Forecast of Philippines Table Top Sweeteners Market Revenues & Volume By Family for the Period 2021- 2031
- Historical Data and Forecast of Philippines Table Top Sweeteners Market Revenues & Volume By Others for the Period 2021- 2031
- Philippines Table Top Sweeteners Import Export Trade Statistics
- Market Opportunity Assessment By Type
- Market Opportunity Assessment By Application
- Philippines Table Top Sweeteners Top Companies Market Share
- Philippines Table Top Sweeteners Competitive Benchmarking By Technical and Operational Parameters
- Philippines Table Top Sweeteners Company Profiles
- Philippines Table Top Sweeteners Key Strategic Recommendations
Frequently Asked Questions About the Market Study (FAQs):
6Wresearch actively monitors the Philippines Table Top Sweeteners Market and publishes its comprehensive annual report, highlighting emerging trends, growth drivers, revenue analysis, and forecast outlook. Our insights help businesses to make data-backed strategic decisions with ongoing market dynamics. Our analysts track relevent industries related to the Philippines Table Top Sweeteners Market, allowing our clients with actionable intelligence and reliable forecasts tailored to emerging regional needs.
Yes, we provide customisation as per your requirements. To learn more, feel free to contact us on sales@6wresearch.com
1 Executive Summary |
2 Introduction |
2.1 Key Highlights of the Report |
2.2 Report Description |
2.3 Market Scope & Segmentation |
2.4 Research Methodology |
2.5 Assumptions |
3 Philippines Table Top Sweeteners Market Overview |
3.1 Philippines Country Macro Economic Indicators |
3.2 Philippines Table Top Sweeteners Market Revenues & Volume, 2021 & 2031F |
3.3 Philippines Table Top Sweeteners Market - Industry Life Cycle |
3.4 Philippines Table Top Sweeteners Market - Porter's Five Forces |
3.5 Philippines Table Top Sweeteners Market Revenues & Volume Share, By Type, 2021 & 2031F |
3.6 Philippines Table Top Sweeteners Market Revenues & Volume Share, By Application, 2021 & 2031F |
4 Philippines Table Top Sweeteners Market Dynamics |
4.1 Impact Analysis |
4.2 Market Drivers |
4.2.1 Increasing health consciousness and preference for low-calorie sweeteners |
4.2.2 Growth in diabetic population seeking sugar alternatives |
4.2.3 Rising consumer awareness about the harmful effects of sugar consumption |
4.3 Market Restraints |
4.3.1 Availability of natural sweeteners in the market |
4.3.2 Concerns regarding the safety and long-term health effects of artificial sweeteners |
4.3.3 Price sensitivity among consumers |
5 Philippines Table Top Sweeteners Market Trends |
6 Philippines Table Top Sweeteners Market, By Types |
6.1 Philippines Table Top Sweeteners Market, By Type |
6.1.1 Overview and Analysis |
6.1.2 Philippines Table Top Sweeteners Market Revenues & Volume, By Type, 2021- 2031F |
6.1.3 Philippines Table Top Sweeteners Market Revenues & Volume, By Natural, 2021- 2031F |
6.1.4 Philippines Table Top Sweeteners Market Revenues & Volume, By Artificial, 2021- 2031F |
6.2 Philippines Table Top Sweeteners Market, By Application |
6.2.1 Overview and Analysis |
6.2.2 Philippines Table Top Sweeteners Market Revenues & Volume, By Dining Room, 2021- 2031F |
6.2.3 Philippines Table Top Sweeteners Market Revenues & Volume, By Family, 2021- 2031F |
6.2.4 Philippines Table Top Sweeteners Market Revenues & Volume, By Others, 2021- 2031F |
7 Philippines Table Top Sweeteners Market Import-Export Trade Statistics |
7.1 Philippines Table Top Sweeteners Market Export to Major Countries |
7.2 Philippines Table Top Sweeteners Market Imports from Major Countries |
8 Philippines Table Top Sweeteners Market Key Performance Indicators |
8.1 Consumer awareness level about table top sweeteners |
8.2 Adoption rate of table top sweeteners in food and beverage industry |
8.3 Number of new product launches in the table top sweeteners segment |
8.4 Consumer preferences for specific types of sweeteners |
8.5 Regulatory approvals for new sweetener products |
9 Philippines Table Top Sweeteners Market - Opportunity Assessment |
9.1 Philippines Table Top Sweeteners Market Opportunity Assessment, By Type, 2021 & 2031F |
9.2 Philippines Table Top Sweeteners Market Opportunity Assessment, By Application, 2021 & 2031F |
10 Philippines Table Top Sweeteners Market - Competitive Landscape |
10.1 Philippines Table Top Sweeteners Market Revenue Share, By Companies, 2024 |
10.2 Philippines Table Top Sweeteners Market Competitive Benchmarking, By Operating and Technical Parameters |
11 Company Profiles |
12 Recommendations |
13 Disclaimer |
Global Go To Market Strategy - 2030
Export potential enables firms to identify high-growth global markets with greater confidence by combining advanced trade intelligence with a structured quantitative methodology. The framework analyzes emerging demand trends and country-level import patterns while integrating macroeconomic and trade datasets such as GDP and population forecasts, bilateral import–export flows, tariff structures, elasticity differentials between developed and developing economies, geographic distance, and import demand projections. Using weighted trade values from 2020–2024 as the base period to project country-to-country export potential for 2030, these inputs are operationalized through calculated drivers such as gravity model parameters, tariff impact factors, and projected GDP per-capita growth. Through an analysis of hidden potentials, demand hotspots, and market conditions that are most favorable to success, this method enables firms to focus on target countries, maximize returns, and global expansion with data, backed by accuracy.
By factoring in the projected importer demand gap that is currently unmet and could be potential opportunity, it identifies the potential for the Exporter (Country) among 190 countries, against the general trade analysis, which identifies the biggest importer or exporter.
To discover high-growth global markets and optimize your business strategy:
Click Here
Pricing
- Single User License$ 1,995
- Department License$ 2,400
- Site License$ 3,120
- Global License$ 3,795

Leadership Perspectives from Industry Events
Search
Thought Leadership and Analyst Meet


Our Clients
6WResearch In News
- India Air Conditioner Market Set for Strong Rebound in 2026 After Weather-Led Correction and GST-Driven Recovery: 6Wresearch
- ADAS in India: How Automatic Emergency Braking, Blind Spot Detection & Driver Monitoring are Transforming Road Safety
- Doha a strategic location for EV manufacturing hub: IPA Qatar
- Demand for luxury TVs surging in the GCC, says Samsung
- Empowering Growth: The Thriving Journey of Bangladesh’s Cable Industry
- Demand for luxury TVs surging in the GCC, says Samsung
Latest Reports
- Poland Fire Protection Systems Market (2026-2032)
- Cape Verde Portable Hand-Thrown Extinguisher Market (2026-2032)
- Canada Portable Hand-Thrown Extinguisher Market (2026-2032)
- Cameroon Portable Hand-Thrown Extinguisher Market (2026-2032)
- Burundi Portable Hand-Thrown Extinguisher Market (2026-2032)
- Burkina Faso Portable Hand-Thrown Extinguisher Market (2026-2032)
- Bulgaria Portable Hand-Thrown Extinguisher Market (2026-2032)
- Brunei Portable Hand-Thrown Extinguisher Market (2026-2032)
- Botswana Portable Hand-Thrown Extinguisher Market (2026-2032)
- Bosnia and Herzegovina Portable Hand-Thrown Extinguisher Market (2026-2032)
Industry Events and Analyst Meet

HIMTEX 2026

India Refining Summit 2026

India EV Show 2026

EV tech India Expo 2026

Auto Tech Asia 2026
Whitepaper
- Middle East & Africa Commercial Security Market Click here to view more.
- Middle East & Africa Fire Safety Systems & Equipment Market Click here to view more.
- GCC Drone Market Click here to view more.
- Middle East Lighting Fixture Market Click here to view more.
- GCC Physical & Perimeter Security Market Click here to view more.