Zambia Table Top Sweeteners Market (2025-2031) | Value, Share, Competitive Landscape, Trends, Industry, Analysis, Size & Revenue, Growth, Forecast, Segmentation, Companies, Outlook
Market Forecast By Type (Natural, Artificial), By Application (Dining Room, Family, Others) And Competitive Landscape
| Product Code: ETC10129171 | Publication Date: Sep 2024 | Updated Date: Dec 2025 | Product Type: Market Research Report | |
| Publisher: 6Wresearch | Author: Shubham Deep | No. of Pages: 75 | No. of Figures: 35 | No. of Tables: 20 |
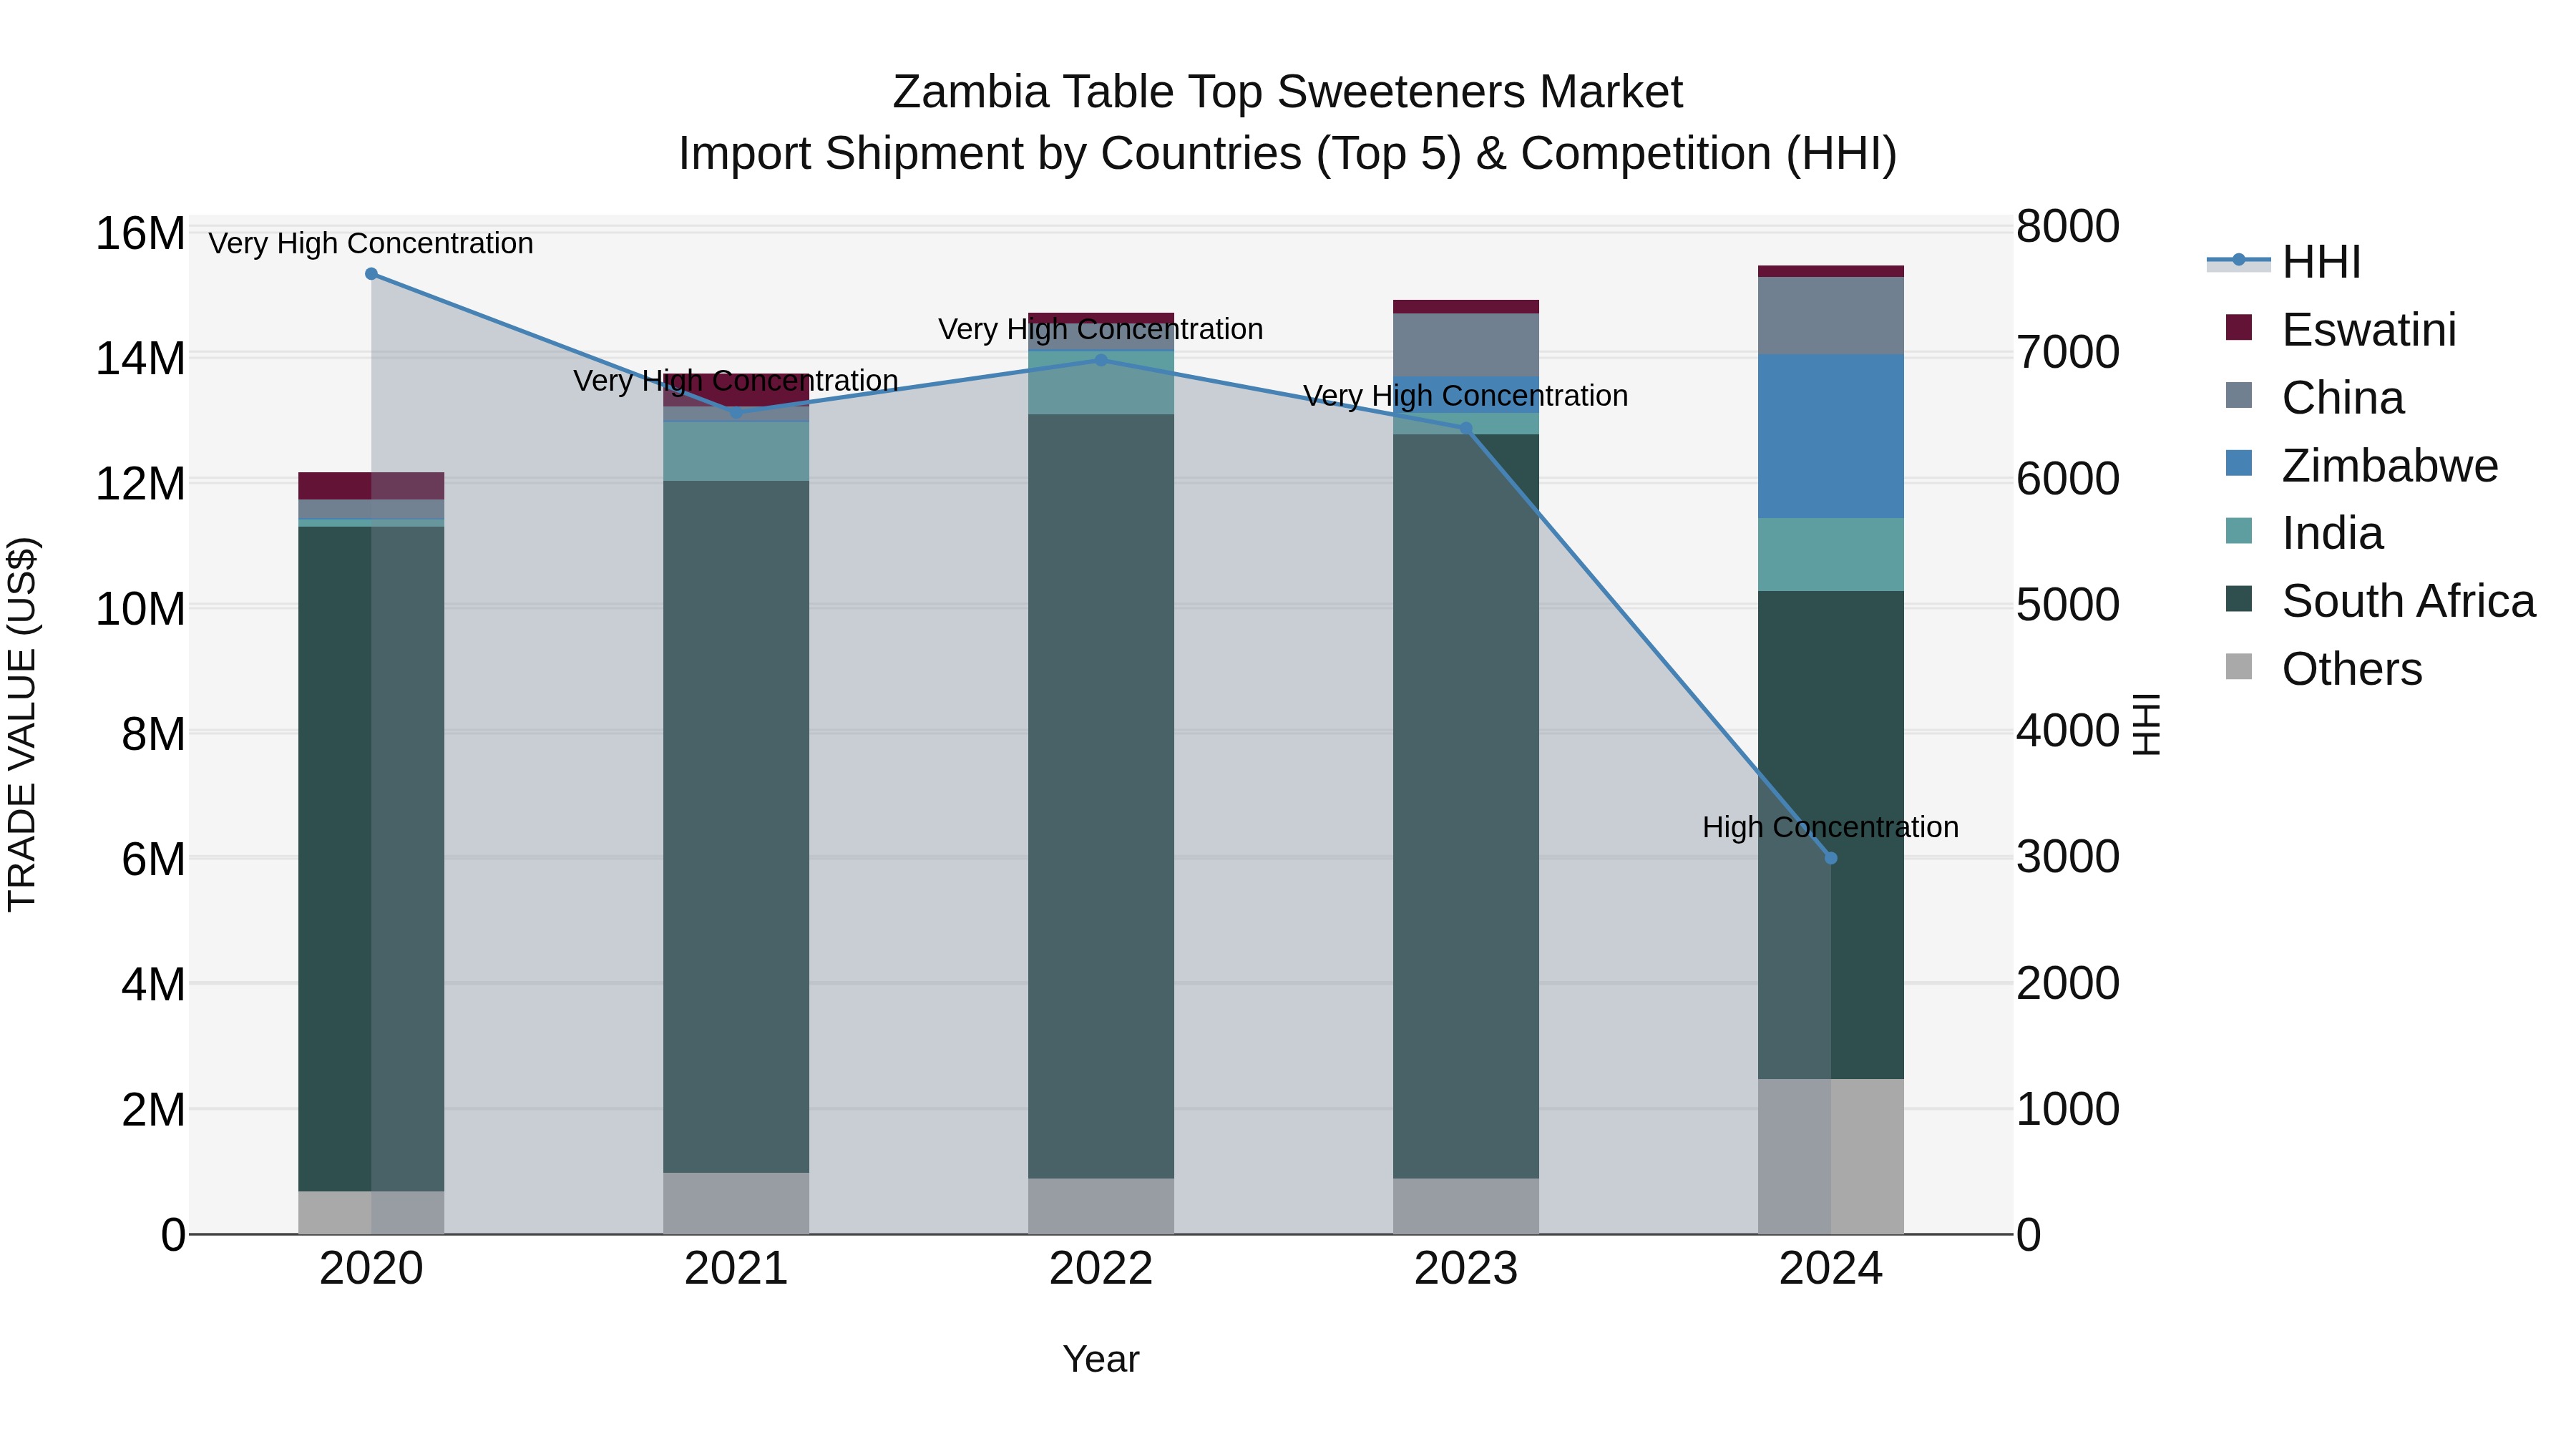
Zambia Table Top Sweeteners Market: Top 5 Importing Countries and Market Competition (HHI) Analysis
Despite a slight decrease in concentration levels, Zambia`s table top sweeteners import market continued to be dominated by top exporters such as South Africa, Zimbabwe, China, India, and Denmark in 2024. The healthy compound annual growth rate of 6.17% from 2020 to 2024 indicates a steady expansion in the market. Additionally, the growth rate of 3.63% from 2023 to 2024 signifies continued progress. This data suggests that the demand for table top sweeteners in Zambia remains robust, with key players maintaining a strong foothold in the market.
Zambia Table Top Sweeteners Market Synopsis
The Zambia Table Top Sweeteners Market is experiencing steady growth driven by increasing health consciousness and the rising prevalence of diabetes and obesity. Consumers are increasingly opting for low-calorie sweeteners as a healthier alternative to sugar. Major players in the market are introducing a variety of sweeteners such as stevia, aspartame, sucralose, and saccharin to cater to different preferences. The market is witnessing a trend towards natural sweeteners as consumers become more aware of the potential health risks associated with artificial sweeteners. Additionally, the growing urban population and changing lifestyles are expected to further drive the demand for table top sweeteners in Zambia. Overall, the market presents opportunities for both local and international sweetener manufacturers to capitalize on the increasing demand for healthier sugar alternatives in the country.
Zambia Table Top Sweeteners Market Trends
The Zambia Table Top Sweeteners Market is experiencing a growing trend towards healthier and low-calorie alternatives to traditional sugar. Consumers are increasingly becoming health-conscious and are seeking products that help them reduce their sugar intake. This trend is driving the demand for table-top sweeteners made from natural ingredients like stevia and monk fruit. There is also a rising awareness about the negative health effects of consuming high amounts of sugar, leading to a shift towards sugar-free options. Opportunities in the market lie in product innovation, such as introducing new flavors and packaging formats to attract consumer interest. Additionally, marketing strategies focused on promoting the health benefits and natural origins of sweeteners can help companies differentiate themselves in the competitive market landscape.
Zambia Table Top Sweeteners Market Challenges
In the Zambia Table Top Sweeteners Market, some of the key challenges include low awareness and understanding of the benefits of using table top sweeteners among consumers, limited distribution channels for these products in remote areas, and the preference for traditional sweetening options such as sugar or honey. Additionally, there is a lack of variety and availability of different types of table top sweeteners in the market, which limits consumer choice and adoption. Regulatory constraints and import restrictions on certain sweeteners may also pose challenges for companies trying to enter or expand in the market. Overcoming these challenges would require targeted marketing campaigns to educate consumers, expanding distribution networks, developing innovative products tailored to local preferences, and navigating regulatory hurdles effectively.
Zambia Table Top Sweeteners Market Investment Opportunities
The Zambia Table Top Sweeteners Market is primarily driven by increasing consumer awareness about health concerns related to sugar consumption, leading to a growing demand for low-calorie and natural sweeteners as alternatives. Health-conscious consumers are seeking products that can help them reduce their sugar intake without compromising on taste, driving the market for table top sweeteners. Additionally, the rising prevalence of lifestyle diseases such as obesity and diabetes is further fueling the demand for sugar substitutes in Zambia. The convenience and portability of table top sweeteners also contribute to their popularity among consumers looking to sweeten their beverages and food on-the-go. Manufacturers are responding to these trends by introducing a variety of innovative sweetener products to cater to the evolving preferences of Zambian consumers.
Zambia Table Top Sweeteners Market Government Polices
The Zambian government does not have specific policies targeting the Table Top Sweeteners market. However, the general regulatory framework for food and beverage products applies to sweeteners as well. The Zambia Bureau of Standards (ZABS) is responsible for ensuring product quality and safety through standards and certification processes. Import regulations and tariffs also impact the market, with the Zambia Revenue Authority (ZRA) overseeing customs procedures. Additionally, the government`s broader trade policies and taxation measures can indirectly influence the competitiveness and availability of Table Top Sweeteners in the Zambian market. Overall, stakeholders in the Table Top Sweeteners industry should stay informed about relevant regulations and engage with government agencies to ensure compliance and market access.
Zambia Table Top Sweeteners Market Future Outlook
The Zambia Table Top Sweeteners Market is expected to witness steady growth in the coming years, driven by increasing health consciousness among consumers and a growing preference for low-calorie sugar alternatives. With rising concerns about the negative health effects of traditional sugar consumption, there is a growing demand for table top sweeteners as a healthier option. Additionally, the expanding food and beverage industry in Zambia is likely to further boost the market as manufacturers incorporate sweeteners into their products to cater to changing consumer preferences. Innovation in product formulations and packaging, along with aggressive marketing strategies, are expected to play a key role in driving the growth of the table top sweeteners market in Zambia. Overall, the market is poised for expansion and offers opportunities for both domestic and international sweetener manufacturers to capitalize on the growing demand.
Key Highlights of the Report:
- Zambia Table Top Sweeteners Market Outlook
- Market Size of Zambia Table Top Sweeteners Market, 2024
- Forecast of Zambia Table Top Sweeteners Market, 2031
- Historical Data and Forecast of Zambia Table Top Sweeteners Revenues & Volume for the Period 2021- 2031
- Zambia Table Top Sweeteners Market Trend Evolution
- Zambia Table Top Sweeteners Market Drivers and Challenges
- Zambia Table Top Sweeteners Price Trends
- Zambia Table Top Sweeteners Porter's Five Forces
- Zambia Table Top Sweeteners Industry Life Cycle
- Historical Data and Forecast of Zambia Table Top Sweeteners Market Revenues & Volume By Type for the Period 2021- 2031
- Historical Data and Forecast of Zambia Table Top Sweeteners Market Revenues & Volume By Natural for the Period 2021- 2031
- Historical Data and Forecast of Zambia Table Top Sweeteners Market Revenues & Volume By Artificial for the Period 2021- 2031
- Historical Data and Forecast of Zambia Table Top Sweeteners Market Revenues & Volume By Application for the Period 2021- 2031
- Historical Data and Forecast of Zambia Table Top Sweeteners Market Revenues & Volume By Dining Room for the Period 2021- 2031
- Historical Data and Forecast of Zambia Table Top Sweeteners Market Revenues & Volume By Family for the Period 2021- 2031
- Historical Data and Forecast of Zambia Table Top Sweeteners Market Revenues & Volume By Others for the Period 2021- 2031
- Zambia Table Top Sweeteners Import Export Trade Statistics
- Market Opportunity Assessment By Type
- Market Opportunity Assessment By Application
- Zambia Table Top Sweeteners Top Companies Market Share
- Zambia Table Top Sweeteners Competitive Benchmarking By Technical and Operational Parameters
- Zambia Table Top Sweeteners Company Profiles
- Zambia Table Top Sweeteners Key Strategic Recommendations
Frequently Asked Questions About the Market Study (FAQs):
6Wresearch actively monitors the Zambia Table Top Sweeteners Market and publishes its comprehensive annual report, highlighting emerging trends, growth drivers, revenue analysis, and forecast outlook. Our insights help businesses to make data-backed strategic decisions with ongoing market dynamics. Our analysts track relevent industries related to the Zambia Table Top Sweeteners Market, allowing our clients with actionable intelligence and reliable forecasts tailored to emerging regional needs.
Yes, we provide customisation as per your requirements. To learn more, feel free to contact us on sales@6wresearch.com
1 Executive Summary |
2 Introduction |
2.1 Key Highlights of the Report |
2.2 Report Description |
2.3 Market Scope & Segmentation |
2.4 Research Methodology |
2.5 Assumptions |
3 Zambia Table Top Sweeteners Market Overview |
3.1 Zambia Country Macro Economic Indicators |
3.2 Zambia Table Top Sweeteners Market Revenues & Volume, 2021 & 2031F |
3.3 Zambia Table Top Sweeteners Market - Industry Life Cycle |
3.4 Zambia Table Top Sweeteners Market - Porter's Five Forces |
3.5 Zambia Table Top Sweeteners Market Revenues & Volume Share, By Type, 2021 & 2031F |
3.6 Zambia Table Top Sweeteners Market Revenues & Volume Share, By Application, 2021 & 2031F |
4 Zambia Table Top Sweeteners Market Dynamics |
4.1 Impact Analysis |
4.2 Market Drivers |
4.2.1 Increasing health consciousness and preference for low-calorie sweeteners. |
4.2.2 Growth in diabetic population requiring sugar alternatives. |
4.2.3 Rising disposable income leading to higher spending on premium table top sweeteners. |
4.3 Market Restraints |
4.3.1 Lack of awareness about table top sweeteners as a sugar substitute. |
4.3.2 Price sensitivity among consumers compared to traditional sugar. |
4.3.3 Limited availability and distribution channels in rural areas. |
5 Zambia Table Top Sweeteners Market Trends |
6 Zambia Table Top Sweeteners Market, By Types |
6.1 Zambia Table Top Sweeteners Market, By Type |
6.1.1 Overview and Analysis |
6.1.2 Zambia Table Top Sweeteners Market Revenues & Volume, By Type, 2021- 2031F |
6.1.3 Zambia Table Top Sweeteners Market Revenues & Volume, By Natural, 2021- 2031F |
6.1.4 Zambia Table Top Sweeteners Market Revenues & Volume, By Artificial, 2021- 2031F |
6.2 Zambia Table Top Sweeteners Market, By Application |
6.2.1 Overview and Analysis |
6.2.2 Zambia Table Top Sweeteners Market Revenues & Volume, By Dining Room, 2021- 2031F |
6.2.3 Zambia Table Top Sweeteners Market Revenues & Volume, By Family, 2021- 2031F |
6.2.4 Zambia Table Top Sweeteners Market Revenues & Volume, By Others, 2021- 2031F |
7 Zambia Table Top Sweeteners Market Import-Export Trade Statistics |
7.1 Zambia Table Top Sweeteners Market Export to Major Countries |
7.2 Zambia Table Top Sweeteners Market Imports from Major Countries |
8 Zambia Table Top Sweeteners Market Key Performance Indicators |
8.1 Consumer awareness levels about table top sweeteners. |
8.2 Number of diabetic patients in Zambia. |
8.3 Growth in per capita income of the population. |
8.4 Percentage of retail stores stocking a variety of table top sweetener brands. |
8.5 Number of marketing campaigns promoting table top sweeteners. |
9 Zambia Table Top Sweeteners Market - Opportunity Assessment |
9.1 Zambia Table Top Sweeteners Market Opportunity Assessment, By Type, 2021 & 2031F |
9.2 Zambia Table Top Sweeteners Market Opportunity Assessment, By Application, 2021 & 2031F |
10 Zambia Table Top Sweeteners Market - Competitive Landscape |
10.1 Zambia Table Top Sweeteners Market Revenue Share, By Companies, 2024 |
10.2 Zambia Table Top Sweeteners Market Competitive Benchmarking, By Operating and Technical Parameters |
11 Company Profiles |
12 Recommendations |
13 Disclaimer |
Export potential assessment - trade Analytics for 2030
Export potential enables firms to identify high-growth global markets with greater confidence by combining advanced trade intelligence with a structured quantitative methodology. The framework analyzes emerging demand trends and country-level import patterns while integrating macroeconomic and trade datasets such as GDP and population forecasts, bilateral import–export flows, tariff structures, elasticity differentials between developed and developing economies, geographic distance, and import demand projections. Using weighted trade values from 2020–2024 as the base period to project country-to-country export potential for 2030, these inputs are operationalized through calculated drivers such as gravity model parameters, tariff impact factors, and projected GDP per-capita growth. Through an analysis of hidden potentials, demand hotspots, and market conditions that are most favorable to success, this method enables firms to focus on target countries, maximize returns, and global expansion with data, backed by accuracy.
By factoring in the projected importer demand gap that is currently unmet and could be potential opportunity, it identifies the potential for the Exporter (Country) among 190 countries, against the general trade analysis, which identifies the biggest importer or exporter.
To discover high-growth global markets and optimize your business strategy:
Click Here
Pricing
- Single User License$ 1,995
- Department License$ 2,400
- Site License$ 3,120
- Global License$ 3,795

Search
Thought Leadership and Analyst Meet


Our Clients
Related Reports
- United Kingdom (UK) Long-term Care Insurance Market (2026-2032) | Growth, Share, Consumer Insights, Drivers, Opportunities, Competition, Pricing Analysis, Segments, Restraints, Companies, Competitive, Value, Outlook, Size, Demand, Analysis, Challenges, Strategic Insights, Investment Trends, Revenue, Trends, Supply, Forecast
- United Kingdom (UK) Long Term Care Market (2026-2032) | Companies, Outlook, Analysis, Trends, Value, Revenue, Segmentation, Share, Forecast, Competitive Landscape, Growth, Size & Forecast
- Iraq Insulation and Waterproofing Market (2026-2032) | Outlook, Drivers, Growth, Size, Share, Industry, Revenue, Trends, Demand, Competitive, Strategic Insights, Opportunities, Segments, Companies, Challenges, Strategy, Consumer Insights, Analysis, Investment Trends, Value, Segmentation, Forecast, Restraints
- India Switchgear Market Outlook (2026 - 2032) | Size, Share, Trends, Growth, Revenue, Forecast, Analysis, Value, Outlook
- Pakistan Contraceptive Implants Market (2025-2031) | Demand, Growth, Size, Share, Industry, Pricing Analysis, Competitive, Strategic Insights, Strategy, Consumer Insights, Analysis, Investment Trends, Opportunities, Revenue, Segments, Value, Segmentation, Supply, Forecast, Restraints, Outlook, Competition, Drivers, Trends, Companies, Challenges
- Sri Lanka Packaging Market (2026-2032) | Outlook, Competition, Drivers, Trends, Demand, Pricing Analysis, Competitive, Strategic Insights, Companies, Challenges, Strategy, Consumer Insights, Analysis, Investment Trends, Opportunities, Growth, Size, Share, Industry, Revenue, Segments, Value, Segmentation, Supply, Forecast, Restraints
- India Kids Watches Market (2026-2032) | Strategy, Consumer Insights, Analysis, Investment Trends, Opportunities, Growth, Size, Share, Industry, Revenue, Segments, Value, Segmentation, Supply, Forecast, Restraints, Outlook, Competition, Drivers, Trends, Demand, Pricing Analysis, Competitive, Strategic Insights, Companies, Challenges
- Saudi Arabia Core Assurance Service Market (2025-2031) | Strategy, Consumer Insights, Analysis, Investment Trends, Opportunities, Growth, Size, Share, Industry, Revenue, Segments, Value, Segmentation, Supply, Forecast, Restraints, Outlook, Competition, Drivers, Trends, Demand, Pricing Analysis, Competitive, Strategic Insights, Companies, Challenges
- Romania Uninterruptible Power Supply (UPS) Market (2026-2032) | Industry, Analysis, Revenue, Size, Forecast, Outlook, Value, Trends, Share, Growth & Companies
- Saudi Arabia Car Window Tinting Film, Paint Protection Film (PPF), and Ceramic Coating Market (2025-2031) | Strategy, Consumer Insights, Analysis, Investment Trends, Opportunities, Growth, Size, Share, Industry, Revenue, Segments, Value, Segmentation, Supply, Forecast, Restraints, Outlook, Competition, Drivers, Trends, Demand, Pricing Analysis, Competitive, Strategic Insights, Companies, Challenges
Industry Events and Analyst Meet

India EV Show 2026

EV tech India Expo 2026

Auto Tech Asia 2026

Battery Tech India 2026

Smart Production Solutions Guangzhou 2026
Whitepaper
- Middle East & Africa Commercial Security Market Click here to view more.
- Middle East & Africa Fire Safety Systems & Equipment Market Click here to view more.
- GCC Drone Market Click here to view more.
- Middle East Lighting Fixture Market Click here to view more.
- GCC Physical & Perimeter Security Market Click here to view more.
6WResearch In News
- Doha a strategic location for EV manufacturing hub: IPA Qatar
- Demand for luxury TVs surging in the GCC, says Samsung
- Empowering Growth: The Thriving Journey of Bangladesh’s Cable Industry
- Demand for luxury TVs surging in the GCC, says Samsung
- Video call with a traditional healer? Once unthinkable, it’s now common in South Africa
- Intelligent Buildings To Smooth GCC’s Path To Net Zero