Poland Filling Equipment Market (2026-2032) | Companies, Growth, Trends, Revenue, Forecast, Share, Size, Analysis, Value, Industry & Outlook
Market Forecast By Type (Rotary Fillers, Volumetric Fillers, Aseptic Fillers, Net Weight Fillers, Other), By Process (Manual, Semi-Automatic, Automatic), By Applications (Food & Beverage, Pharmaceutical, Cosmetic, Others) And Competitive Landscape
| Product Code: ETC047095 | Publication Date: Jan 2021 | Updated Date: Jun 2026 | Product Type: Report | |
| Publisher: 6Wresearch | Author: Shubham Deep | No. of Pages: 70 | No. of Figures: 35 | No. of Tables: 5 |
Poland Filling Equipment Market Size, Share & Growth Rate
The Poland Filling Equipment Market was estimated at USD 1438 Million in 2025 and is projected to reach USD 2092 Million by 2032, growing at a CAGR of 5.5% from 2026 to 2032. This robust trajectory is largely driven by the growing demand for automation across various manufacturing processes, particularly in the food and beverage, pharmaceutical, and cosmetics sectors. As industries increasingly adopt advanced technologies and enhance their production capabilities, the need for efficient and versatile filling equipment has become paramount.
Poland Filling Equipment Market Year-wise Growth Rate and Key Drivers
This graph highlights how the Poland Filling Equipment Market has steadily grown over the years, supported by major growth factors.
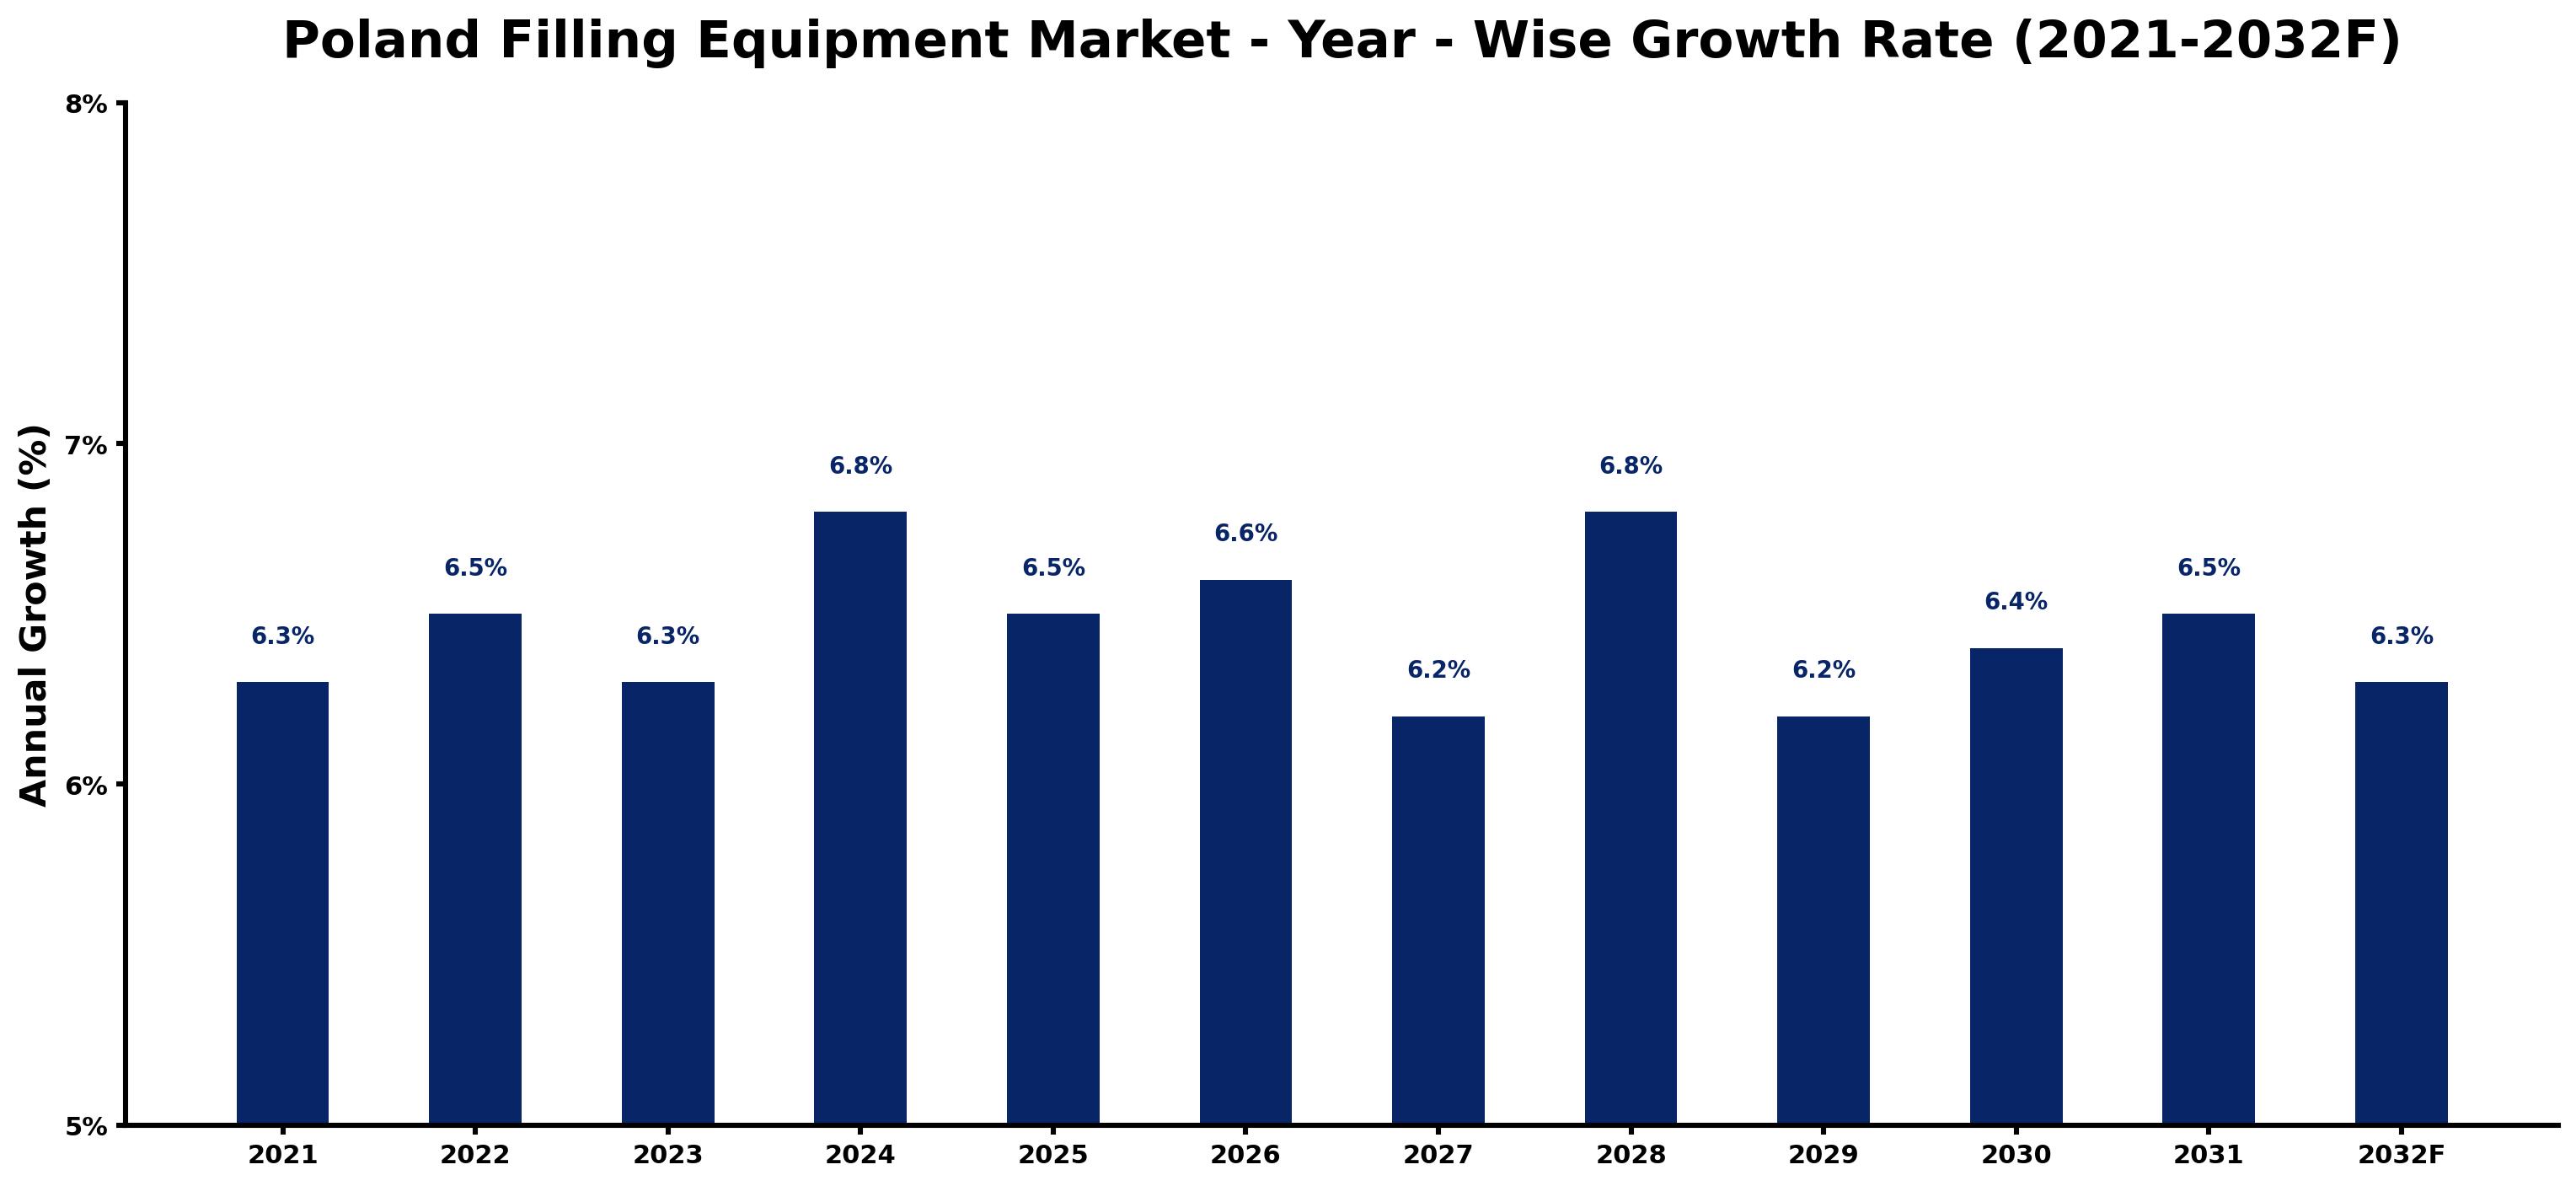
The table below presents the year‑wise growth rates along with the key drivers influencing the market
| Year | Growth Rate | Major Drivers |
| 2021 | 6.3% | Growing urbanization and commercial development |
| 2022 | 6.5% | Expansion of transportation and logistics networks |
| 2023 | 6.3% | Increasing industrial infrastructure investments |
| 2024 | 6.8% | Increasing industrial infrastructure investments |
| 2025 | 6.5% | Expansion of commercial construction activities |
| 2026 | 6.6% | Expansion of commercial construction activities |
| 2027 | 6.2% | Government infrastructure modernization initiatives |
| 2028 | 6.8% | Growing renewable energy integration projects |
| 2029 | 6.2% | Increasing adoption of advanced technologies |
| 2030 | 6.4% | Increasing industrial infrastructure investments |
| 2031 | 6.5% | Expansion of transportation and logistics networks |
| 2032 | 6.3% | Expansion of manufacturing activities |
Note - Market size estimations and growth projections presented in this report are based on 6Wresearch’s advanced forecasting approach, validated with industry datasets as of June 2026.
Poland Filling Equipment Market Synopsis
The most significant force shaping the Poland Filling Equipment Market today is the rapid advancement in automation technologies. This trend not only boosts operational efficiency but also supports industries in meeting stringent quality and safety regulations.
Furthermore, manufacturers are increasingly focusing on sustainability, opting for eco-friendly filling solutions that align with contemporary environmental standards. This dual emphasis on automation and sustainability is set to redefine how filling processes are managed across various sectors.
Poland Filling Equipment Market Key Takeaways
- The market is witnessing strong growth driven by automation and regulatory compliance.
- Increased demand for versatile filling equipment that accommodates a range of products.
- Sustainability considerations are pushing manufacturers toward eco-friendly solutions.
- The integration of IoT and data analytics is enhancing operational efficiency.
- Government incentives are promoting modernization in the filling equipment sector.
Evaluation of Restraints in Poland Filling Equipment Market
Despite the positive outlook, the Poland Filling Equipment Market faces several restraints. Intense competition among manufacturers forces companies to continually innovate while managing costs. Additionally, fluctuating raw material prices pose a challenge to maintaining competitive pricing without sacrificing quality. Compliance with evolving regulatory requirements, particularly in food safety and product quality, further complicates the landscape for manufacturers. Companies must therefore remain agile, consistently adapting to these pressures to sustain growth.
Poland Filling Equipment Market Trends
Current trends indicate a significant shift toward automated filling systems, driven by the need for efficiency and cost reduction. Manufacturers are increasingly investing in equipment capable of handling diverse product types, including liquids, powders, and granules. Moreover, there is a notable rise in the use of sustainability-driven innovations that reduce waste and energy consumption, positioning eco-friendly solutions at the forefront of industry priorities.
The ongoing integration of Industry 4.0 technologies, such as IoT and AI, enables real-time monitoring and predictive maintenance of filling equipment, further revolutionizing operations. This shift towards smart manufacturing solutions illustrates a clear trend towards optimizing productivity and process reliability.
Poland Filling Equipment Market Opportunities
The market presents substantial investment opportunities, particularly as industries seek to enhance their production capabilities through advanced filling technologies. Aseptic filling, volumetric filling, and net weight filling systems are gaining traction, catering to a diverse range of applications. The Polish government's initiatives supporting modernization efforts provide an additional layer of attractiveness for investors looking to capitalize on the evolving landscape. As sustainability continues to be prioritized, innovative filling equipment that minimizes environmental impact will be especially appealing to manufacturers.
Government Initiatives in the Poland Filling Equipment Market
Poland’s government is actively promoting the filling equipment market through various incentives aimed at encouraging the adoption of modern and energy-efficient solutions. Compliance with EU regulations, including CE marking for machinery safety, remains a critical focus, ensuring that manufacturers uphold high standards of product quality and safety. These government policies not only facilitate growth but also align with broader objectives of innovation and sustainability within the manufacturing sector.
Future Insights of the Poland Filling Equipment Market
Looking ahead to 2026-2032, the Poland Filling Equipment Market is expected to continue its upward trajectory driven by advancements in automation and increasing demands for efficiency. The ongoing emphasis on sustainability and eco-friendly solutions will likely dictate future innovations in filling technologies. As industries evolve, the market will increasingly cater to the need for reliable, high-capacity equipment that supports the complexities of modern manufacturing processes.
Poland Filling Equipment Market Latest Developments (May 2025 - June 2026)
Recent developments indicate a strong industry shift towards smart manufacturing practices, with several companies launching initiatives aimed at integrating IoT capabilities into their filling equipment. Concurrently, advancements in eco-friendly technologies are leading to the introduction of new machinery that prioritizes energy efficiency and waste reduction. The evolving landscape demonstrates a commitment from manufacturers to adapt to changing consumer preferences and regulatory demands.
Poland Filling Equipment Market - Key Attractiveness of the Report
- 10 Years of Market Numbers
- Historical Data Starting from 2022 to 2025
- Base Year: 2025
- Forecast Data until 2032
- Key Performance Indicators Impacting the Market
- Major Upcoming Developments and Projects
Key Highlights of the Report:
- Poland Filling Equipment Market Outlook
- Market Size of Poland Filling Equipment Market, 2025
- Forecast of Poland Filling Equipment Market, 2032
- Historical Data and Forecast of Poland Filling Equipment Revenues & Volume for the Period 2022-2032F
- Poland Filling Equipment Market Trend Evolution
- Poland Filling Equipment Market Drivers and Challenges
- Poland Filling Equipment Price Trends
- Poland Filling Equipment Porter's Five Forces
- Poland Filling Equipment Industry Life Cycle
- Historical Data and Forecast of Poland Filling Equipment Market Revenues & Volume By Type for the Period 2022-2032F
- Historical Data and Forecast of Poland Filling Equipment Market Revenues & Volume By Rotary Fillers for the Period 2022-2032F
- Historical Data and Forecast of Poland Filling Equipment Market Revenues & Volume By Volumetric Fillers for the Period 2022-2032F
- Historical Data and Forecast of Poland Filling Equipment Market Revenues & Volume By Aseptic Fillers for the Period 2022-2032F
- Historical Data and Forecast of Poland Filling Equipment Market Revenues & Volume By Net Weight Fillers for the Period 2022-2032F
- Historical Data and Forecast of Poland Filling Equipment Market Revenues & Volume By Other for the Period 2022-2032F
- Historical Data and Forecast of Poland Filling Equipment Market Revenues & Volume By Process for the Period 2022-2032F
- Historical Data and Forecast of Poland Filling Equipment Market Revenues & Volume By Manual for the Period 2022-2032F
- Historical Data and Forecast of Poland Filling Equipment Market Revenues & Volume By Semi-Automatic for the Period 2022-2032F
- Historical Data and Forecast of Poland Filling Equipment Market Revenues & Volume By Automatic for the Period 2022-2032F
- Historical Data and Forecast of Poland Filling Equipment Market Revenues & Volume By Applications for the Period 2022-2032F
- Historical Data and Forecast of Poland Filling Equipment Market Revenues & Volume By Food & Beverage for the Period 2022-2032F
- Historical Data and Forecast of Poland Filling Equipment Market Revenues & Volume By Pharmaceutical for the Period 2022-2032F
- Historical Data and Forecast of Poland Filling Equipment Market Revenues & Volume By Cosmetic for the Period 2022-2032F
- Historical Data and Forecast of Poland Filling Equipment Market Revenues & Volume By Others for the Period 2022-2032F
- Poland Filling Equipment Import Export Trade Statistics
- Market Opportunity Assessment By Type
- Market Opportunity Assessment By Process
- Market Opportunity Assessment By Applications
- Poland Filling Equipment Top Companies Market Share
- Poland Filling Equipment Competitive Benchmarking By Technical and Operational Parameters
- Poland Filling Equipment Company Profiles
- Poland Filling Equipment Key Strategic Recommendations
Poland Filling Equipment Market - Frequently Asked Questions
The market is projected to grow at a CAGR of 5.5% from 2026 to 2032, moving from USD 1438 Million in 2025 to USD 2092 Million by 2032.
The food and beverage, pharmaceutical, and cosmetics industries are the primary sectors propelling demand, as these industries prioritize automation and efficiency in their production lines.
Sustainability is shaping market trends, with manufacturers increasingly seeking eco-friendly filling equipment that reduces waste and energy consumption, catering to both consumer preferences and regulatory expectations.
Government initiatives, such as incentives for adopting energy-efficient technologies and compliance with EU regulations, significantly influence the market by promoting innovation and ensuring safety standards.
Automation is crucial, as it enhances operational efficiency, reduces labor costs, and meets the stringent quality standards demanded by today’s manufacturers.
The integration of IoT and AI technologies for real-time monitoring and predictive maintenance is a significant trend, enhancing the reliability and productivity of filling systems.
6Wresearch actively monitors the Poland Filling Equipment Market and publishes its comprehensive annual report, highlighting emerging trends, growth drivers, revenue analysis, and forecast outlook. Our insights help businesses to make data-backed strategic decisions with ongoing market dynamics. Our analysts track relevent industries related to the Poland Filling Equipment Market, allowing our clients with actionable intelligence and reliable forecasts tailored to emerging regional needs.
Yes, we provide customisation as per your requirements. To learn more, feel free to contact us on sales@6wresearch.com
1 Executive Summary |
2 Introduction |
2.1 Key Highlights of the Report |
2.2 Report Description |
2.3 Market Scope & Segmentation |
2.4 Research Methodology |
2.5 Assumptions |
3 Poland Filling Equipment Market Overview |
3.1 Poland Country Macro Economic Indicators |
3.2 Poland Filling Equipment Market Revenues & Volume, 2022 & 2032F |
3.3 Poland Filling Equipment Market - Industry Life Cycle |
3.4 Poland Filling Equipment Market - Porter's Five Forces |
3.5 Poland Filling Equipment Market Revenues & Volume Share, By Type, 2022 & 2032F |
3.6 Poland Filling Equipment Market Revenues & Volume Share, By Process, 2022 & 2032F |
3.7 Poland Filling Equipment Market Revenues & Volume Share, By Applications, 2022 & 2032F |
4 Poland Filling Equipment Market Dynamics |
4.1 Impact Analysis |
4.2 Market Drivers |
4.3 Market Restraints |
5 Poland Filling Equipment Market Trends |
6 Poland Filling Equipment Market, By Types |
6.1 Poland Filling Equipment Market, By Type |
6.1.1 Overview and Analysis |
6.1.2 Poland Filling Equipment Market Revenues & Volume, By Type, 2022-2032F |
6.1.3 Poland Filling Equipment Market Revenues & Volume, By Rotary Fillers, 2022-2032F |
6.1.4 Poland Filling Equipment Market Revenues & Volume, By Volumetric Fillers, 2022-2032F |
6.1.5 Poland Filling Equipment Market Revenues & Volume, By Aseptic Fillers, 2022-2032F |
6.1.6 Poland Filling Equipment Market Revenues & Volume, By Net Weight Fillers, 2022-2032F |
6.1.7 Poland Filling Equipment Market Revenues & Volume, By Other, 2022-2032F |
6.2 Poland Filling Equipment Market, By Process |
6.2.1 Overview and Analysis |
6.2.2 Poland Filling Equipment Market Revenues & Volume, By Manual, 2022-2032F |
6.2.3 Poland Filling Equipment Market Revenues & Volume, By Semi-Automatic, 2022-2032F |
6.2.4 Poland Filling Equipment Market Revenues & Volume, By Automatic, 2022-2032F |
6.3 Poland Filling Equipment Market, By Applications |
6.3.1 Overview and Analysis |
6.3.2 Poland Filling Equipment Market Revenues & Volume, By Food & Beverage, 2022-2032F |
6.3.3 Poland Filling Equipment Market Revenues & Volume, By Pharmaceutical, 2022-2032F |
6.3.4 Poland Filling Equipment Market Revenues & Volume, By Cosmetic, 2022-2032F |
6.3.5 Poland Filling Equipment Market Revenues & Volume, By Others, 2022-2032F |
7 Poland Filling Equipment Market Import-Export Trade Statistics |
7.1 Poland Filling Equipment Market Export to Major Countries |
7.2 Poland Filling Equipment Market Imports from Major Countries |
8 Poland Filling Equipment Market Key Performance Indicators |
9 Poland Filling Equipment Market - Opportunity Assessment |
9.1 Poland Filling Equipment Market Opportunity Assessment, By Type, 2022 & 2032F |
9.2 Poland Filling Equipment Market Opportunity Assessment, By Process, 2022 & 2032F |
9.3 Poland Filling Equipment Market Opportunity Assessment, By Applications, 2022 & 2032F |
10 Poland Filling Equipment Market - Competitive Landscape |
10.1 Poland Filling Equipment Market Revenue Share, By Companies, 2025 |
10.2 Poland Filling Equipment Market Competitive Benchmarking, By Operating and Technical Parameters |
11 Company Profiles |
12 Recommendations |
13 Disclaimer |
Global Go To Market Strategy - 2030
Export potential enables firms to identify high-growth global markets with greater confidence by combining advanced trade intelligence with a structured quantitative methodology. The framework analyzes emerging demand trends and country-level import patterns while integrating macroeconomic and trade datasets such as GDP and population forecasts, bilateral import–export flows, tariff structures, elasticity differentials between developed and developing economies, geographic distance, and import demand projections. Using weighted trade values from 2020–2024 as the base period to project country-to-country export potential for 2030, these inputs are operationalized through calculated drivers such as gravity model parameters, tariff impact factors, and projected GDP per-capita growth. Through an analysis of hidden potentials, demand hotspots, and market conditions that are most favorable to success, this method enables firms to focus on target countries, maximize returns, and global expansion with data, backed by accuracy.
By factoring in the projected importer demand gap that is currently unmet and could be potential opportunity, it identifies the potential for the Exporter (Country) among 190 countries, against the general trade analysis, which identifies the biggest importer or exporter.
To discover high-growth global markets and optimize your business strategy:
Click Here
Pricing
- Single User License$ 1,995
- Department License$ 2,400
- Site License$ 3,120
- Global License$ 3,795

Leadership Perspectives from Industry Events
Search
Thought Leadership and Analyst Meet


Our Clients
6WResearch In News
- India Air Conditioner Market Set for Strong Rebound in 2026 After Weather-Led Correction and GST-Driven Recovery: 6Wresearch
- ADAS in India: How Automatic Emergency Braking, Blind Spot Detection & Driver Monitoring are Transforming Road Safety
- Doha a strategic location for EV manufacturing hub: IPA Qatar
- Demand for luxury TVs surging in the GCC, says Samsung
- Empowering Growth: The Thriving Journey of Bangladesh’s Cable Industry
- Demand for luxury TVs surging in the GCC, says Samsung
Latest Reports
- Nicaragua RPG Gaming Market (2026-2032)
- New Zealand RPG Gaming Market (2026-2032)
- Netherlands RPG Gaming Market (2026-2032)
- Nauru RPG Gaming Market (2026-2032)
- Namibia RPG Gaming Market (2026-2032)
- Mozambique RPG Gaming Market (2026-2032)
- Montenegro RPG Gaming Market (2026-2032)
- Mongolia RPG Gaming Market (2026-2032)
- Monaco RPG Gaming Market (2026-2032)
- Micronesia RPG Gaming Market (2026-2032)
Industry Events and Analyst Meet

EV India Expo 2026

HIMTEX 2026

India Refining Summit 2026

India EV Show 2026

EV tech India Expo 2026
Whitepaper
- Middle East & Africa Commercial Security Market Click here to view more.
- Middle East & Africa Fire Safety Systems & Equipment Market Click here to view more.
- GCC Drone Market Click here to view more.
- Middle East Lighting Fixture Market Click here to view more.
- GCC Physical & Perimeter Security Market Click here to view more.