Poland industrial vehicles Market (2026-2032) | Forecast, Size, Industry, Analysis, Revenue, Value, Outlook, Share, Growth, Trends & Companies
Market Forecast By Product Type (Forklift, Aisle Truck, Tow Tractor, Container Handler), By Drive Type (Internal Combustion Engine, Battery-Operated, Gas-Powered), By Application (Industrial , Cargo) And Competitive Landscape
| Product Code: ETC029735 | Publication Date: Oct 2020 | Updated Date: Jun 2026 | Product Type: Report | |
| Publisher: 6Wresearch | Author: Ravi Bhandari | No. of Pages: 70 | No. of Figures: 35 | No. of Tables: 5 |
Poland industrial vehicles Market Summary
The poland industrial vehicles market was estimated at USD 228 Million in 2025 and is projected to reach USD 249 Million by 2032, growing at a CAGR of 0.9% from 2026 to 2032.
Poland industrial vehicles Market Growth Rate Analysis (2021-2032)
The Poland industrial vehicles market has exhibited a dynamic performance in recent years, evidencing a notable rebound with growth rates of 5.2% in 2022 and 5.3% in 2023 following a decline of 3.2% in 2021. This resurgence can be attributed to increased investments in infrastructure and a strengthening demand driven by the energy transition and technological advancements. While growth is projected to stabilize at modest rates, with a sharp deceleration to near-zero in 2024, longer-term forecasts suggest gradual recovery, notably rising to 2.4% by 2029. Consumer demand remains a key driver, particularly as digitalization and sustainability initiatives progress, positioning the market for sustainable development amidst evolving industrial needs.
Poland industrial vehicles Market Year-wise Growth Rate and Key Drivers
This graph highlights how the Poland industrial vehicles Market has steadily grown over the past five years, supported by major growth factors.
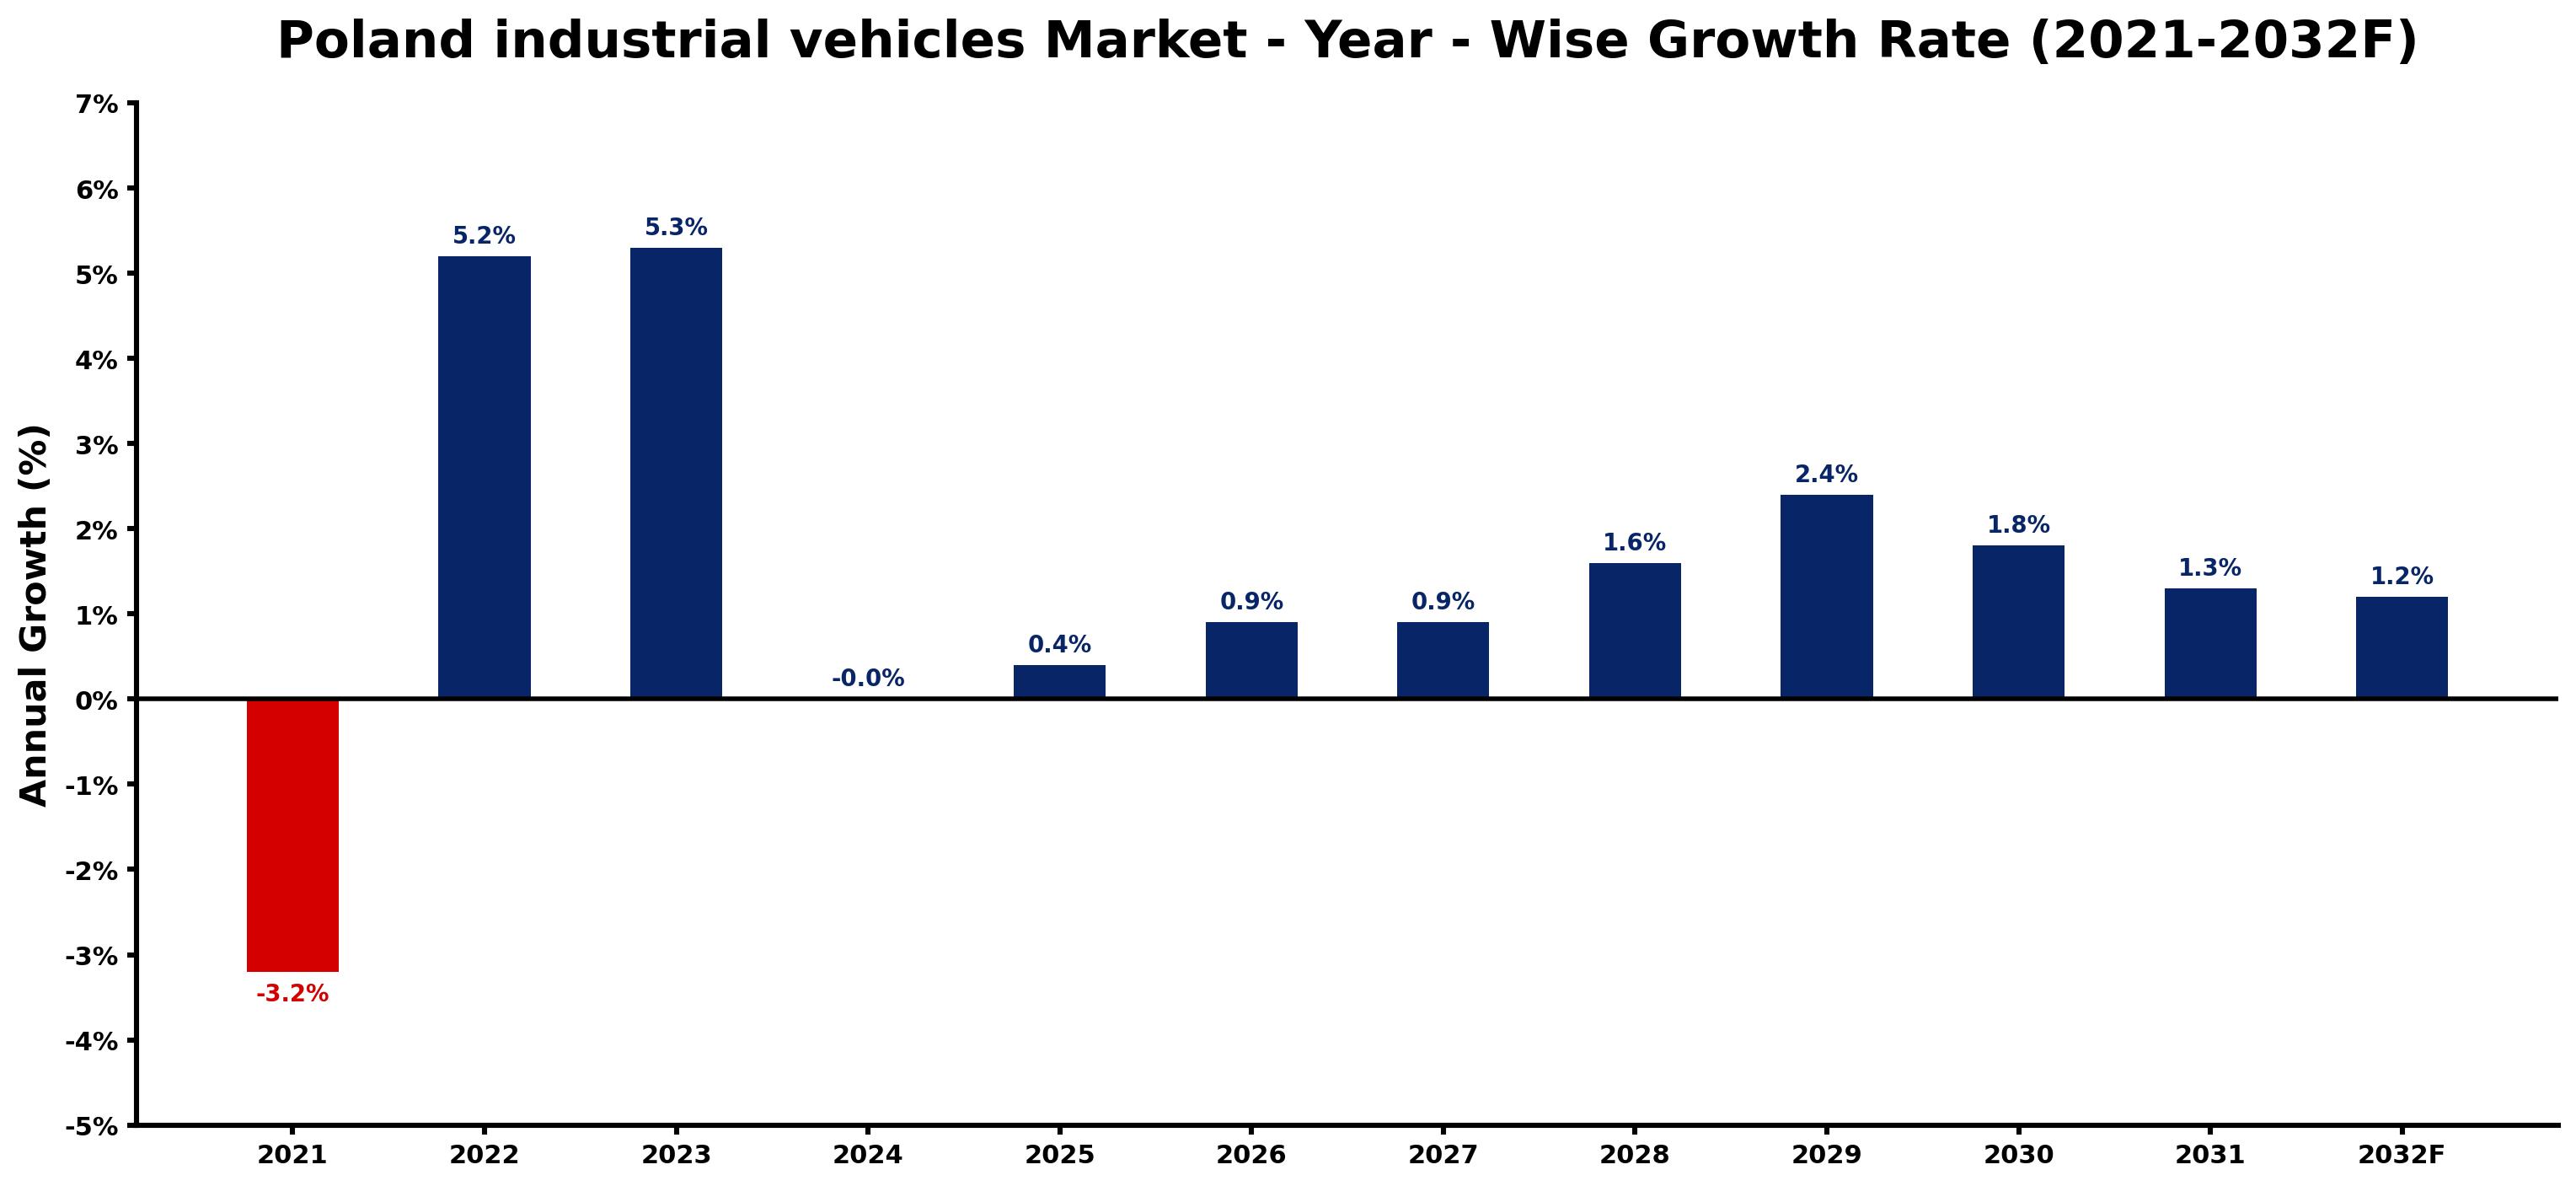
The table below presents the year wise growth rates along with the key drivers influencing the market
| Year | Growth Rate | Major Drivers |
| 2021 | -3.2% | Supply chain disruptions caused severe shortages of key components, hindering vehicle production and sales. |
| 2022 | 5.2% | Investments in renewable energy projects boost demand for specialized industrial vehicles. |
| 2023 | 5.3% | Technological upgrades in logistics create a need for advanced industrial vehicle solutions. |
| 2024 | -0.0% | The construction sector experiences expansion, requiring more heavy-duty industrial vehicles. |
| 2025 | 0.4% | E-commerce growth prompts logistics firms to invest in modern industrial vehicle fleets. |
| 2026 | 0.9% | Digital transformation across industries necessitates innovative industrial vehicle technologies. |
| 2027 | 0.9% | Poland's increasing manufacturing capacity drives demand for efficient industrial transport solutions. |
| 2028 | 1.6% | Modern infrastructure projects stimulate significant investment in robust industrial vehicle fleets. |
| 2029 | 2.4% | Sustainability trends encourage companies to opt for eco-friendly industrial vehicles. |
| 2030 | 1.8% | The rise of smart logistics integrates advanced vehicle technologies into supply chains. |
| 2031 | 1.3% | Urbanization trends necessitate compact industrial vehicles for efficient city operations. |
| 2032 | 1.2% | Mature industrial sectors push for automation, increasing demand for specialized vehicles. |
Note - Market size estimations and growth projections presented in this report are based on 6Wresearch's advanced forecasting approach, validated with industry datasets as of June 2026.
Poland industrial vehicles Market Synopsis
The Poland industrial vehicles Market is projected to reach 0.9% and witness significant growth during the forecast period (2026-2032). The demand for specialized vehicles in sectors such as construction, logistics, and manufacturing is driving this expansion. Industrial vehicles primarily consist of forklifts, cranes, utility vehicles, and automated guided vehicles, each tailored for heavy-duty operations.
Poland industrial vehicles Market Growth Drivers
Several factors are propelling growth in the Poland industrial vehicles Market. The increasing industrial activities across various sectors create a robust demand for vehicles designed for efficient material handling and transportation. Additionally, the following drivers are noteworthy:
- Technological advancements in vehicle design and functionality have led to more efficient and reliable industrial vehicles.
- The growing emphasis on automation and robotics within manufacturing processes is increasing the demand for automated guided vehicles.
- Sustainability has become a priority; manufacturers are investing in eco-friendly and energy-efficient vehicles, meeting regulatory standards.
- The logistics sector, needing to enhance supply chain efficiency, is increasingly adopting modern industrial vehicles to streamline operations.
- With urbanization on the rise, construction activities are booming, spurring demand for cranes and lifting equipment.
Poland industrial vehicles Market Challenges and Restraints
Despite its potential, the Poland industrial vehicles Market faces several challenges that could hinder its progress. These include:
- Rapid technological changes necessitate continual investment in research and development, which can strain financial resources for manufacturers.
- Regulatory compliance regarding safety and environmental standards is essential, requiring manufacturers to adapt quickly to changing policies.
- Cost management is a significant issue, as rising production costs can impact pricing strategies and profit margins.
- The competitive landscape is intensifying, with many players attempting to differentiate themselves through advanced features and reliability.
- Market saturation in certain segments can limit growth opportunities and necessitate more innovative solutions to capture market interest.
Poland industrial vehicles Market Government Investment and Initiatives
Government policy plays a critical role in shaping the Poland industrial vehicles Market. Regulatory bodies are increasingly focusing on safety, efficiency, and environmental considerations in vehicle operations and manufacturing. Key initiatives include:
- The government actively promotes investments in advanced technologies, providing financial incentives for manufacturers aiming to enhance operational efficiency.
- Public spending on infrastructure projects enhances the demand for industrial vehicles, particularly in construction and logistics.
- Policies that enforce stringent emissions standards encourage sustainable practices and the development of eco-friendly vehicles.
- Support for research and development initiatives allows local manufacturers to innovate and remain competitive on an international scale.
- Collaborations between government entities and industry stakeholders foster an environment conducive to growth and technological advancement.
Poland industrial vehicles Market Latest Developments (May 2025 - June 2026)
Recent trends and developments in the Poland industrial vehicles Market reveal significant shifts in technology and operational practices. Over the period from May 2025 to June 2026, the following developments have been observed:
- Increased investment in electric and hybrid industrial vehicles, aligning with global sustainability trends.
- The integration of advanced telematics and IoT solutions in industrial vehicles to improve efficiency and monitor performance.
- A rise in collaborative robotics within manufacturing settings, leading to enhanced operational efficiency and safety.
- Shifts in consumer preferences toward automated solutions, influencing manufacturers to adapt their product offerings.
- Regulatory updates surrounding safety standards have prompted manufacturers to enhance safety features in their vehicles.
Poland industrial vehicles Market - Key Attractiveness of the Report
- 10 Years of Market Numbers
- Historical Data Starting from 2022 to 2025
- Base Year: 2025
- Forecast Data until 2032
- Key Performance Indicators Impacting the Market
- Major Upcoming Developments and Projects
Key Highlights of the Report:
- Poland industrial vehicles Market Outlook
- Market Size of Poland industrial vehicles Market, 2025
- Forecast of Poland industrial vehicles Market, 2032
- Historical Data and Forecast of Poland industrial vehicles Revenues & Volume for the Period 2022-2032F
- Poland industrial vehicles Market Trend Evolution
- Poland industrial vehicles Market Drivers and Challenges
- Poland industrial vehicles Price Trends
- Poland industrial vehicles Porter's Five Forces
- Poland industrial vehicles Industry Life Cycle
- Historical Data and Forecast of Poland industrial vehicles Market Revenues & Volume By Product Type for the Period 2022-2032F
- Historical Data and Forecast of Poland industrial vehicles Market Revenues & Volume By Forklift for the Period 2022-2032F
- Historical Data and Forecast of Poland industrial vehicles Market Revenues & Volume By Aisle Truck for the Period 2022-2032F
- Historical Data and Forecast of Poland industrial vehicles Market Revenues & Volume By Tow Tractor for the Period 2022-2032F
- Historical Data and Forecast of Poland industrial vehicles Market Revenues & Volume By Container Handler for the Period 2022-2032F
- Historical Data and Forecast of Poland industrial vehicles Market Revenues & Volume By Drive Type for the Period 2022-2032F
- Historical Data and Forecast of Poland industrial vehicles Market Revenues & Volume By Internal Combustion Engine for the Period 2022-2032F
- Historical Data and Forecast of Poland industrial vehicles Market Revenues & Volume By Battery-Operated for the Period 2022-2032F
- Historical Data and Forecast of Poland industrial vehicles Market Revenues & Volume By Gas-Powered for the Period 2022-2032F
- Historical Data and Forecast of Poland industrial vehicles Market Revenues & Volume By Application for the Period 2022-2032F
- Historical Data and Forecast of Poland industrial vehicles Market Revenues & Volume By Industrial for the Period 2022-2032F
- Historical Data and Forecast of Poland industrial vehicles Market Revenues & Volume By Cargo for the Period 2022-2032F
- Poland industrial vehicles Import Export Trade Statistics
- Market Opportunity Assessment By Product Type
- Market Opportunity Assessment By Drive Type
- Market Opportunity Assessment By Application
- Poland industrial vehicles Top Companies Market Share
- Poland industrial vehicles Competitive Benchmarking By Technical and Operational Parameters
- Poland industrial vehicles Company Profiles
- Poland industrial vehicles Key Strategic Recommendations
Frequently Asked Questions About the Market Study (FAQs):
The growth is driven by increasing industrial activities, advancements in technology, and a shift towards automation in operations.
Major challenges include maintaining regulatory compliance, managing production costs, and competitive differentiation.
The government is promoting investment in advanced technologies and offering incentives for manufacturers to enhance their production practices.
Trends include increased adoption of electric vehicles, integration of IoT technologies, and a growing focus on safety compliance.
6Wresearch actively monitors the Poland industrial vehicles Market and publishes its comprehensive annual report, highlighting emerging trends, growth drivers, revenue analysis, and forecast outlook. Our insights help businesses to make data-backed strategic decisions with ongoing market dynamics. Our analysts track relevent industries related to the Poland industrial vehicles Market, allowing our clients with actionable intelligence and reliable forecasts tailored to emerging regional needs.
Yes, we provide customisation as per your requirements. To learn more, feel free to contact us on sales@6wresearch.com
1 Executive Summary |
2 Introduction |
2.1 Key Highlights of the Report |
2.2 Report Description |
2.3 Market Scope & Segmentation |
2.4 Research Methodology |
2.5 Assumptions |
3 Poland industrial vehicles Market Overview |
3.1 Poland Country Macro Economic Indicators |
3.2 Poland industrial vehicles Market Revenues & Volume, 2022 & 2032F |
3.3 Poland industrial vehicles Market - Industry Life Cycle |
3.4 Poland industrial vehicles Market - Porter's Five Forces |
3.5 Poland industrial vehicles Market Revenues & Volume Share, By Product Type, 2022 & 2032F |
3.6 Poland industrial vehicles Market Revenues & Volume Share, By Drive Type, 2022 & 2032F |
3.7 Poland industrial vehicles Market Revenues & Volume Share, By Application, 2022 & 2032F |
4 Poland industrial vehicles Market Dynamics |
4.1 Impact Analysis |
4.2 Market Drivers |
4.2.1 Increasing demand for automation and efficiency in manufacturing processes |
4.2.2 Growth in e-commerce and logistics sectors driving the need for industrial vehicles |
4.2.3 Government initiatives and investments in infrastructure development |
4.3 Market Restraints |
4.3.1 High initial investment costs for industrial vehicles |
4.3.2 Fluctuating raw material prices impacting manufacturing costs |
4.3.3 Regulatory challenges and compliance requirements |
5 Poland industrial vehicles Market Trends |
6 Poland industrial vehicles Market, By Types |
6.1 Poland industrial vehicles Market, By Product Type |
6.1.1 Overview and Analysis |
6.1.2 Poland industrial vehicles Market Revenues & Volume, By Product Type, 2022-2032F |
6.1.3 Poland industrial vehicles Market Revenues & Volume, By Forklift, 2022-2032F |
6.1.4 Poland industrial vehicles Market Revenues & Volume, By Aisle Truck, 2022-2032F |
6.1.5 Poland industrial vehicles Market Revenues & Volume, By Tow Tractor, 2022-2032F |
6.1.6 Poland industrial vehicles Market Revenues & Volume, By Container Handler, 2022-2032F |
6.2 Poland industrial vehicles Market, By Drive Type |
6.2.1 Overview and Analysis |
6.2.2 Poland industrial vehicles Market Revenues & Volume, By Internal Combustion Engine, 2022-2032F |
6.2.3 Poland industrial vehicles Market Revenues & Volume, By Battery-Operated, 2022-2032F |
6.2.4 Poland industrial vehicles Market Revenues & Volume, By Gas-Powered, 2022-2032F |
6.3 Poland industrial vehicles Market, By Application |
6.3.1 Overview and Analysis |
6.3.2 Poland industrial vehicles Market Revenues & Volume, By Industrial , 2022-2032F |
6.3.3 Poland industrial vehicles Market Revenues & Volume, By Cargo, 2022-2032F |
7 Poland industrial vehicles Market Import-Export Trade Statistics |
7.1 Poland industrial vehicles Market Export to Major Countries |
7.2 Poland industrial vehicles Market Imports from Major Countries |
8 Poland industrial vehicles Market Key Performance Indicators |
8.1 Average fleet utilization rate |
8.2 Maintenance cost per vehicle |
8.3 Average age of the industrial vehicle fleet |
8.4 Number of accidents/incidents involving industrial vehicles |
8.5 Adoption rate of electric or alternative fuel industrial vehicles |
9 Poland industrial vehicles Market - Opportunity Assessment |
9.1 Poland industrial vehicles Market Opportunity Assessment, By Product Type, 2022 & 2032F |
9.2 Poland industrial vehicles Market Opportunity Assessment, By Drive Type, 2022 & 2032F |
9.3 Poland industrial vehicles Market Opportunity Assessment, By Application, 2022 & 2032F |
10 Poland industrial vehicles Market - Competitive Landscape |
10.1 Poland industrial vehicles Market Revenue Share, By Companies, 2025 |
10.2 Poland industrial vehicles Market Competitive Benchmarking, By Operating and Technical Parameters |
11 Company Profiles |
12 Recommendations |
13 Disclaimer |
Global Go To Market Strategy - 2030
Export potential enables firms to identify high-growth global markets with greater confidence by combining advanced trade intelligence with a structured quantitative methodology. The framework analyzes emerging demand trends and country-level import patterns while integrating macroeconomic and trade datasets such as GDP and population forecasts, bilateral import–export flows, tariff structures, elasticity differentials between developed and developing economies, geographic distance, and import demand projections. Using weighted trade values from 2020–2024 as the base period to project country-to-country export potential for 2030, these inputs are operationalized through calculated drivers such as gravity model parameters, tariff impact factors, and projected GDP per-capita growth. Through an analysis of hidden potentials, demand hotspots, and market conditions that are most favorable to success, this method enables firms to focus on target countries, maximize returns, and global expansion with data, backed by accuracy.
By factoring in the projected importer demand gap that is currently unmet and could be potential opportunity, it identifies the potential for the Exporter (Country) among 190 countries, against the general trade analysis, which identifies the biggest importer or exporter.
To discover high-growth global markets and optimize your business strategy:
Click Here
Pricing
- Single User License$ 1,995
- Department License$ 2,400
- Site License$ 3,120
- Global License$ 3,795

Leadership Perspectives from Industry Events
Search
Thought Leadership and Analyst Meet


Our Clients
6WResearch In News
- India Air Conditioner Market Set for Strong Rebound in 2026 After Weather-Led Correction and GST-Driven Recovery: 6Wresearch
- ADAS in India: How Automatic Emergency Braking, Blind Spot Detection & Driver Monitoring are Transforming Road Safety
- Doha a strategic location for EV manufacturing hub: IPA Qatar
- Demand for luxury TVs surging in the GCC, says Samsung
- Empowering Growth: The Thriving Journey of Bangladesh’s Cable Industry
- Demand for luxury TVs surging in the GCC, says Samsung
Latest Reports
- Nicaragua RPG Gaming Market (2026-2032)
- New Zealand RPG Gaming Market (2026-2032)
- Netherlands RPG Gaming Market (2026-2032)
- Nauru RPG Gaming Market (2026-2032)
- Namibia RPG Gaming Market (2026-2032)
- Mozambique RPG Gaming Market (2026-2032)
- Montenegro RPG Gaming Market (2026-2032)
- Mongolia RPG Gaming Market (2026-2032)
- Monaco RPG Gaming Market (2026-2032)
- Micronesia RPG Gaming Market (2026-2032)
Industry Events and Analyst Meet

HIMTEX 2026

India Refining Summit 2026

India EV Show 2026

EV tech India Expo 2026

Auto Tech Asia 2026
Whitepaper
- Middle East & Africa Commercial Security Market Click here to view more.
- Middle East & Africa Fire Safety Systems & Equipment Market Click here to view more.
- GCC Drone Market Click here to view more.
- Middle East Lighting Fixture Market Click here to view more.
- GCC Physical & Perimeter Security Market Click here to view more.