Poland Lignin Derivatives Market (2026-2032) | Strategy, Restraints, Strategic Insights, Opportunities, Segments, Investment Trends, Outlook, Segmentation, Growth, Value, Demand, Size, Forecast, Share, Competitive, Drivers, Analysis, Revenue, Industry, Supply, Competition, Challenges, Trends, Pricing Analysis, Companies, Consumer Insights
Market Forecast By Technology Type (Sulfonation, Oxidation, Hydrogenation), By Application (Concrete Additives, Animal Feed, Cosmetics, Dye Production), By End User (Construction Companies, Livestock Farmers, Personal Care Manufacturers, Textile Industries), By Product Type (Lignosulfonates, Vanillin, Phenolic Resins, Kraft Lignin) And Competitive Landscape
| Product Code: ETC12535586 | Publication Date: Apr 2025 | Updated Date: Apr 2026 | Product Type: Market Research Report | |
| Publisher: 6Wresearch | Author: Sachin Kumar Rai | No. of Pages: 65 | No. of Figures: 34 | No. of Tables: 19 |
Poland Lignin Derivatives Market Size (2020-2030)
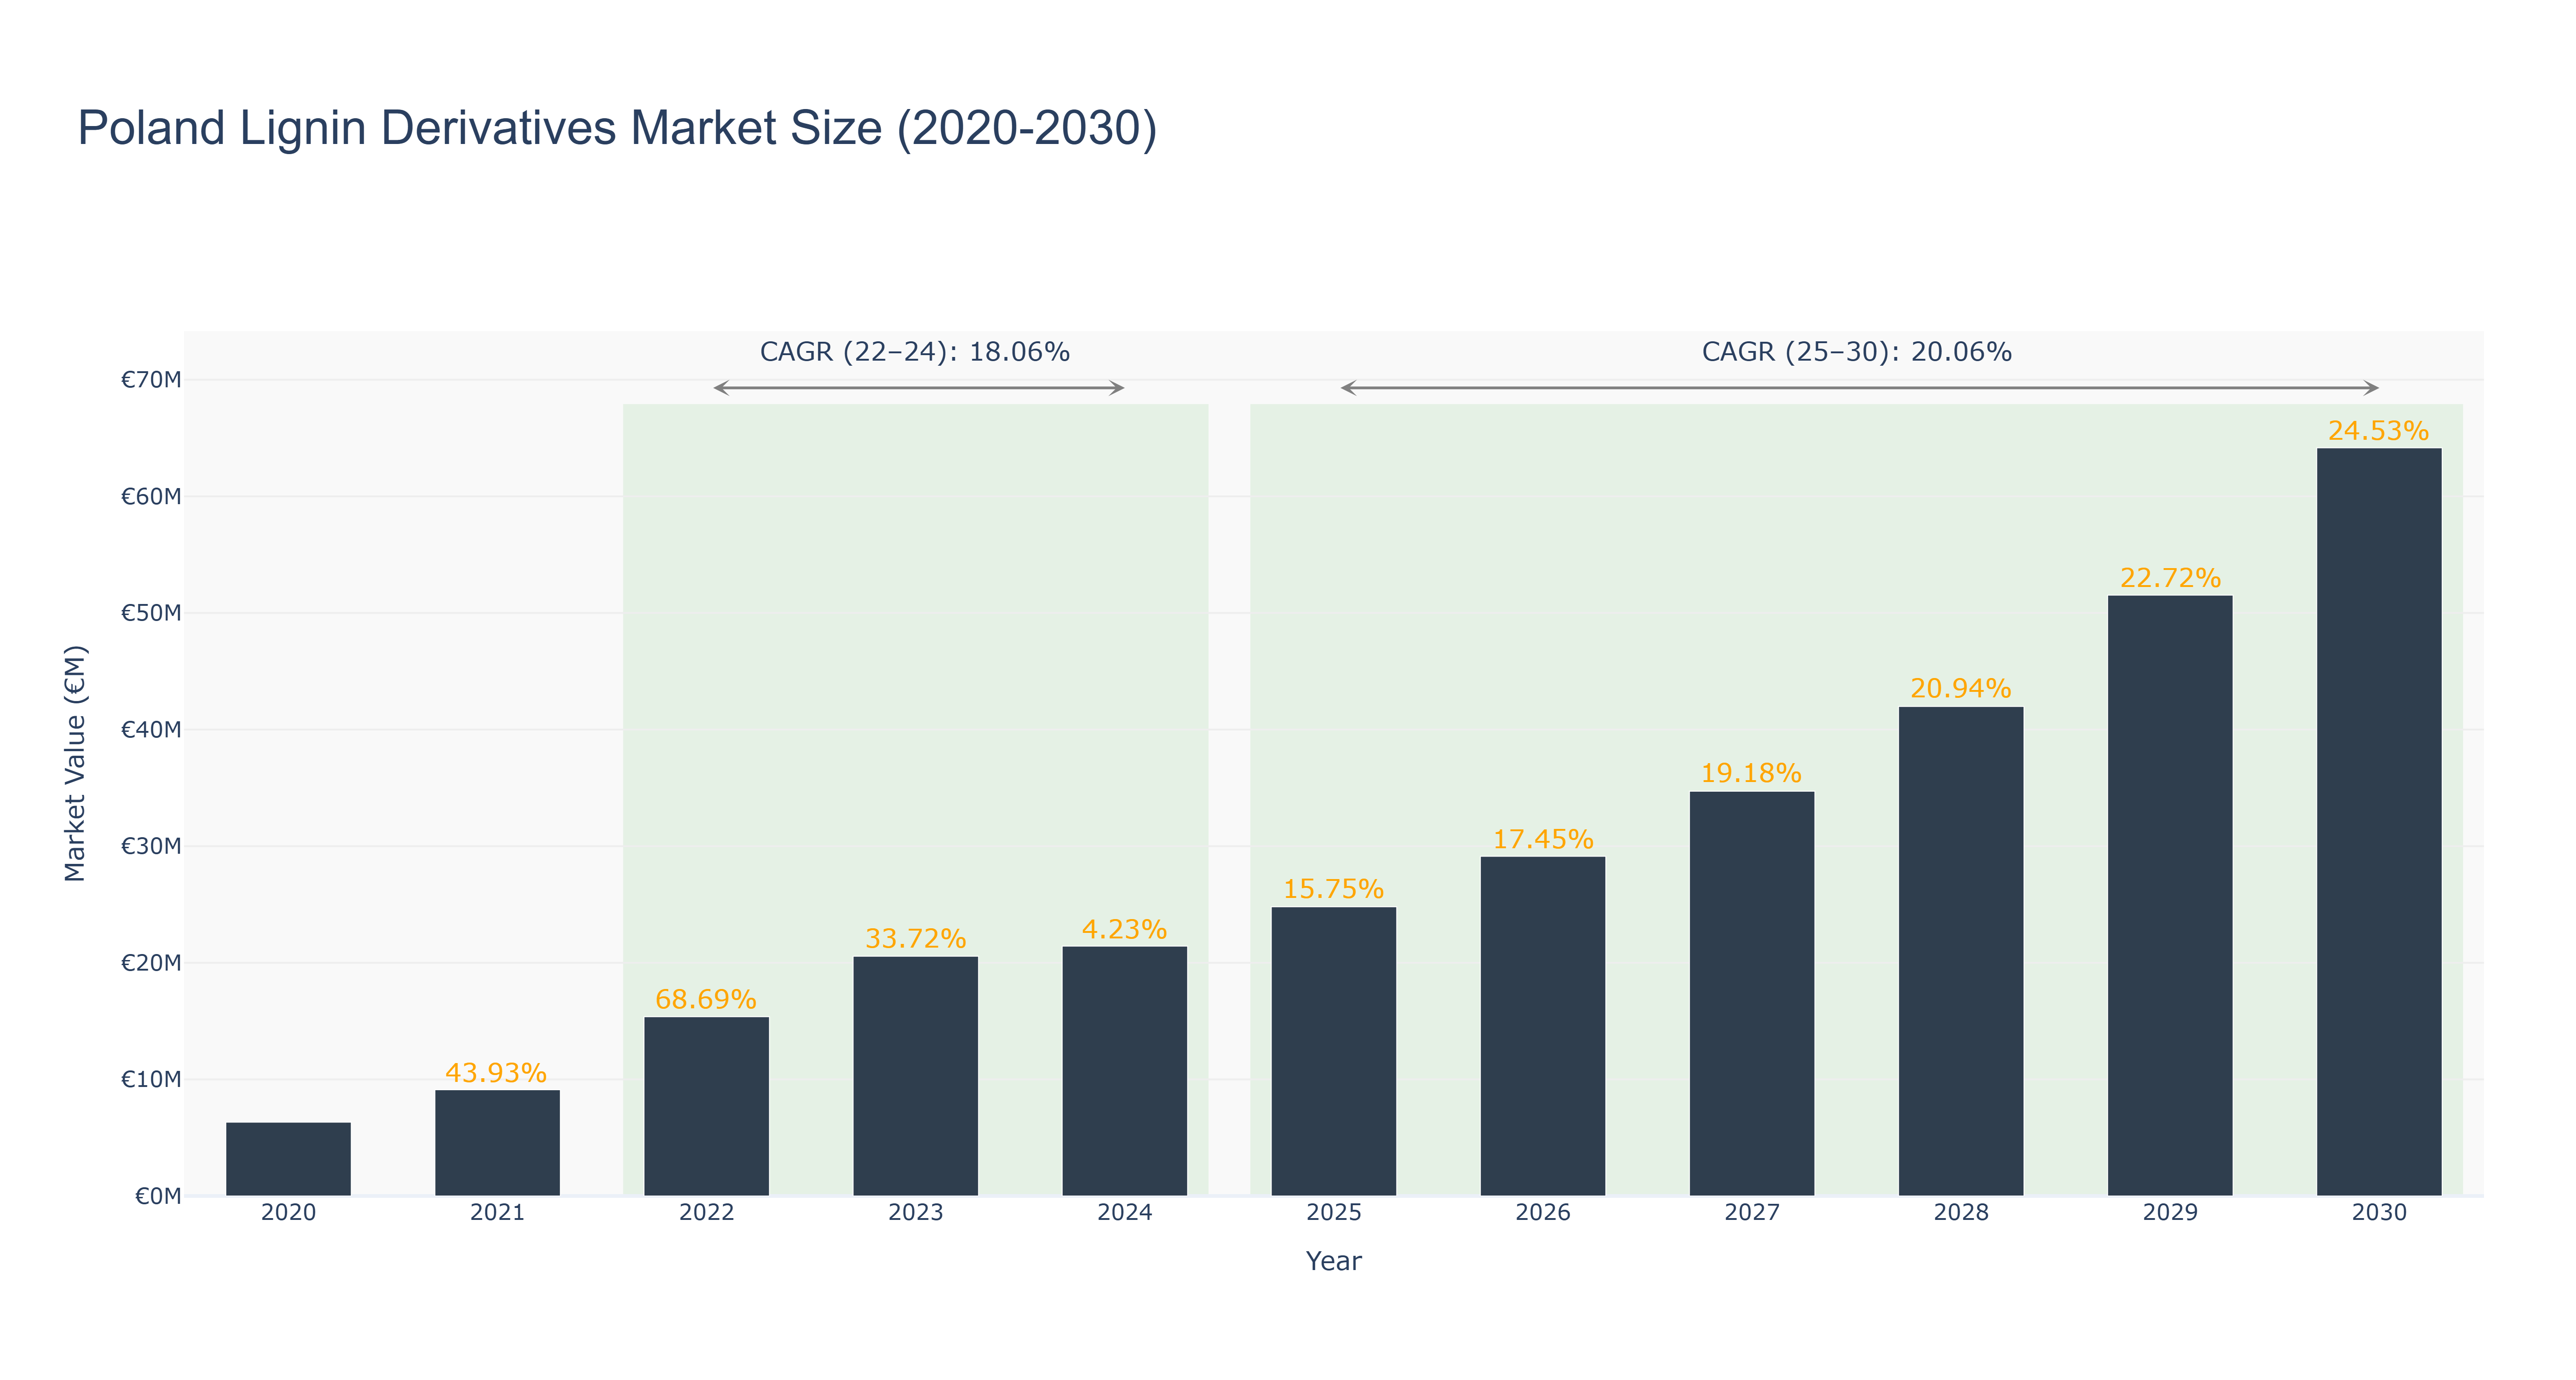
The Poland Lignin Derivatives Market has demonstrated significant growth from €6.33 million in 2020, reaching a peak of €20.56 million in 2023, with an impressive CAGR of 18.06% from 2022 to 2024. This period was characterized by strong demand for sustainable materials and bio-based products, driving market expansion. However, growth is projected to moderate to a CAGR of 20.06% from 2025 to 2030, with market size expected to reach €64.16 million by 2030. This outlook is fueled by increasing environmental regulations and a growing emphasis on renewable resources, which support lignin's application in various industries, including bioplastics and pharmaceuticals. Future developments, such as advancements in lignin extraction technologies and increased investments in green chemistry initiatives, are anticipated to bolster market growth. As stakeholders continue to embrace sustainable practices, the lignin derivatives market in Poland is poised for robust expansion in the coming years.
Poland Lignin Derivatives Market: Production & Trade Performance (2019-2025)
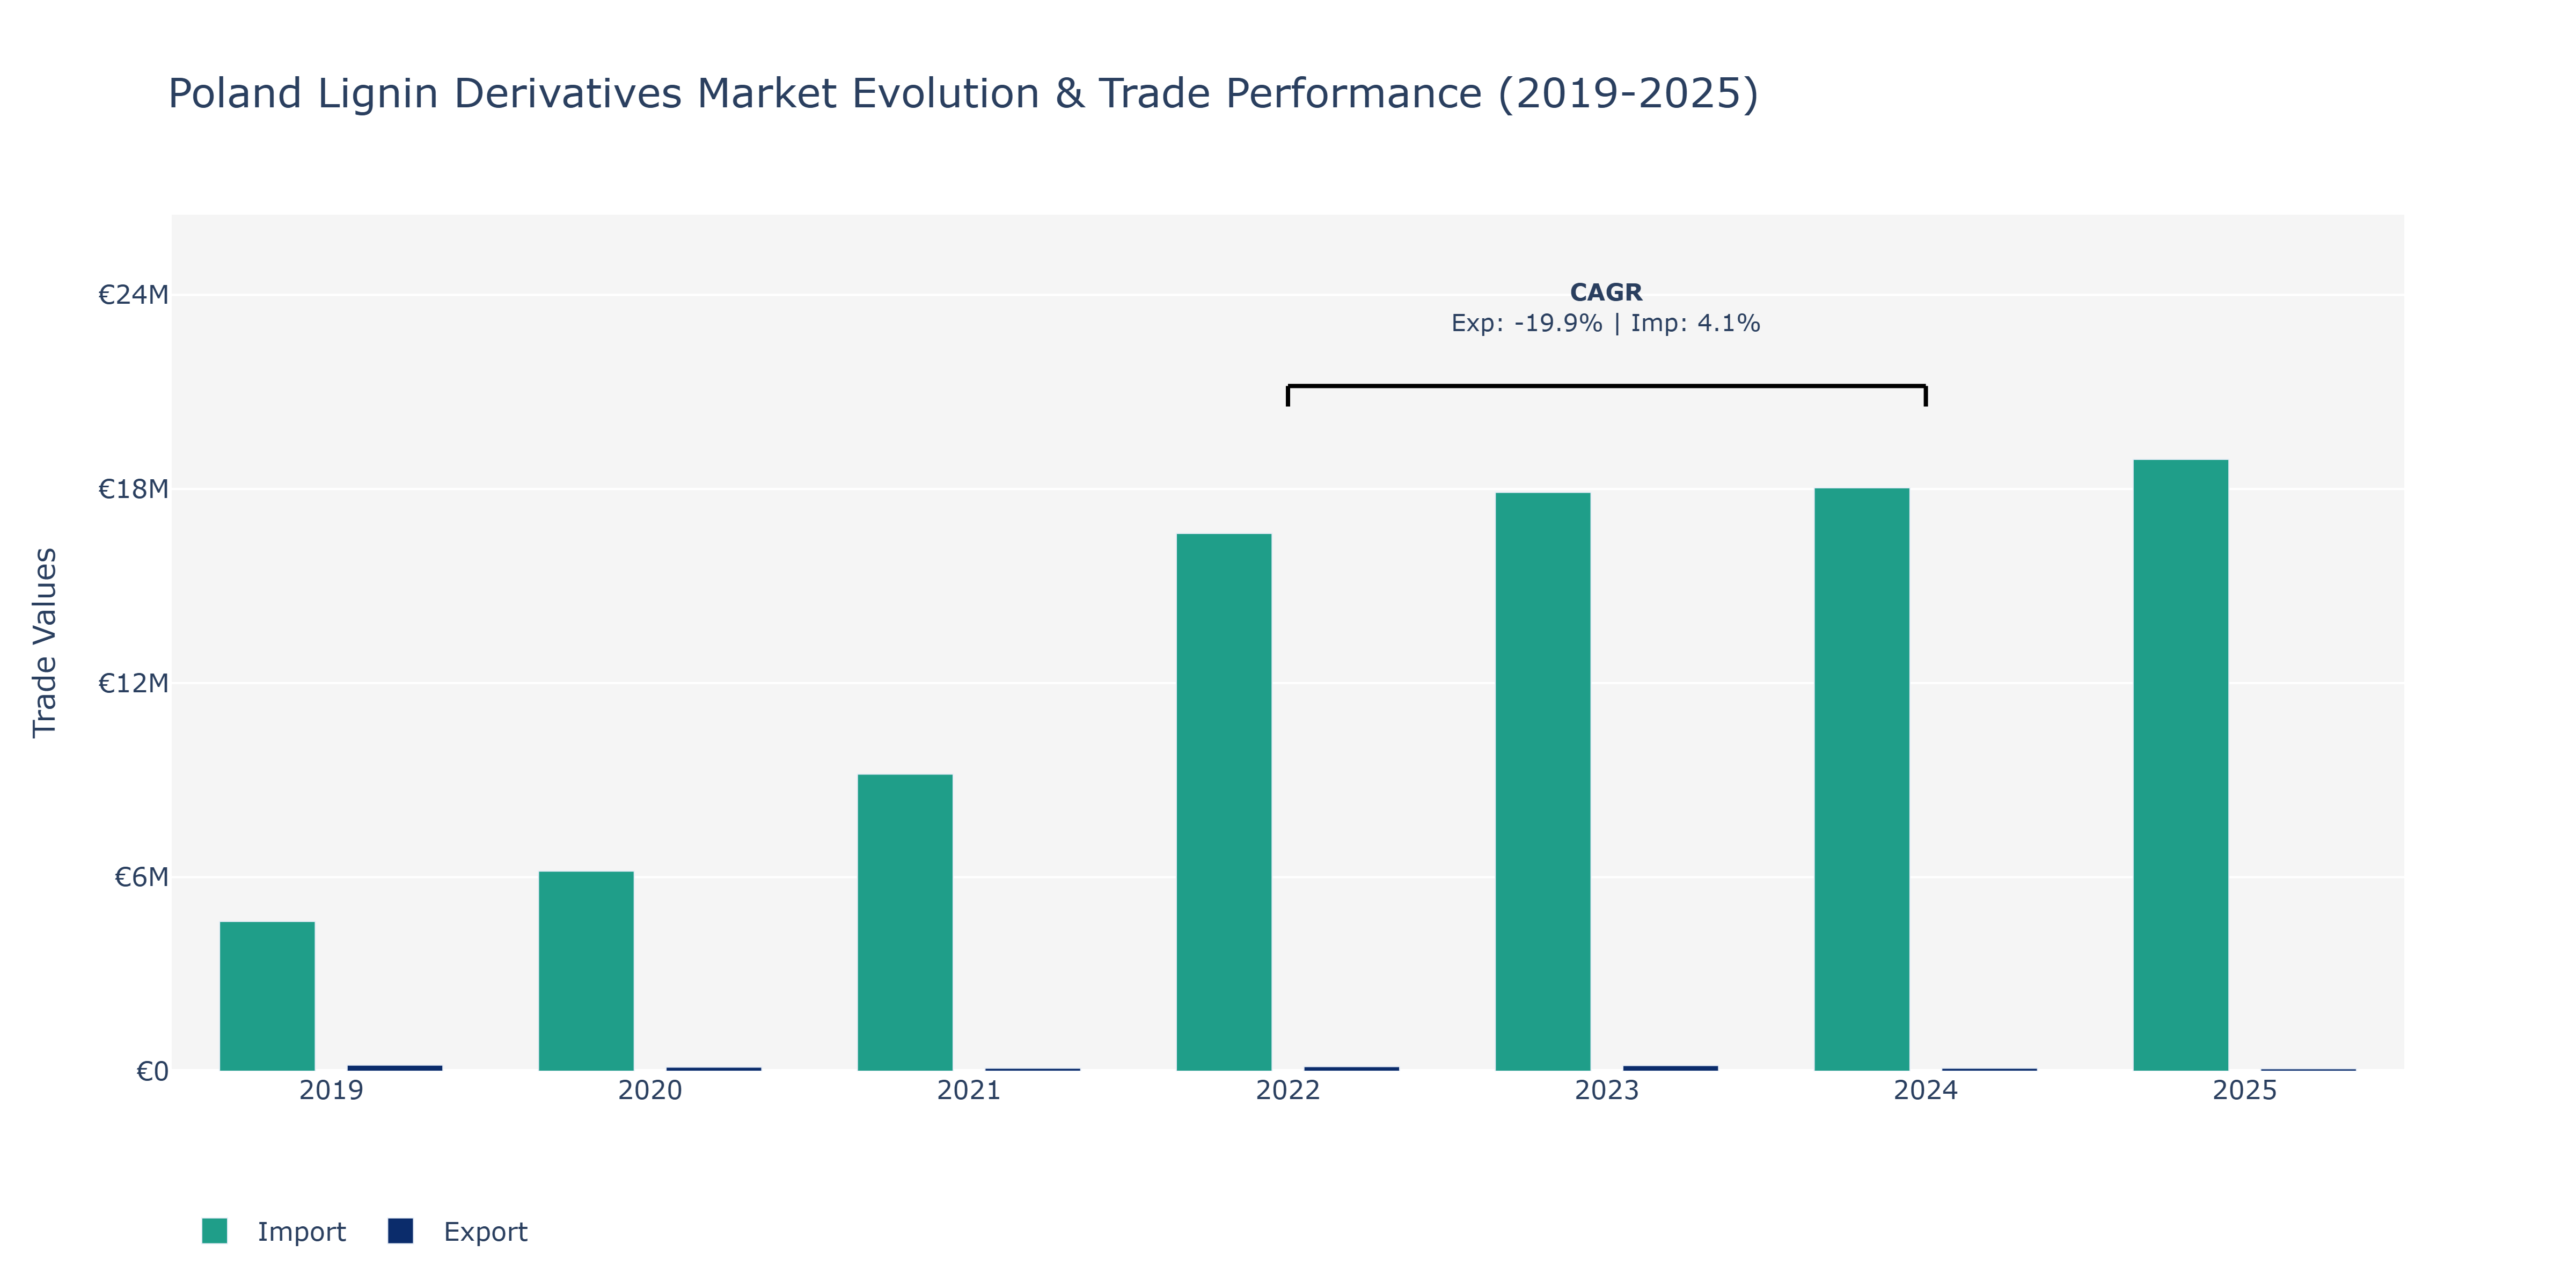
In the Poland Lignin Derivatives Market, Exports witnessed a notable fluctuation from 2019 to 2025. Starting at €185.83 thousand in 2019, exports declined to €76.37 thousand in 2025, reaching the lowest point in 2024 at €89.46 thousand. This downward trend could be attributed to various factors such as changing global demand for lignin derivatives, competitive pricing strategies by other markets, and fluctuations in raw material costs. Conversely, Imports showed a consistent upward trajectory over the same period, increasing from €4.63 million in 2019 to €18.92 million in 2025. The steady growth in imports could be linked to Poland's rising demand for raw materials and technologies for lignin derivatives production, indicating a growing reliance on foreign suppliers to meet domestic market needs. The CAGR for imports from 2022 to 2024 was 4.14%, reflecting a moderate but stable growth rate driven by increasing industrialization and technological advancements in the sector. These trends highlight the evolving dynamics within the Poland Lignin Derivatives Market, emphasizing the need for market players to adapt to changing trade patterns and consumer preferences to maintain competitiveness in the industry.
Key Highlights of the Report:
- Poland Lignin Derivatives Market Outlook
- Market Size of Poland Lignin Derivatives Market, 2025
- Forecast of Poland Lignin Derivatives Market, 2032
- Historical Data and Forecast of Poland Lignin Derivatives Revenues & Volume for the Period 2022-2032F
- Poland Lignin Derivatives Market Trend Evolution
- Poland Lignin Derivatives Market Drivers and Challenges
- Poland Lignin Derivatives Price Trends
- Poland Lignin Derivatives Porter's Five Forces
- Poland Lignin Derivatives Industry Life Cycle
- Historical Data and Forecast of Poland Lignin Derivatives Market Revenues & Volume By Technology Type for the Period 2022-2032F
- Historical Data and Forecast of Poland Lignin Derivatives Market Revenues & Volume By Sulfonation for the Period 2022-2032F
- Historical Data and Forecast of Poland Lignin Derivatives Market Revenues & Volume By Oxidation for the Period 2022-2032F
- Historical Data and Forecast of Poland Lignin Derivatives Market Revenues & Volume By Hydrogenation for the Period 2022-2032F
- Historical Data and Forecast of Poland Lignin Derivatives Market Revenues & Volume By Application for the Period 2022-2032F
- Historical Data and Forecast of Poland Lignin Derivatives Market Revenues & Volume By Concrete Additives for the Period 2022-2032F
- Historical Data and Forecast of Poland Lignin Derivatives Market Revenues & Volume By Animal Feed for the Period 2022-2032F
- Historical Data and Forecast of Poland Lignin Derivatives Market Revenues & Volume By Cosmetics for the Period 2022-2032F
- Historical Data and Forecast of Poland Lignin Derivatives Market Revenues & Volume By Dye Production for the Period 2022-2032F
- Historical Data and Forecast of Poland Lignin Derivatives Market Revenues & Volume By End User for the Period 2022-2032F
- Historical Data and Forecast of Poland Lignin Derivatives Market Revenues & Volume By Construction Companies for the Period 2022-2032F
- Historical Data and Forecast of Poland Lignin Derivatives Market Revenues & Volume By Livestock Farmers for the Period 2022-2032F
- Historical Data and Forecast of Poland Lignin Derivatives Market Revenues & Volume By Personal Care Manufacturers for the Period 2022-2032F
- Historical Data and Forecast of Poland Lignin Derivatives Market Revenues & Volume By Textile Industries for the Period 2022-2032F
- Historical Data and Forecast of Poland Lignin Derivatives Market Revenues & Volume By Product Type for the Period 2022-2032F
- Historical Data and Forecast of Poland Lignin Derivatives Market Revenues & Volume By Lignosulfonates for the Period 2022-2032F
- Historical Data and Forecast of Poland Lignin Derivatives Market Revenues & Volume By Vanillin for the Period 2022-2032F
- Historical Data and Forecast of Poland Lignin Derivatives Market Revenues & Volume By Phenolic Resins for the Period 2022-2032F
- Historical Data and Forecast of Poland Lignin Derivatives Market Revenues & Volume By Kraft Lignin for the Period 2022-2032F
- Poland Lignin Derivatives Import Export Trade Statistics
- Market Opportunity Assessment By Technology Type
- Market Opportunity Assessment By Application
- Market Opportunity Assessment By End User
- Market Opportunity Assessment By Product Type
- Poland Lignin Derivatives Top Companies Market Share
- Poland Lignin Derivatives Competitive Benchmarking By Technical and Operational Parameters
- Poland Lignin Derivatives Company Profiles
- Poland Lignin Derivatives Key Strategic Recommendations
Frequently Asked Questions About the Market Study (FAQs):
6Wresearch actively monitors the Poland Lignin Derivatives Market and publishes its comprehensive annual report, highlighting emerging trends, growth drivers, revenue analysis, and forecast outlook. Our insights help businesses to make data-backed strategic decisions with ongoing market dynamics. Our analysts track relevent industries related to the Poland Lignin Derivatives Market, allowing our clients with actionable intelligence and reliable forecasts tailored to emerging regional needs.
Yes, we provide customisation as per your requirements. To learn more, feel free to contact us on sales@6wresearch.com
1 Executive Summary |
2 Introduction |
2.1 Key Highlights of the Report |
2.2 Report Description |
2.3 Market Scope & Segmentation |
2.4 Research Methodology |
2.5 Assumptions |
3 Poland Lignin Derivatives Market Overview |
3.1 Poland Country Macro Economic Indicators |
3.2 Poland Lignin Derivatives Market Revenues & Volume, 2022 & 2032F |
3.3 Poland Lignin Derivatives Market - Industry Life Cycle |
3.4 Poland Lignin Derivatives Market - Porter's Five Forces |
3.5 Poland Lignin Derivatives Market Revenues & Volume Share, By Technology Type, 2022 & 2032F |
3.6 Poland Lignin Derivatives Market Revenues & Volume Share, By Application, 2022 & 2032F |
3.7 Poland Lignin Derivatives Market Revenues & Volume Share, By End User, 2022 & 2032F |
3.8 Poland Lignin Derivatives Market Revenues & Volume Share, By Product Type, 2022 & 2032F |
4 Poland Lignin Derivatives Market Dynamics |
4.1 Impact Analysis |
4.2 Market Drivers |
4.2.1 Increasing demand for eco-friendly products and sustainable solutions in various industries |
4.2.2 Growing emphasis on the use of renewable raw materials in manufacturing processes |
4.2.3 Rising investments in research and development for lignin derivatives applications |
4.3 Market Restraints |
4.3.1 High production costs associated with lignin derivatives |
4.3.2 Limited availability of raw materials for lignin production |
4.3.3 Intense competition from alternative chemicals and materials in the market |
5 Poland Lignin Derivatives Market Trends |
6 Poland Lignin Derivatives Market, By Types |
6.1 Poland Lignin Derivatives Market, By Technology Type |
6.1.1 Overview and Analysis |
6.1.2 Poland Lignin Derivatives Market Revenues & Volume, By Technology Type, 2022 - 2032F |
6.1.3 Poland Lignin Derivatives Market Revenues & Volume, By Sulfonation, 2022 - 2032F |
6.1.4 Poland Lignin Derivatives Market Revenues & Volume, By Oxidation, 2022 - 2032F |
6.1.5 Poland Lignin Derivatives Market Revenues & Volume, By Hydrogenation, 2022 - 2032F |
6.2 Poland Lignin Derivatives Market, By Application |
6.2.1 Overview and Analysis |
6.2.2 Poland Lignin Derivatives Market Revenues & Volume, By Concrete Additives, 2022 - 2032F |
6.2.3 Poland Lignin Derivatives Market Revenues & Volume, By Animal Feed, 2022 - 2032F |
6.2.4 Poland Lignin Derivatives Market Revenues & Volume, By Cosmetics, 2022 - 2032F |
6.2.5 Poland Lignin Derivatives Market Revenues & Volume, By Dye Production, 2022 - 2032F |
6.3 Poland Lignin Derivatives Market, By End User |
6.3.1 Overview and Analysis |
6.3.2 Poland Lignin Derivatives Market Revenues & Volume, By Construction Companies, 2022 - 2032F |
6.3.3 Poland Lignin Derivatives Market Revenues & Volume, By Livestock Farmers, 2022 - 2032F |
6.3.4 Poland Lignin Derivatives Market Revenues & Volume, By Personal Care Manufacturers, 2022 - 2032F |
6.3.5 Poland Lignin Derivatives Market Revenues & Volume, By Textile Industries, 2022 - 2032F |
6.4 Poland Lignin Derivatives Market, By Product Type |
6.4.1 Overview and Analysis |
6.4.2 Poland Lignin Derivatives Market Revenues & Volume, By Lignosulfonates, 2022 - 2032F |
6.4.3 Poland Lignin Derivatives Market Revenues & Volume, By Vanillin, 2022 - 2032F |
6.4.4 Poland Lignin Derivatives Market Revenues & Volume, By Phenolic Resins, 2022 - 2032F |
6.4.5 Poland Lignin Derivatives Market Revenues & Volume, By Kraft Lignin, 2022 - 2032F |
7 Poland Lignin Derivatives Market Import-Export Trade Statistics |
7.1 Poland Lignin Derivatives Market Export to Major Countries |
7.2 Poland Lignin Derivatives Market Imports from Major Countries |
8 Poland Lignin Derivatives Market Key Performance Indicators |
8.1 Percentage increase in research and development expenditure for lignin derivatives applications |
8.2 Number of new partnerships or collaborations for expanding market reach |
8.3 Growth rate of patent filings related to innovative lignin derivatives technologies |
8.4 Adoption rate of lignin derivatives in key industries |
8.5 Average selling price of lignin derivatives compared to traditional alternatives |
9 Poland Lignin Derivatives Market - Opportunity Assessment |
9.1 Poland Lignin Derivatives Market Opportunity Assessment, By Technology Type, 2022 & 2032F |
9.2 Poland Lignin Derivatives Market Opportunity Assessment, By Application, 2022 & 2032F |
9.3 Poland Lignin Derivatives Market Opportunity Assessment, By End User, 2022 & 2032F |
9.4 Poland Lignin Derivatives Market Opportunity Assessment, By Product Type, 2022 & 2032F |
10 Poland Lignin Derivatives Market - Competitive Landscape |
10.1 Poland Lignin Derivatives Market Revenue Share, By Companies, 2025 |
10.2 Poland Lignin Derivatives Market Competitive Benchmarking, By Operating and Technical Parameters |
11 Company Profiles |
12 Recommendations |
13 Disclaimer |
Export potential assessment - trade Analytics for 2030
Export potential enables firms to identify high-growth global markets with greater confidence by combining advanced trade intelligence with a structured quantitative methodology. The framework analyzes emerging demand trends and country-level import patterns while integrating macroeconomic and trade datasets such as GDP and population forecasts, bilateral import–export flows, tariff structures, elasticity differentials between developed and developing economies, geographic distance, and import demand projections. Using weighted trade values from 2020–2024 as the base period to project country-to-country export potential for 2030, these inputs are operationalized through calculated drivers such as gravity model parameters, tariff impact factors, and projected GDP per-capita growth. Through an analysis of hidden potentials, demand hotspots, and market conditions that are most favorable to success, this method enables firms to focus on target countries, maximize returns, and global expansion with data, backed by accuracy.
By factoring in the projected importer demand gap that is currently unmet and could be potential opportunity, it identifies the potential for the Exporter (Country) among 190 countries, against the general trade analysis, which identifies the biggest importer or exporter.
To discover high-growth global markets and optimize your business strategy:
Click Here
Pricing
- Single User License$ 1,995
- Department License$ 2,400
- Site License$ 3,120
- Global License$ 3,795

Search
Thought Leadership and Analyst Meet


Our Clients
Latest Reports
- Canada Cloud CFD Market (2026-2032) | Size & Revenue, Industry, Growth, Competitive Landscape, Forecast, Segmentation, Value, Outlook, Trends, Share, Analysis, Companies
- Taiwan Food Delivery Platform Market (2026-2032) | Companies, Outlook, Analysis, Trends, Value, Revenue, Segmentation, Share, Forecast, Competitive Landscape, Growth, Size & Forecast
- United Kingdom (UK) Long-term Care Insurance Market (2026-2032) | Growth, Share, Consumer Insights, Drivers, Opportunities, Competition, Pricing Analysis, Segments, Restraints, Companies, Competitive, Value, Outlook, Size, Demand, Analysis, Challenges, Strategic Insights, Investment Trends, Revenue, Trends, Supply, Forecast
- United Kingdom (UK) Long Term Care Market (2026-2032) | Companies, Outlook, Analysis, Trends, Value, Revenue, Segmentation, Share, Forecast, Competitive Landscape, Growth, Size & Forecast
- Iraq Insulation and Waterproofing Market (2026-2032) | Outlook, Drivers, Growth, Size, Share, Industry, Revenue, Trends, Demand, Competitive, Strategic Insights, Opportunities, Segments, Companies, Challenges, Strategy, Consumer Insights, Analysis, Investment Trends, Value, Segmentation, Forecast, Restraints
- India Switchgear Market Outlook (2026-2032) | Size, Share, Trends, Growth, Revenue, Forecast, Analysis, Value, Outlook
- Pakistan Contraceptive Implants Market (2025-2031) | Demand, Growth, Size, Share, Industry, Pricing Analysis, Competitive, Strategic Insights, Strategy, Consumer Insights, Analysis, Investment Trends, Opportunities, Revenue, Segments, Value, Segmentation, Supply, Forecast, Restraints, Outlook, Competition, Drivers, Trends, Companies, Challenges
- Sri Lanka Packaging Market (2026-2032) | Outlook, Competition, Drivers, Trends, Demand, Pricing Analysis, Competitive, Strategic Insights, Companies, Challenges, Strategy, Consumer Insights, Analysis, Investment Trends, Opportunities, Growth, Size, Share, Industry, Revenue, Segments, Value, Segmentation, Supply, Forecast, Restraints
- India Kids Watches Market (2026-2032) | Strategy, Consumer Insights, Analysis, Investment Trends, Opportunities, Growth, Size, Share, Industry, Revenue, Segments, Value, Segmentation, Supply, Forecast, Restraints, Outlook, Competition, Drivers, Trends, Demand, Pricing Analysis, Competitive, Strategic Insights, Companies, Challenges
- Saudi Arabia Core Assurance Service Market (2025-2031) | Strategy, Consumer Insights, Analysis, Investment Trends, Opportunities, Growth, Size, Share, Industry, Revenue, Segments, Value, Segmentation, Supply, Forecast, Restraints, Outlook, Competition, Drivers, Trends, Demand, Pricing Analysis, Competitive, Strategic Insights, Companies, Challenges
Industry Events and Analyst Meet

India EV Show 2026

EV tech India Expo 2026

Auto Tech Asia 2026

Battery Tech India 2026

Smart Production Solutions Guangzhou 2026
Whitepaper
- Middle East & Africa Commercial Security Market Click here to view more.
- Middle East & Africa Fire Safety Systems & Equipment Market Click here to view more.
- GCC Drone Market Click here to view more.
- Middle East Lighting Fixture Market Click here to view more.
- GCC Physical & Perimeter Security Market Click here to view more.
6WResearch In News
- Doha a strategic location for EV manufacturing hub: IPA Qatar
- Demand for luxury TVs surging in the GCC, says Samsung
- Empowering Growth: The Thriving Journey of Bangladesh’s Cable Industry
- Demand for luxury TVs surging in the GCC, says Samsung
- Video call with a traditional healer? Once unthinkable, it’s now common in South Africa
- Intelligent Buildings To Smooth GCC’s Path To Net Zero