Poland Quinones Market (2026-2032) Outlook | Industry, Trends, Size, Revenue, Growth, Share, Analysis, Companies, Forecast & Value
Market Forecast By Type (Benzene Quinone, Naphthalene Quinone, Anthraquinone, Others), By Application (Pharmaceutical, Chemical Intermediates, Dye Intermediates, Others) And Competitive Landscape
| Product Code: ETC343755 | Publication Date: Aug 2022 | Updated Date: Apr 2026 | Product Type: Market Research Report | |
| Publisher: 6Wresearch | Author: Ravi Bhandari | No. of Pages: 75 | No. of Figures: 35 | No. of Tables: 20 |
Poland Quinones Market Size (2020-2030)
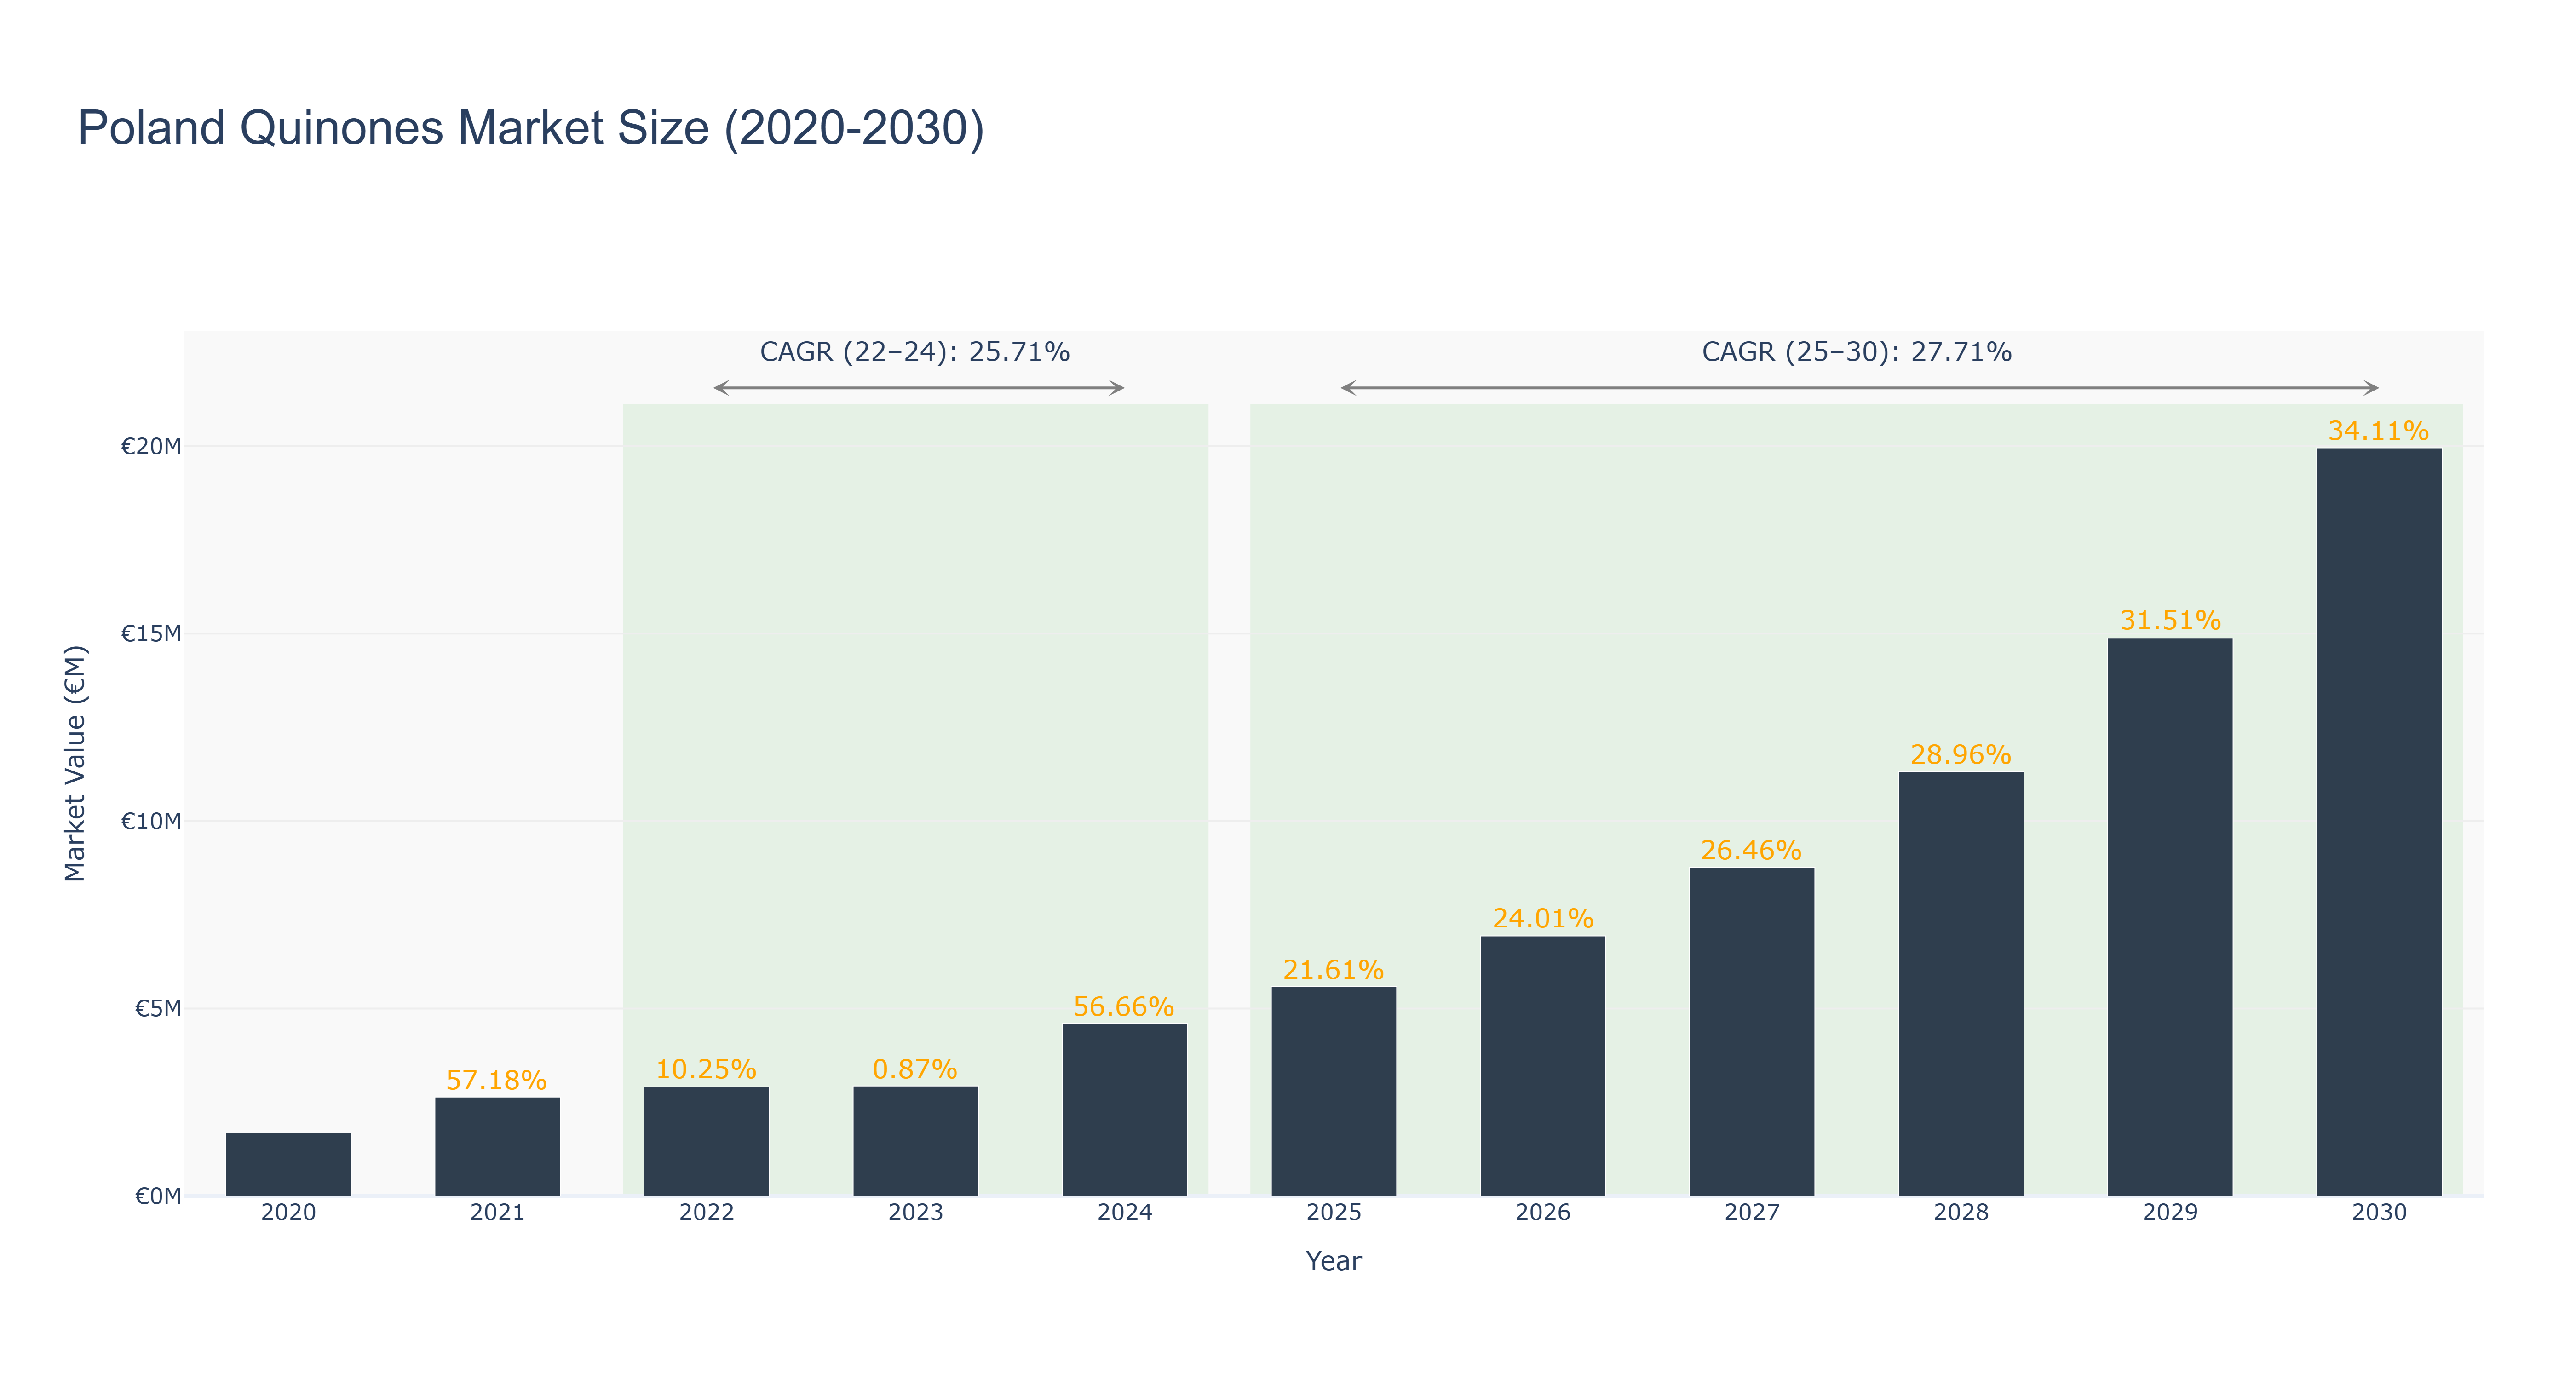
The Poland Quinones Market demonstrated significant growth from 2020 to 2024, peaking at a market size of €4.60 million in 2024, reflecting a robust CAGR of 25.71% during the actual data period from 2022 to 2024. The market saw fluctuating growth rates, with a notable spike of 56.66% in 2024, attributed to increased demand for quinones in pharmaceuticals and agrochemicals, alongside advancements in production technologies. Looking ahead, the forecasted period from 2025 to 2030 anticipates a continued upward trajectory, with projected market sizes reaching €19.95 million by 2030, driven by a higher CAGR of 27.71%. This growth will likely be bolstered by ongoing research and development initiatives in the chemical sector and the expansion of applications in emerging industries. As Poland enhances its production capabilities, the Quinones Market is poised to capitalize on these macroeconomic trends, further solidifying its role within the European chemicals landscape.
Poland Quinones Market: Production & Trade Performance (2019-2025)
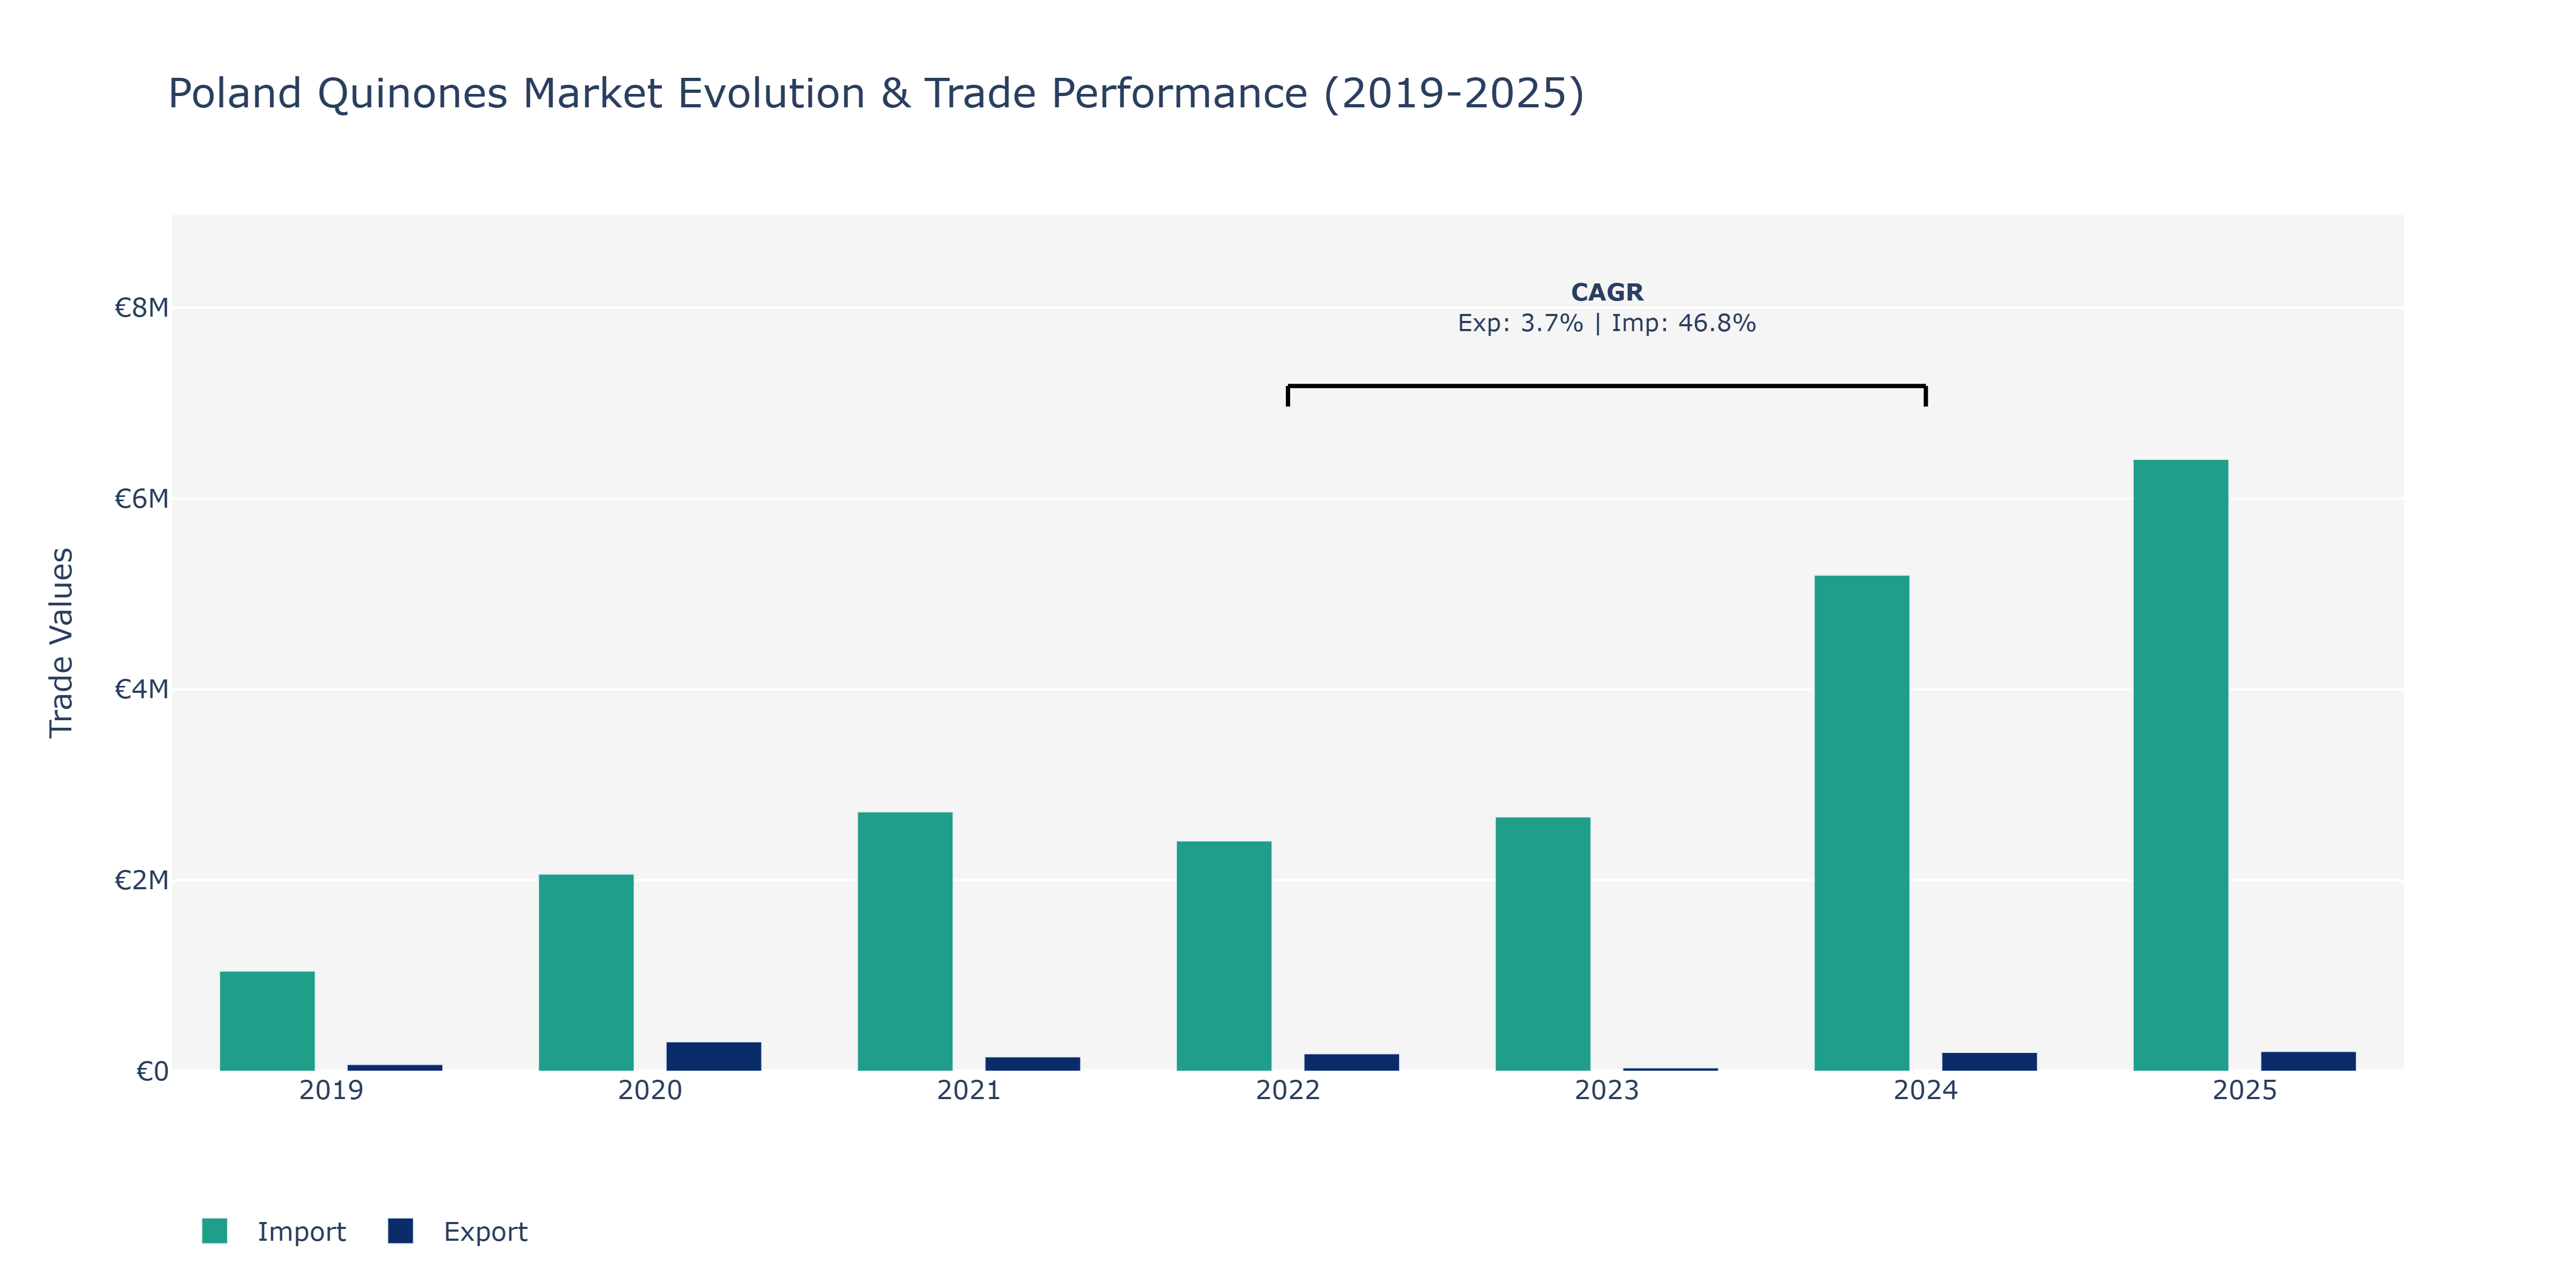
The Poland Quinones Market witnessed fluctuations in both Exports and Imports from 2019 to 2025. From 2019 to 2020, Exports surged from €70.34 thousand to €307.85 thousand, likely driven by increased demand or expanded market reach. However, a sharp decline to €150.42 thousand in 2021 suggests potential market challenges or regulatory changes impacting outbound trade. Despite a partial recovery in 2022 to €183.27 thousand, exports fell significantly in 2023 to €35.55 thousand before rebounding to €197.2 thousand in 2024. This rollercoaster trend could be influenced by factors such as global market conditions, trade agreements, or shifts in consumer preferences. On the other hand, Imports consistently increased over the years, starting at €1.05 million in 2019 and peaking at €6.41 million in 2025. The notable 46.77% CAGR for Imports from 2022 to 2024 indicates a rapid growth rate possibly due to increased domestic demand, technological advancements, or strategic sourcing decisions. Such Import growth aligns with the market's need for raw materials or intermediate goods to sustain its operations, positioning Poland as a key player in the Quinones Market.
Key Highlights of the Report:
- Poland Quinones Market Outlook
- Market Size of Poland Quinones Market, 2025
- Forecast of Poland Quinones Market, 2032
- Historical Data and Forecast of Poland Quinones Revenues & Volume for the Period 2022-2032F
- Poland Quinones Market Trend Evolution
- Poland Quinones Market Drivers and Challenges
- Poland Quinones Price Trends
- Poland Quinones Porter's Five Forces
- Poland Quinones Industry Life Cycle
- Historical Data and Forecast of Poland Quinones Market Revenues & Volume By Type for the Period 2022-2032F
- Historical Data and Forecast of Poland Quinones Market Revenues & Volume By Benzene Quinone for the Period 2022-2032F
- Historical Data and Forecast of Poland Quinones Market Revenues & Volume By Naphthalene Quinone for the Period 2022-2032F
- Historical Data and Forecast of Poland Quinones Market Revenues & Volume By Anthraquinone for the Period 2022-2032F
- Historical Data and Forecast of Poland Quinones Market Revenues & Volume By Others for the Period 2022-2032F
- Historical Data and Forecast of Poland Quinones Market Revenues & Volume By Application for the Period 2022-2032F
- Historical Data and Forecast of Poland Quinones Market Revenues & Volume By Pharmaceutical for the Period 2022-2032F
- Historical Data and Forecast of Poland Quinones Market Revenues & Volume By Chemical Intermediates for the Period 2022-2032F
- Historical Data and Forecast of Poland Quinones Market Revenues & Volume By Dye Intermediates for the Period 2022-2032F
- Historical Data and Forecast of Poland Quinones Market Revenues & Volume By Others for the Period 2022-2032F
- Poland Quinones Import Export Trade Statistics
- Market Opportunity Assessment By Type
- Market Opportunity Assessment By Application
- Poland Quinones Top Companies Market Share
- Poland Quinones Competitive Benchmarking By Technical and Operational Parameters
- Poland Quinones Company Profiles
- Poland Quinones Key Strategic Recommendations
Frequently Asked Questions About the Market Study (FAQs):
6Wresearch actively monitors the Poland Quinones Market and publishes its comprehensive annual report, highlighting emerging trends, growth drivers, revenue analysis, and forecast outlook. Our insights help businesses to make data-backed strategic decisions with ongoing market dynamics. Our analysts track relevent industries related to the Poland Quinones Market, allowing our clients with actionable intelligence and reliable forecasts tailored to emerging regional needs.
Yes, we provide customisation as per your requirements. To learn more, feel free to contact us on sales@6wresearch.com
1 Executive Summary |
2 Introduction |
2.1 Key Highlights of the Report |
2.2 Report Description |
2.3 Market Scope & Segmentation |
2.4 Research Methodology |
2.5 Assumptions |
3 Poland Quinones Market Overview |
3.1 Poland Country Macro Economic Indicators |
3.2 Poland Quinones Market Revenues & Volume, 2022 & 2032F |
3.3 Poland Quinones Market - Industry Life Cycle |
3.4 Poland Quinones Market - Porter's Five Forces |
3.5 Poland Quinones Market Revenues & Volume Share, By Type, 2022 & 2032F |
3.6 Poland Quinones Market Revenues & Volume Share, By Application, 2022 & 2032F |
4 Poland Quinones Market Dynamics |
4.1 Impact Analysis |
4.2 Market Drivers |
4.2.1 Growing demand for cosmetics and personal care products in Poland, which use quinones as key ingredients. |
4.2.2 Increasing awareness about the benefits of quinones in various industries, such as pharmaceuticals and agriculture. |
4.2.3 Rise in research and development activities aimed at expanding the applications of quinones in different sectors. |
4.3 Market Restraints |
4.3.1 Fluctuations in raw material prices impacting the production costs of quinones. |
4.3.2 Stringent regulations and compliance requirements related to the use of quinones in certain industries. |
5 Poland Quinones Market Trends |
6 Poland Quinones Market, By Types |
6.1 Poland Quinones Market, By Type |
6.1.1 Overview and Analysis |
6.1.2 Poland Quinones Market Revenues & Volume, By Type, 2022 - 2032F |
6.1.3 Poland Quinones Market Revenues & Volume, By Benzene Quinone, 2022 - 2032F |
6.1.4 Poland Quinones Market Revenues & Volume, By Naphthalene Quinone, 2022 - 2032F |
6.1.5 Poland Quinones Market Revenues & Volume, By Anthraquinone, 2022 - 2032F |
6.1.6 Poland Quinones Market Revenues & Volume, By Others, 2022 - 2032F |
6.2 Poland Quinones Market, By Application |
6.2.1 Overview and Analysis |
6.2.2 Poland Quinones Market Revenues & Volume, By Pharmaceutical, 2022 - 2032F |
6.2.3 Poland Quinones Market Revenues & Volume, By Chemical Intermediates, 2022 - 2032F |
6.2.4 Poland Quinones Market Revenues & Volume, By Dye Intermediates, 2022 - 2032F |
6.2.5 Poland Quinones Market Revenues & Volume, By Others, 2022 - 2032F |
7 Poland Quinones Market Import-Export Trade Statistics |
7.1 Poland Quinones Market Export to Major Countries |
7.2 Poland Quinones Market Imports from Major Countries |
8 Poland Quinones Market Key Performance Indicators |
8.1 Research and development investment in quinones-based products. |
8.2 Number of new product launches containing quinones. |
8.3 Adoption rate of quinones in emerging industries such as healthcare and agriculture. |
9 Poland Quinones Market - Opportunity Assessment |
9.1 Poland Quinones Market Opportunity Assessment, By Type, 2022 & 2032F |
9.2 Poland Quinones Market Opportunity Assessment, By Application, 2022 & 2032F |
10 Poland Quinones Market - Competitive Landscape |
10.1 Poland Quinones Market Revenue Share, By Companies, 2025 |
10.2 Poland Quinones Market Competitive Benchmarking, By Operating and Technical Parameters |
11 Company Profiles |
12 Recommendations |
13 Disclaimer |
Global Go To Market Strategy - 2030
Export potential enables firms to identify high-growth global markets with greater confidence by combining advanced trade intelligence with a structured quantitative methodology. The framework analyzes emerging demand trends and country-level import patterns while integrating macroeconomic and trade datasets such as GDP and population forecasts, bilateral import–export flows, tariff structures, elasticity differentials between developed and developing economies, geographic distance, and import demand projections. Using weighted trade values from 2020–2024 as the base period to project country-to-country export potential for 2030, these inputs are operationalized through calculated drivers such as gravity model parameters, tariff impact factors, and projected GDP per-capita growth. Through an analysis of hidden potentials, demand hotspots, and market conditions that are most favorable to success, this method enables firms to focus on target countries, maximize returns, and global expansion with data, backed by accuracy.
By factoring in the projected importer demand gap that is currently unmet and could be potential opportunity, it identifies the potential for the Exporter (Country) among 190 countries, against the general trade analysis, which identifies the biggest importer or exporter.
To discover high-growth global markets and optimize your business strategy:
Click Here
Pricing
- Single User License$ 1,995
- Department License$ 2,400
- Site License$ 3,120
- Global License$ 3,795

Leadership Perspectives from Industry Events
Search
Thought Leadership and Analyst Meet


Our Clients
6WResearch In News
- Doha a strategic location for EV manufacturing hub: IPA Qatar
- Demand for luxury TVs surging in the GCC, says Samsung
- Empowering Growth: The Thriving Journey of Bangladesh’s Cable Industry
- Demand for luxury TVs surging in the GCC, says Samsung
- Video call with a traditional healer? Once unthinkable, it’s now common in South Africa
- Intelligent Buildings To Smooth GCC’s Path To Net Zero
Latest Reports
- Taiwan Airport Wireless Infrastructure Market (2026-2032)
- Vietnam Airport Wireless Infrastructure Market (2026-2032)
- Thailand Airport Wireless Infrastructure Market (2026-2032)
- South Korea Airport Wireless Infrastructure Market (2026-2032)
- Romania Airport Wireless Infrastructure Market (2026-2032)
- Qatar Airport Wireless Infrastructure Market (2026-2032)
- Philippines Airport Wireless Infrastructure Market (2026-2032)
- Japan Airport Wireless Infrastructure Market (2026-2032)
- Taiwan Airport Winter Services Market (2026-2032)
- Vietnam Airport Winter Services Market (2026-2032)
Industry Events and Analyst Meet

HIMTEX 2026

India Refining Summit 2026

India EV Show 2026

EV tech India Expo 2026

Auto Tech Asia 2026
Whitepaper
- Middle East & Africa Commercial Security Market Click here to view more.
- Middle East & Africa Fire Safety Systems & Equipment Market Click here to view more.
- GCC Drone Market Click here to view more.
- Middle East Lighting Fixture Market Click here to view more.
- GCC Physical & Perimeter Security Market Click here to view more.