Poland Sanitary Paper Market (2026-2032) | Trends, Analysis, Forecast, COVID-19 IMPACT, Industry, Revenue, Growth, Size, Share, Outlook, Companies & Value
Market Forecast By Product Types (Tissues And Handkerchiefs, Table Napkins, Toilet Paper, Towels, Sanitary Napkins And Tampons, Disposable Diapers), By Application (Residential, Commercial) And Competitive Landscape
| Product Code: ETC010355 | Publication Date: Jun 2023 | Updated Date: Jun 2026 | Product Type: Report | |
| Publisher: 6Wresearch | Author: Ravi Bhandari | No. of Pages: 70 | No. of Figures: 35 | No. of Tables: 5 |
Poland Sanitary Paper Market Summary
The poland sanitary paper market was estimated at USD 384 Million in 2025 and is projected to reach USD 511 Million by 2032, growing at a CAGR of 4.6% from 2026 to 2032.
Poland Sanitary Paper Market Growth Rate Analysis (2021-2032)
The Poland sanitary paper market has shown stable growth, with a compound annual growth rate that reached 4.9% in 2021 and slightly increased to 5.1% in 2022. The growth trend continued in 2024 with a forecast of 5.2%, supported by rising consumer demand for hygiene products and increased investment in sustainable manufacturing processes. However, growth slightly declined to 4.6% in 2023 and again in 2026, influenced by fluctuations in raw material prices and supply chain challenges. As the market stabilizes, projections remain optimistic, with a consistent growth rate of around 4.8% to 5.2% through 2032, propelled by advancing technology and a shift towards eco-friendly products aligning with consumer expectations.
Poland Sanitary Paper Market Year-wise Growth Rate and Key Drivers
This graph highlights how the Poland Sanitary Paper Market has steadily grown over the past five years, supported by major growth factors.
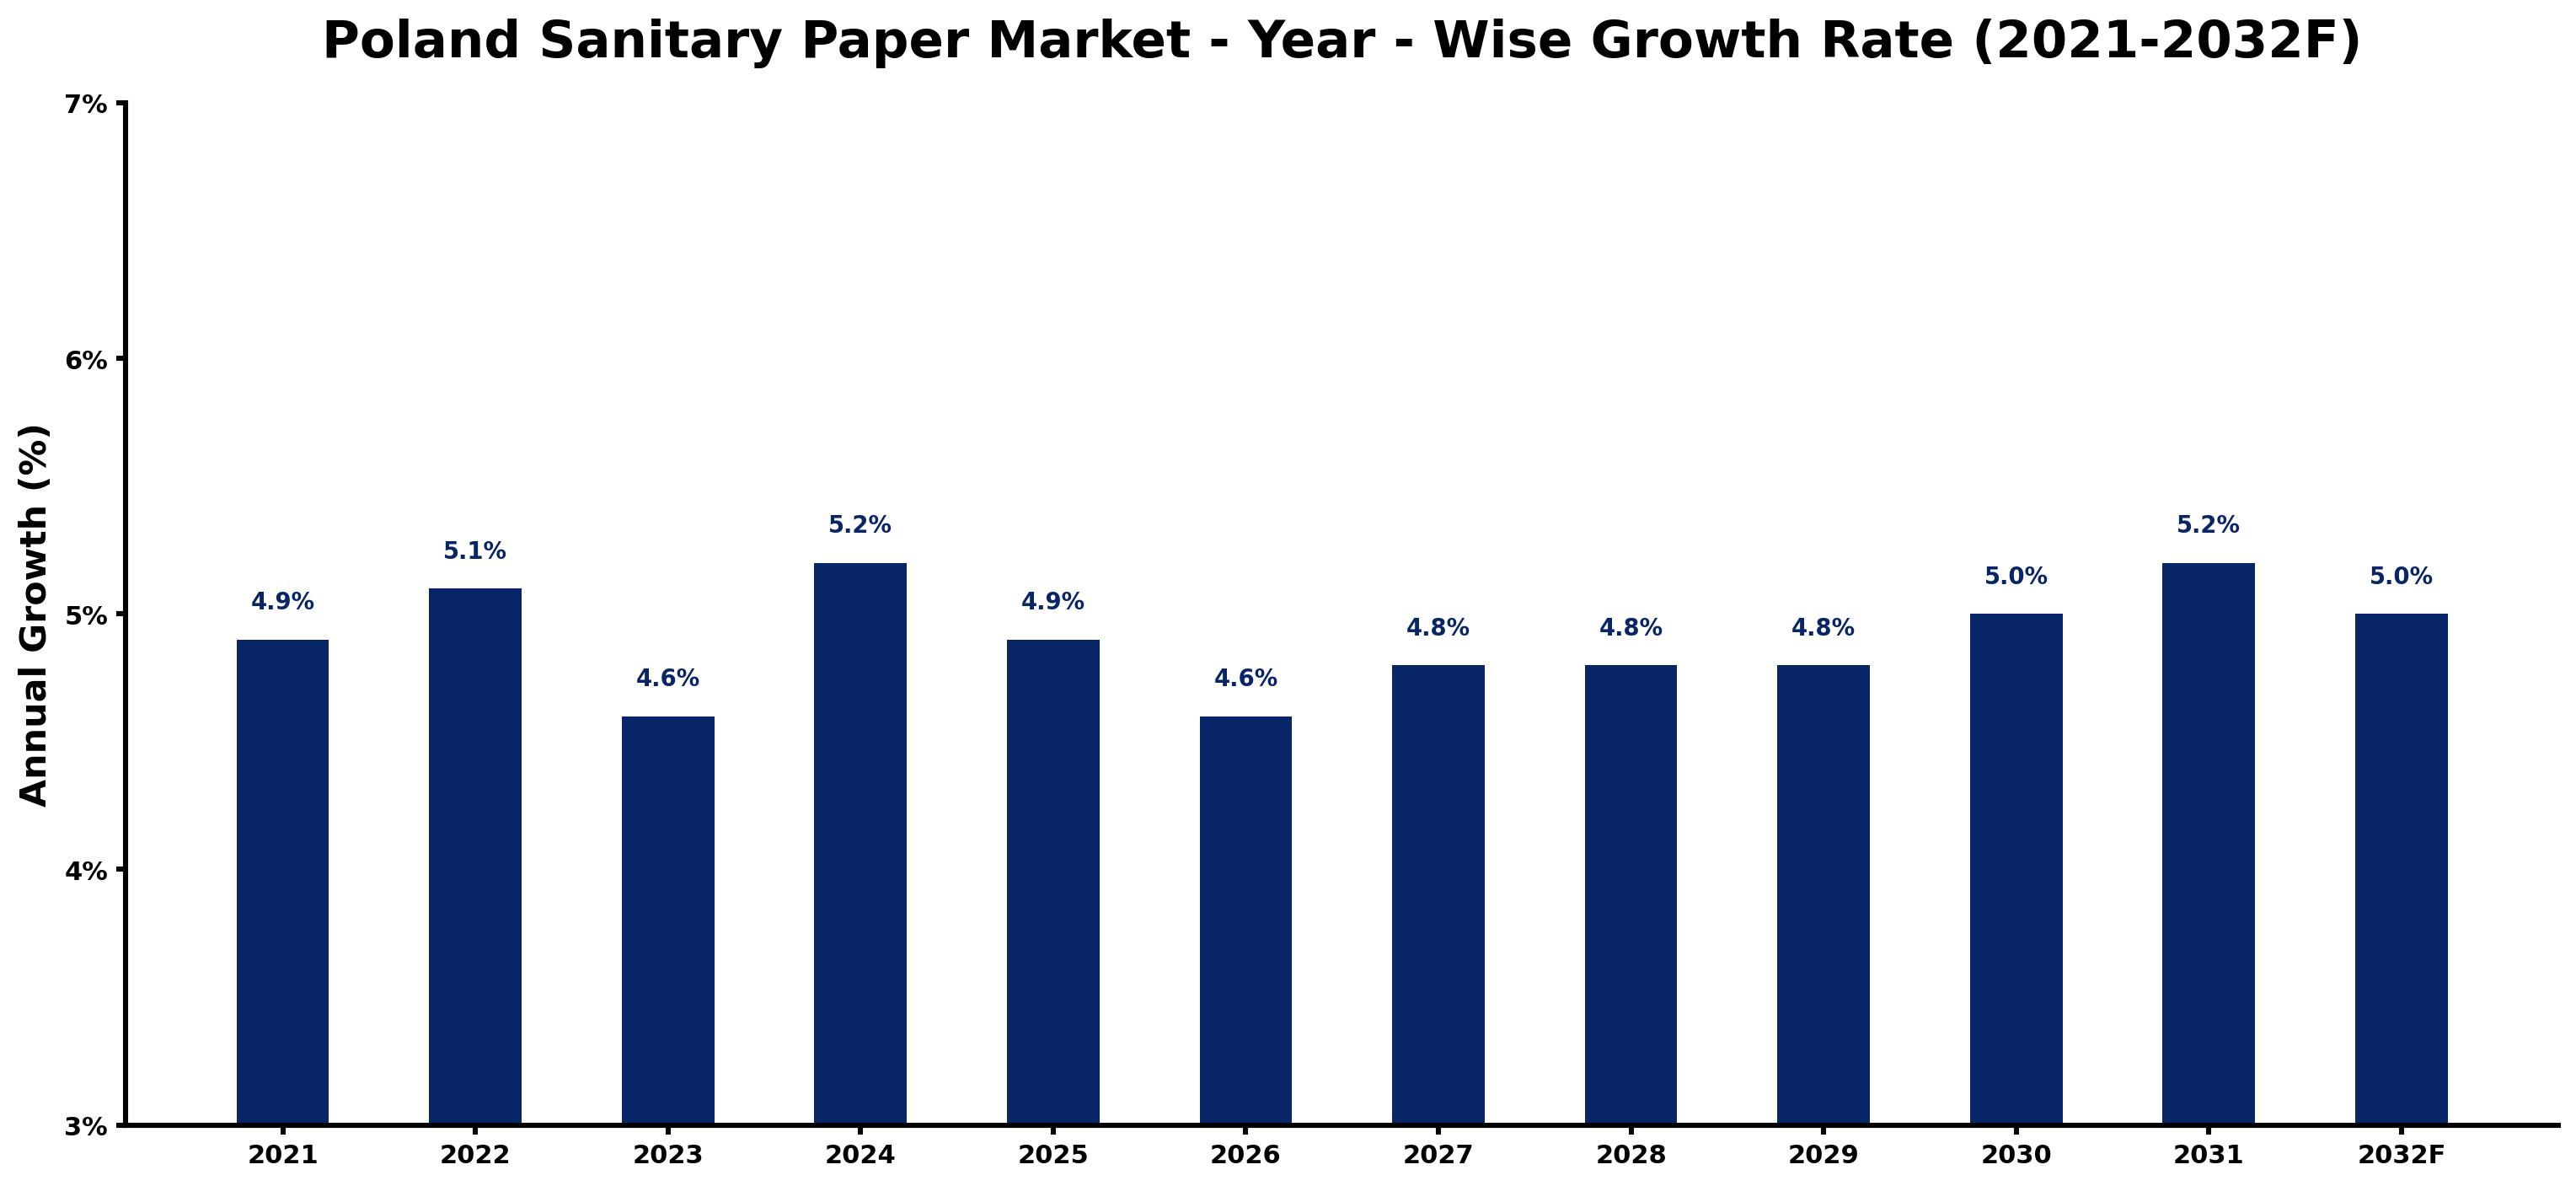
The table below presents the year wise growth rates along with the key drivers influencing the market
| Year | Growth Rate | Major Drivers |
| 2021 | 4.9% | Post-pandemic consumer habits showed heightened awareness towards hygiene and cleanliness. |
| 2022 | 5.1% | Increasing urbanization in Poland directly influences the demand for sanitary paper products. |
| 2023 | 4.6% | Sustainability trends encourage manufacturers to explore eco-friendly material alternatives. |
| 2024 | 5.2% | Enhanced distribution channels improve product accessibility across both urban and rural areas. |
| 2025 | 4.9% | Rising disposable income levels elevate consumer spending on premium sanitary papers. |
| 2026 | 4.6% | Emerging e-commerce platforms reshape retail strategies, expanding market reach significantly. |
| 2027 | 4.8% | Local manufacturers focus on innovative packaging solutions to attract environmentally-conscious buyers. |
| 2028 | 4.8% | Shifting demographics highlight a younger consumer base with distinct preferences for brands. |
| 2029 | 4.8% | Health awareness campaigns further bolster the necessity for sanitary and hygienic products. |
| 2030 | 5.0% | Investment in research and development yields advanced production techniques enhancing efficiency. |
| 2031 | 5.2% | Global supply chain stabilization fosters favorable pricing trends for raw materials. |
| 2032 | 5.0% | Increased competition stimulates product diversification, benefiting consumer choice and quality. |
Note - Market size estimations and growth projections presented in this report are based on 6Wresearch's advanced forecasting approach, validated with industry datasets as of June 2026.
Key Highlights of the Report:
- Poland Sanitary Paper Market Outlook
- Market Size of Poland Sanitary Paper Market, 2025
- Forecast of Poland Sanitary Paper Market, 2023F
- Historical Data and Forecast of Poland Sanitary Paper Revenues & Volume for the Period 2022-2032F
- Poland Sanitary Paper Market Trend Evolution
- Poland Sanitary Paper Market Drivers and Challenges
- Poland Sanitary Paper Price Trends
- Poland Sanitary Paper Porter's Five Forces
- Poland Sanitary Paper Industry Life Cycle
- Historical Data and Forecast of Poland Sanitary Paper Market Revenues & Volume By Product Types for the Period 2022-2032F
- Historical Data and Forecast of Poland Sanitary Paper Market Revenues & Volume By Tissues And Handkerchiefs for the Period 2022-2032F
- Historical Data and Forecast of Poland Sanitary Paper Market Revenues & Volume By Table Napkins for the Period 2022-2032F
- Historical Data and Forecast of Poland Sanitary Paper Market Revenues & Volume By Toilet Paper for the Period 2022-2032F
- Historical Data and Forecast of Poland Sanitary Paper Market Revenues & Volume By Towels for the Period 2022-2032F
- Historical Data and Forecast of Poland Sanitary Paper Market Revenues & Volume By Sanitary Napkins And Tampons for the Period 2022-2032F
- Historical Data and Forecast of Poland Sanitary Paper Market Revenues & Volume By Disposable Diapers for the Period 2022-2032F
- Historical Data and Forecast of Poland Sanitary Paper Market Revenues & Volume By Application? for the Period 2022-2032F
- Historical Data and Forecast of Poland Sanitary Paper Market Revenues & Volume By Residential for the Period 2022-2032F
- Historical Data and Forecast of Poland Sanitary Paper Market Revenues & Volume By Commercial for the Period 2022-2032F
- Poland Sanitary Paper Import Export Trade Statistics
- Market Opportunity Assessment By Product Types
- Market Opportunity Assessment By Application?
- Poland Sanitary Paper Top Companies Market Share
- Poland Sanitary Paper Competitive Benchmarking By Technical and Operational Parameters
- Poland Sanitary Paper Company Profiles
- Poland Sanitary Paper Key Strategic Recommendations
Frequently Asked Questions About the Market Study (FAQs):
6Wresearch actively monitors the Poland Sanitary Paper Market and publishes its comprehensive annual report, highlighting emerging trends, growth drivers, revenue analysis, and forecast outlook. Our insights help businesses to make data-backed strategic decisions with ongoing market dynamics. Our analysts track relevent industries related to the Poland Sanitary Paper Market, allowing our clients with actionable intelligence and reliable forecasts tailored to emerging regional needs.
Yes, we provide customisation as per your requirements. To learn more, feel free to contact us on sales@6wresearch.com
1 Executive Summary |
2 Introduction |
2.1 Key Highlights of the Report |
2.2 Report Description |
2.3 Market Scope & Segmentation |
2.4 Research Methodology |
2.5 Assumptions |
3 Poland Sanitary Paper Market Overview |
3.1 Poland Country Macro Economic Indicators |
3.2 Poland Sanitary Paper Market Revenues & Volume, 2022 & 2032F |
3.3 Poland Sanitary Paper Market - Industry Life Cycle |
3.4 Poland Sanitary Paper Market - Porter's Five Forces |
3.5 Poland Sanitary Paper Market Revenues & Volume Share, By Product Types, 2022 & 2032F |
3.6 Poland Sanitary Paper Market Revenues & Volume Share, By Application , 2022 & 2032F |
4 Poland Sanitary Paper Market Dynamics |
4.1 Impact Analysis |
4.2 Market Drivers |
4.3 Market Restraints |
5 Poland Sanitary Paper Market Trends |
6 Poland Sanitary Paper Market, By Types |
6.1 Poland Sanitary Paper Market, By Product Types |
6.1.1 Overview and Analysis |
6.1.2 Poland Sanitary Paper Market Revenues & Volume, By Product Types, 2016 - 2026F |
6.1.3 Poland Sanitary Paper Market Revenues & Volume, By Tissues And Handkerchiefs, 2016 - 2026F |
6.1.4 Poland Sanitary Paper Market Revenues & Volume, By Table Napkins, 2016 - 2026F |
6.1.5 Poland Sanitary Paper Market Revenues & Volume, By Toilet Paper, 2016 - 2026F |
6.1.6 Poland Sanitary Paper Market Revenues & Volume, By Towels, 2016 - 2026F |
6.1.7 Poland Sanitary Paper Market Revenues & Volume, By Sanitary Napkins And Tampons, 2016 - 2026F |
6.1.8 Poland Sanitary Paper Market Revenues & Volume, By Disposable Diapers, 2016 - 2026F |
6.2 Poland Sanitary Paper Market, By Application |
6.2.1 Overview and Analysis |
6.2.2 Poland Sanitary Paper Market Revenues & Volume, By Residential, 2016 - 2026F |
6.2.3 Poland Sanitary Paper Market Revenues & Volume, By Commercial, 2016 - 2026F |
7 Poland Sanitary Paper Market Import-Export Trade Statistics |
7.1 Poland Sanitary Paper Market Export to Major Countries |
7.2 Poland Sanitary Paper Market Imports from Major Countries |
8 Poland Sanitary Paper Market Key Performance Indicators |
9 Poland Sanitary Paper Market - Opportunity Assessment |
9.1 Poland Sanitary Paper Market Opportunity Assessment, By Product Types, 2022 & 2032F |
9.2 Poland Sanitary Paper Market Opportunity Assessment, By Application , 2022 & 2032F |
10 Poland Sanitary Paper Market - Competitive Landscape |
10.1 Poland Sanitary Paper Market Revenue Share, By Companies, 2019 |
10.2 Poland Sanitary Paper Market Competitive Benchmarking, By Operating and Technical Parameters |
11 Company Profiles |
12 Recommendations |
13 Disclaimer |
Global Go To Market Strategy - 2030
Export potential enables firms to identify high-growth global markets with greater confidence by combining advanced trade intelligence with a structured quantitative methodology. The framework analyzes emerging demand trends and country-level import patterns while integrating macroeconomic and trade datasets such as GDP and population forecasts, bilateral import–export flows, tariff structures, elasticity differentials between developed and developing economies, geographic distance, and import demand projections. Using weighted trade values from 2020–2024 as the base period to project country-to-country export potential for 2030, these inputs are operationalized through calculated drivers such as gravity model parameters, tariff impact factors, and projected GDP per-capita growth. Through an analysis of hidden potentials, demand hotspots, and market conditions that are most favorable to success, this method enables firms to focus on target countries, maximize returns, and global expansion with data, backed by accuracy.
By factoring in the projected importer demand gap that is currently unmet and could be potential opportunity, it identifies the potential for the Exporter (Country) among 190 countries, against the general trade analysis, which identifies the biggest importer or exporter.
To discover high-growth global markets and optimize your business strategy:
Click Here
Pricing
- Single User License$ 1,995
- Department License$ 2,400
- Site License$ 3,120
- Global License$ 3,795

Leadership Perspectives from Industry Events
Search
Thought Leadership and Analyst Meet


Our Clients
6WResearch In News
- India Air Conditioner Market Set for Strong Rebound in 2026 After Weather-Led Correction and GST-Driven Recovery: 6Wresearch
- ADAS in India: How Automatic Emergency Braking, Blind Spot Detection & Driver Monitoring are Transforming Road Safety
- Doha a strategic location for EV manufacturing hub: IPA Qatar
- Demand for luxury TVs surging in the GCC, says Samsung
- Empowering Growth: The Thriving Journey of Bangladesh’s Cable Industry
- Demand for luxury TVs surging in the GCC, says Samsung
Latest Reports
- Nicaragua RPG Gaming Market (2026-2032)
- New Zealand RPG Gaming Market (2026-2032)
- Netherlands RPG Gaming Market (2026-2032)
- Nauru RPG Gaming Market (2026-2032)
- Namibia RPG Gaming Market (2026-2032)
- Mozambique RPG Gaming Market (2026-2032)
- Montenegro RPG Gaming Market (2026-2032)
- Mongolia RPG Gaming Market (2026-2032)
- Monaco RPG Gaming Market (2026-2032)
- Micronesia RPG Gaming Market (2026-2032)
Industry Events and Analyst Meet

HIMTEX 2026

India Refining Summit 2026

India EV Show 2026

EV tech India Expo 2026

Auto Tech Asia 2026
Whitepaper
- Middle East & Africa Commercial Security Market Click here to view more.
- Middle East & Africa Fire Safety Systems & Equipment Market Click here to view more.
- GCC Drone Market Click here to view more.
- Middle East Lighting Fixture Market Click here to view more.
- GCC Physical & Perimeter Security Market Click here to view more.